
|
收稿日期: 2018-08-12; 预印本: 2019-02-25
基金项目: 国家重点研发计划(编号:2016YFB0501404);国家自然科学基金(编号:41571326,41801237);中国博士后科学基金(编号:2018M641245)
第一作者简介: 常雅轩,1995年生,女,硕士研究生,研究方向为植被定量遥感,核驱动模型及其热点校正。E-mail:
changyaxuan@bnu.edu.cn
通信作者简介: 焦子锑,1970年生,男,副教授,研究方向为定量遥感及其相关方向的研究。E-mail:
jiaozt@bnu.edu.cn
|
摘要
半经验、核驱动二向性反射分布函数(BRDF)模型是多角度遥感领域的一个重要模型,其热点效应在应用BRDF反演其它地表参数时有重要作用。本研究针对树冠内部叶片的间隙对热点的影响,对几何光学核的重叠函数进行热点效应的改进,并利用POLDER多角度观测数据集,对改进热点效应后的不同核函数组合模型的最优热点参数进行了确定。通过最小均方根误差(RMSE)筛选出最优热点参数,进一步分析不同模型对热点参数的敏感性和RMSE随热点参数的变化情况。结果表明:(1)该热点参数化方法可用于Ross-Li核驱动模型不同核函数组合的情况,热点校正后的模型相对于原模型很好地改善了对热点反射率的拟合能力;(2)热点参数最优值在几何光学核为LSRC (LiSparseRChen)与LDRC (LiDenseRChen)组成的模型中出现明显差别,C1在LDRC模型中的值远小于LSRC模型,主要是因为LDRC核函数自身较好考虑了树冠尺度下的热点效应,所以该热点参数改进方法起到的补偿作用较小;(3)总体上,同一模型的C1参数比C2参数对热点的变化更敏感。本研究为Ross-Li核驱动模型的热点效应进一步校正及热点参数的取值范围提供了依据,对Ross-Li模型的推广有重要意义,改进热点效应后的模型可用于未来国产多角度卫星的数据处理流程中,以获取加精确的地物热点反射率信息。
关键词
遥感, BRDF, 核驱动模型, 热点参数校正, POLDER数据, 敏感性分析
Abstract
The semi-empirical kernel-driven linear bidirectional reflectance distribution function (BRDF) model is important and has been widely used in the remote sensing community. The hotspot signature is an important characteristic of the BRDF shapes and is commonly quantified by two degrees of freedom: the hotspot height and width near the hotspot direction. This research aimed to correct the hotspot effect of the Ross–Li BRDF model for potential users by correcting the Ross and Li kernels with an exponential function of two hotspot parameters (C1/C2). This method has been developed in previous studies, but it was comprehensively applied to other kernel functions in the current study. Given the gap between leaves in the canopy, we corrected the overlap function of GO kernel with hotspot function. We analyzed the two hotspot parameters for the Ross–Li model by using the entire archive of POLDER BRDF database. First, we used six combinations of Ross and Li kernels to fit a typical single POLDER data for a specific analysis. We also analyzed the sensitivity of C1/C2 for these model combinations using the single POLDER pixel. Second, we used the entire POLDER dataset and acquired the optimum values of the hotspot parameters by using the root mean square error (RMSE) method. Finally, we analyzed the sensibility of the hotspot parameter in each model using 2D contour plots that distinctly show the variations in RMSEs as functions of C1 and C2. (1) The proposed hotspot parameterization method could be used to various combination models of Ross and Li kernels. The model with such a hotspot correction method improved the fitting ability of the hotspot signature better than the original model. (2) The optimum values of two hotspot parameters were significantly different between models, especially for the two geometric optical kernels, namely, LiSparseRChen (LSRC) and LiDenseRChen (LDRC). The value of C1 parameters in the LDRC models was generally smaller than that in the LSRC models. The possible reason could be that the LDRC kernel function modeled the hotspot effect on the canopy scale accurately, such that the role of the hotspot parameters (especially for C1) was secondary in this situation. (3) In general, the value of the C1 parameter in a single model was more sensitive to the variation in hotspot effect than the C2 parameter. This study comprehensively corrects the hotspot effect of the Ross–Li model for various applications for potential users who pay attention to the hotspot signatures of their applications. This study is also valuable for domestic multi-angle satellites in accurately reconstructing future hotspot signatures from multi-angle observations.
Key words
remote sensing, BRDF, kernel-driven model, calibration of hotspot parameters, POLDER data, analysis of sensibility
1 引 言
二向性反射分布函数BRDF(Bidirectional Reflectance Distribution Function)是定量描述地物反射率与入射和观测几何关系的函数(Nicodemus 等,1977)。BRDF模型建立了方向反射与地表参数的关系,从而为基于多角度观测反演地表参数提供了可能(Jiao 等,2011)。多角度传感器(如中分辨率成像光谱仪MODIS(Moderate-resolution Imaging Spectro-Radiometer)、多角度成像光谱辐射计MISR(Multi-angel Image Spectro-Radiometer)和地表反射的极化与方向性观测仪POLDER(Polarization and Directionality of the Earth’s Reflectance)的发展,为BRDF模型的发展提供了必要的星载多角度数据源。
在众多BRDF模型中,半经验核驱动模型由于其简单、可操作性强而得到广泛应用。Roujean等(1992)最先提出半经验模型,Wanner等(1995)进一步丰富和完善了体散射核与几何光学核,Li等(1999)提出一种从LS(LiSparse)核过渡到LD(LiDense)核的方法,即,LT(LiTransit)核。核驱动模型广泛应用于多角度遥感数据集的处理,如MODIS业务化算法中使用的RTLSR(RossThickLiSparseR)模型(Wanner 等,1995, 1997;Lucht 等,2000;Schaaf 等,2002)。
热点效应是地表各向异性的一个重要特征,它提供了陆地表面重要的结构信息。许多研究表明,被应用于中分辨率成像光谱仪(MODIS)双向反射分布函数(BRDF)/反照率产品业务化算法的核驱动RTLSR(Rossthick-LiSparseR)模型显著低估了热点方向反射率(Chen和Cihlar,1997;He 等,2012;Zhu 等,2012;Huang 等,2013;Dong 等,2014, 2016, 2018),对热点反射率的低估会影响核驱动模型在相关领域的应用情况,如植被冠层结构(Schlerf和Atzberger,2006)、树的宏观结构(Mõttus 等,2006)、下垫面反射(Canisius和Chen,2007)等,特别是对聚集指数的估算精度的影响(Lacaze 等,2002;Chen 等,2005;Leblanc 等,2005;Hill 等,2011;Pisek 等,2010, 2011a, 2011b, 2013;He 等,2012;Zhu 等,2012;Wei和Fang,2016;Dong 等,2018;Jiao 等,2018)。为解决热点低估这一问题,Chen和Cihlar(1997)基于冠层间隙率理论,针对RTR(RossThickRoujean)模型提出了模型热点的校正方法,引入代表热点宽度与高度的自由参数,进一步对核驱动模型进行热点参数化。但该方法改变了核驱动模型的线性形式,降低了计算效率,不便于模型的应用;Bréon等(2002)基于叶片尺度上光照与观测组分面积的重叠函数计算理论(Jupp和Strahler,1991),提出热点方向的反射率是关于相角的函数;Maignan等(2004)将该热点应用到RT(RossThick)核中形成RTM核,Maignan等(2004)的热点校正方法没有参数化热点宽度与高度,不能灵活地拟合热点数据;Jiao等(2016)用指数热点函数校正RT核的热点效应,并系统对比分析了校正前后的核驱动模型在估算聚集指数上的差异,结果表明,改进后模型对热点反射率的拟合误差相对于改进前降低了近70%,改进热点效应前后的核驱动模型估算的聚集指数间的差异可达20%;Jiao等(2018)基于地面聚集指数观测数据的验证结果表明,基于改进前后模型估算的聚集指数产品,对观测数据的拟合RMSE分别为0.111和0.067,改进后模型估算的聚集指数相对于改进前的拟合误差降低了约40%;Jiao和Dong(2018)针对几何光学散射占主导时,改进后的模型依然略微低估热点反射率的这一问题,进一步将该指数热点函数用于校正LSR(LiSparseR)核,从而改进了几何光学核的热点拟合情况。这些研究在叶片尺度上考虑了体散射和几何光学散射的热点效应,进一步提高了对热点反射率的拟合精度。
Jiao和Dong(2018)的研究虽然改进了几何光学核的热点拟合情况,但是其改进方法引入了两个额外的热点参数(J1和J2),增加了模型的复杂度,从而对模型的运算效率产生了一定的影响,不利于模型的业务化运行。并且上述热点改进方法仅对业务化的RTLSR模型进行了改进,并没有将该方法应用于核驱动模型的其他体散射核(如Rossthin核)和几何光学核(如LiDense和LiTransit核)中,从而影响了这些核在对应场景下的进一步应用。针对上述问题,本文将体散射核中采用的Chen和Chilar(1997)提出的热点因子,进一步应用到了几何光学核的重叠函数中,从而保持了体散射核与几何光学核热点参数的一致性,热点参数也由4个减少为2个,较之前的热点校正方法更为简洁,并对RT(RossThin)核、LTR(LiTransitR)核与LDR(LiDenseR)核也分别进行了热点校正,然后,利用2006年的POLDER-3 BRDF数据库(Bréon和Strahler,2005)以及2008年的POLDER BRDF/BPDF数据库(Bréon和Strahler,2017)对由校正后的核函数组成的模型的热点参数进行最优值的确定与分析,并进一步探索了不同模型、不同波段情况下热点参数的变化规律。本研究考虑了树冠内部叶片间隙对热点的影响,对热点进行参数化校正,为Ross-Li模型的推广以及热点参数合理应用范围的确定提供了依据。
2 数据与方法
2.1 POLDER数据及处理
法国空间研究中心(CNES)2004年发射的PARASOL(Polarization & Anisotropy of Reflectance for Atmospheric Science coupled with Observations from a Lidar)卫星上搭载了POLDER传感器。POLDER空间分辨率为6 km×7 km,最大视场角为114°,受地球曲率影响,沿轨道方向的观测天顶角为±61°,垂直轨道方向的观测天顶角为±50°。POLDER的一级数据的每个像元对地最多有16个观测角度,正由于其多角度观测的特点,在天气状况良好的情况下,通过连续多日的观测,基本可以实现全方位对地观测( Deschamps 等,1994)。由于这一特性,POLDER传感器可以获取充足的地面观测数据,这其中就包括热点处的数据,因此POLDER数据集适合模型的热点参数校正研究。
本研究选用的数据集是基于IGBP分类系统,2005年11月—2006年10月(Bréon和Strahler,2005)与2008年1月—2008年12月(Bréon和Maignan,2017)获取的POLDER数据集。经过大气校正与无云筛选获得的POLDER数据集中只包含单一地物类型的像元(Bréon和Maignan,2017)。POLDER数据不同通道的观测几何有微小的变化,为了解决这一问题并获取准确的热点观测结果,Bréon提出了参数“DVzC”和“DVzA”,以校正不同通道观测几何之间的差异。由于现有的核驱动模型对冰雪的前向散射特性的描述不够准确,所以本文所用数据去除了数据集中IGBP类型为雪和冰的数据。本文通过RMSE与热点数据的数量(相角小于5°且数量大于1)两个条件筛选得到6个波段共12785组POLDER数据。
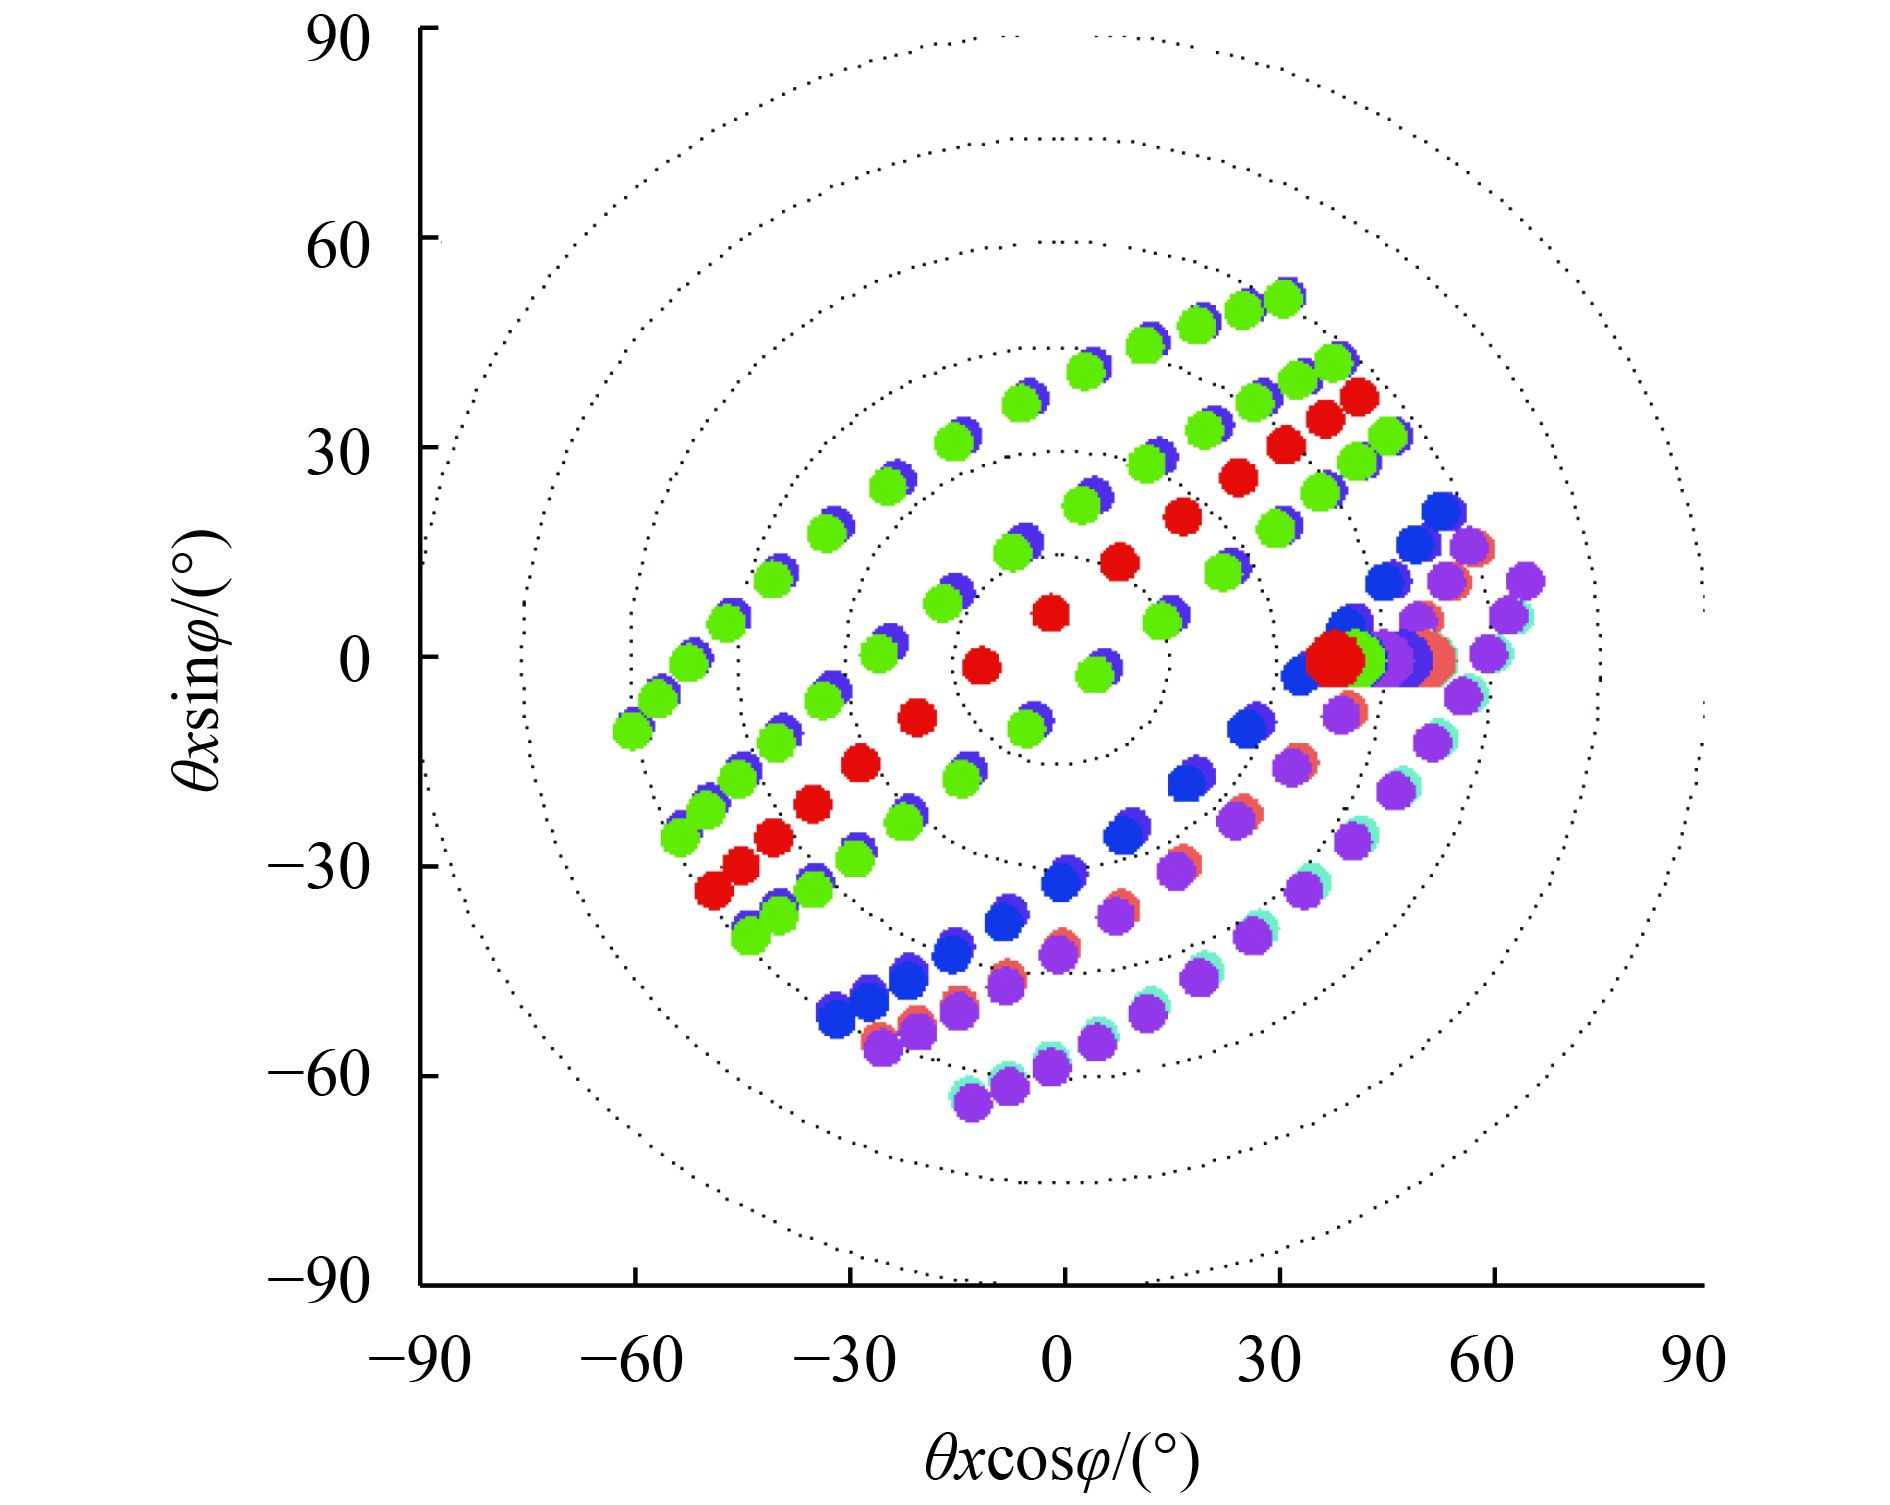
图1为一组典型POLDER数据的太阳入射与观测几何的空间分布,较大的点代表入射方向,较小的点代表观测方向,入射与观测方向之间的颜色有对应关系,其中,θ为天顶角,φ为相对方位角。从图1中可以看出,POLDER数据由于在空间中有充足的多角度观测,从而有较好的空间代表性。

2.2 核驱动模型
线性半经验核驱动模型用于多角度观测数据反演地表反照率,表达式为各向同性散射核、体散射核和几何光学核的加权和的线性组合形式(Roujean 等,1992;Wanner 等,1995;Lucht和Lewis,2000)。具体表达如下
| $\begin{split} R({\theta _i}, {\theta _v}, \phi,{\textit{λ}}) = & {f_{\rm{iso}}}({\textit{λ}}) + {f_{\rm{vol}}}({\textit{λ}}){K_{\rm{vol}}}({\theta _i}, {\theta _v}, \phi) + \\ & {f_{\rm{geo}}}({\textit{λ}}){K_{\rm{geo}}}({\theta _i}, {\theta _v}, \phi) \end{split} $ | (1) |
式中,θi与θv分别为太阳天顶角与观测天顶角,ϕ为入射方向与观测方向之间的相对方位角,λ为观测波段。fiso(λ)、fvol(λ)与fgeo(λ)分别为各向同性散射、体散射与几何光学散射对应的权重系数。Kvol(θi, θv, ϕ)与Kgeo(θi, θv, ϕ)分别为体散射核与几何光学核。R(θi, θv, ϕ, λ)代表λ波段的BRDF。
2.3 体散射核及热点校正
体散射核主要包括RT(RossThick)核(Roujean 等,1992),RTN(RossThin)核(Wanner 等,1995),RTM(RossThickMaignan)(Maignan 等,2004)与RossThickChen核(Jiao 等,2016)。
Roujean等(1992)依据Ross(1981)的单次散射辐射传输理论提出了RT核,其计算公式为
| ${K_{\rm{RossThick}}} = \frac{{\left(\dfrac{{\text{π}}}{2} - \xi \right)\cos \xi + \sin \xi }}{{\cos {\theta _i} + \cos {\theta _v}}} - \frac{{\text{π}}}{4}$ | (2) |
式中,ξ是观测方向与太阳入射方向之间的相角,其计算公式为
| $\cos \xi = \cos {\theta _i}\cos {\theta _v} + \sin {\theta _i}\sin {\theta _v}\cos \varphi $ | (3) |
Wanner等(1995)针对小叶面积指数(LAI)的情况提出了RTN核,其计算公式为
| ${K_{\rm{RossThin}}} = \frac{{\left(\dfrac{{\text{π}}}{2} - \xi \right)\cos \xi + \sin \xi }}{{\cos {\theta _i} \cdot \cos {\theta _v}}} - \frac{{\text{π}}}{2}$ | (4) |
Jiao等(2016)利用Chen和Cihlar(1997)提出的热点因子校正了RT核,改进后的核为RTC (RossThickChen)核,其公式为
| ${K_{\rm{RTC}}} = \frac{{\left(\dfrac{{\text{π}}}{2} - \xi \right)\cos \xi + \sin \xi }}{{\cos {\theta _i} + \cos {\theta _v}}} \times \left({1 + {C_1}{{\rm{e}}^{ - \frac{\xi }{{{C_2}}}}}} \right) - \frac{{\text{π}}}{4}$ | (5) |
式中,C1与C2分别为控制热点处高度与宽度的两个可变参数,二者共同组成热点函数
本文参照Jiao等(2016)采用的指数形式的热点函数进行热点改进方法,对RTN核(Wanner 等,1995)进行相应的热点效应的改进,改进后的RTN核通过添加两个可调整的热点参数,灵活地解决了热点低估的问题,将热点校正后的RTN核命名为RTNC(RossThinChen),其计算公式如下
| ${K_{\rm{RossThinChen}}} = \frac{{\left(\dfrac{{\text{π}}}{2} - \xi \right)\cos \xi + \sin \xi }}{{\cos {\theta _i} \cdot \cos {\theta _v}}} \times \left({1 + {C_1}{{\rm{e}}^{ - \frac{\xi }{{{C_2}}}}}} \right) - \frac{{\text{π}}}{2}$ | (6) |
2.4 几何光学核及热点校正
几何光学核主要包括Roujean核(Roujean 等,1992),LS核、LD核(Wanner 等,1995)与LT核(Li 等,1999),以及Li核的互易形式(Lucht和Lewis,2000)。本文只校正Li核,由于篇幅限制,对Roujean核不进行处理。
Li和Strahler(Li和Strahler,1992)提出树冠尺度上描述热点与相互遮蔽效应的公式,Wanner等(1995)通过这一公式推导出LS核,其公式如下
| $\begin{split} {K_{\rm{LiSparse}}} = & O({{\theta '}_i}, {{\theta '}_v}, t) - \sec {{\theta '}_i} - \sec {{\theta '}_v} + \\ & \frac{1}{2}(1 + \cos \xi ')\sec {{\theta '}_v} \end{split} $ | (7) |
式中,
| $O({\theta '_i}, {\theta '_v}, t) = \frac{1}{{\text{π}}}(t - \sin t \cdot \cos t)(\sec {\theta '_i} + \sec {\theta '_v})$ | (8) |
| $\cos t = \frac{h}{b}\frac{{\sqrt {{D^2}(\tan {{\theta '}_i}\tan {{\theta '}_v}\sin \varphi)} }}{{\sec {{\theta '}_i} + \sec {{\theta '}_v}}}$ | (9) |
| $D = \sqrt {{{\tan }^2}{{\theta '}_i} + {{\tan }^2}{{\theta '}_v} - 2\tan {{\theta '}_i}ta{{n'}_v}\cos \varphi } $ | (10) |
| $\cos \xi ' = \cos {\theta '_i}\cos {\theta '_v} + \sin {\theta '_i}\sin {\theta '_v}\cos \varphi $ | (11) |
| ${\theta '_{{i}}} = {\tan ^{ - 1}}\left({\frac{b}{r}\tan {\theta _i}} \right)$ | (12) |
| ${\theta '_{{v}}} = {\tan ^{ - 1}}\left({\frac{b}{r}\tan {\theta _v}} \right)$ | (13) |
式中,O是观测阴影与光照阴影之间的重叠部分,称为重叠函数。h为树冠中心距离地面的高度,b为椭球的长轴半径,r为椭球的短轴半径。h/b与b/r分别代表树冠形状与相对高度。
Wanner等(1995)针对茂密冠层提出了LD核,其计算公式为
| ${K_{\rm{LiDense}}} = \frac{{(1 + \cos \xi ')\sec {{\theta '}_v}}}{{\sec {{\theta '}_i} + \sec {{\theta '}_v} - O({{\theta '}_i}, {{\theta '}_v}, t)}} - 2$ | (14) |
LT核是介于LS与LD核之间的形式。LS核适用于小太阳天顶角的情况,并且随着太阳天顶角的增大,LD核表现的更为适用。LT核的表达式为
| ${K_{\rm{LiTransit}}} = \left\{ {\begin{array}{*{20}{c}} {{K_{\rm{LiSparse}}}} \\ {{K_{\rm{LiDense}}} = \dfrac{2}{B}{K_{\rm{LiSparse}}}} \end{array}} \right.\begin{array}{*{20}{c}} {B \leqslant 2} \\ {B > 2} \end{array}$ | (15) |
B为决定值。当外推至大太阳天顶角下的LS核时,LT核表现出更好地稳定性。
Lucht等(2000)提出Li核的互易形式,其表现公式为
| $\begin{split} {K_{\rm{LiSparseR}}} = & O({{\theta '}_i}, {{\theta '}_v}, t) - \sec {{\theta '}_i} - \sec {{\theta '}_v} + \\ & \frac{1}{2}(1 + \cos \xi ')\sec {{\theta '}_v}\sec {{\theta '}_i} \end{split} $ | (16) |
| ${K_{\rm{LiDenseR}}} = \frac{{(1 + \cos \xi ')\sec {{\theta '}_v}\sec {{\theta '}_i}}}{{\sec {{\theta '}_i} + \sec {{\theta '}_v} - O({{\theta '}_i}, {{\theta '}_v}, t)}} - 2$ | (17) |
| ${K_{\rm{LiTransitR}}} = \left\{ {\begin{array}{*{20}{c}} {{K_{\rm{LiSparseR}}}} \\ {{K_{\rm{LiDenseR}}} = \dfrac{2}{B}{K_{\rm{LiSparseR}}}} \end{array}\begin{array}{*{20}{c}} {B \leqslant 2} \\ {B > 2} \end{array}} \right.$ | (18) |
由于Li核只考虑树冠尺度上的变化(假设树冠形状为一实心椭球体),对于树冠内叶片尺度间隙率没有考虑,Jiao等(2018)基于Chen等(Chen和Cihlar,1997)得到的热点函数,对几何光学核LSR(LiSparseR)核进行热点校正,校正后的LSRC(LiSparseRChen)核计算公式为
| $\begin{split} {K_{\rm{LiSparseRC}}} = & O({{\theta '}_i}, {{\theta '}_v}, t)\left({1 + {C_1}{{\rm{e}}^{ - \frac{\xi }{{{C_2}}}}}} \right) - \sec {{\theta '}_i} - \\ & \sec {{\theta '}_v} + \frac{1}{2}(1 + \cos \xi ')\sec {{\theta '}_v}\sec {{\theta '}_i} \end{split} $ | (19) |
本文参照该方法分别对LDR(LiDenseR)核与LTR(LiTransitR)核进行了热点校正,这种形式的热点改进不仅统一了体散射核与几何光学核的热点参数,简化了模型,同时也解决了几何光学核起主导作用时模型热点的低估问题。将热点校正后的LDR核与LTR核称为LDRC(LiDenseRChen)核与LTRC(LiTransitRChen)核,其计算公式分别为
| ${K_{\rm{LiDenseRC}}} = \frac{{(1 + \cos \xi ')\sec {{\theta '}_v}\sec {{\theta '}_i}}}{{\sec {{\theta '}_i} + \sec {{\theta '}_v} - O({{\theta '}_i}, {{\theta '}_v}, t)\left({1 + {C_1}{{\rm{e}}^{ - \frac{\xi }{{{C_2}}}}}} \right)}} - 2$ | (20) |
| ${K_{\rm{LiTransitRC}}} = \left\{ {\begin{array}{*{20}{c}} {{K_{\rm{LiSparseRC}}}} \\ {{K_{\rm{LiDenseRC}}} = \dfrac{2}{B}{K_{\rm{LiSparseRC}}}} \end{array}\begin{array}{*{20}{c}} {B \leqslant 2} \\ {B > 2} \end{array}} \right.$ | (21) |
2.5 热点校正后核形状及误差评价方法
图2为改进热点效应后各个核的形状,对应的太阳天顶角为45°。体散射核在前向呈现上升趋势,形状有明显的碗边效应,几何光学核中,LSRC核在前向呈现明显的下降趋势,LTRC与LDRC在前向呈现相似且较缓慢的线性下降趋势。LTRC核在热点附近与LSRC核形状基本重合,在大角度下与LDRC核形状完全重合。进行热点校正后的体散射核与几何光学核共组成6种核驱动模型(表1)。本文利用MakeMAT软件(Dong 等,2016)变换热点参数,实现不同核驱动模型对单组典型POLDER数据的拟合,利用POLDER数据库确定最优热点参数, 方法参照Jiao等(2016)利用RTCLSR模型对MODIS数据7个波段数据确定最优热点参数的方法,即,选取最小RMSE对应的热点参数值作为最优参数,对比分析不同核与不同波段之间的结果。RMSE与决定系数等质量评价指标可以比较不同模型之间的差异,其中RMSE表达式如下
| ${\rm{RMSE}} = \sqrt {\frac{{\sum\limits_{j = 1}^n {{{\left({{R_{obs}}({\theta _i}, {\theta _v}, \phi, {\textit{λ}}) - {R_{od el}}({\theta _i}, {\theta _v}, \phi, \lambda)} \right)}^2}} }}{{n - 3}}} $ | (22) |
式中,Robs(θi, θv, ϕ, λ)与Rmodel(θi, θv, ϕ, λ)分别代表反射率的观测值与模型模拟值,n代表 观测数据中观测的数量。RMSE反映了多角度数据的模型拟合效果,其值越小,代表模型拟合结果越好。
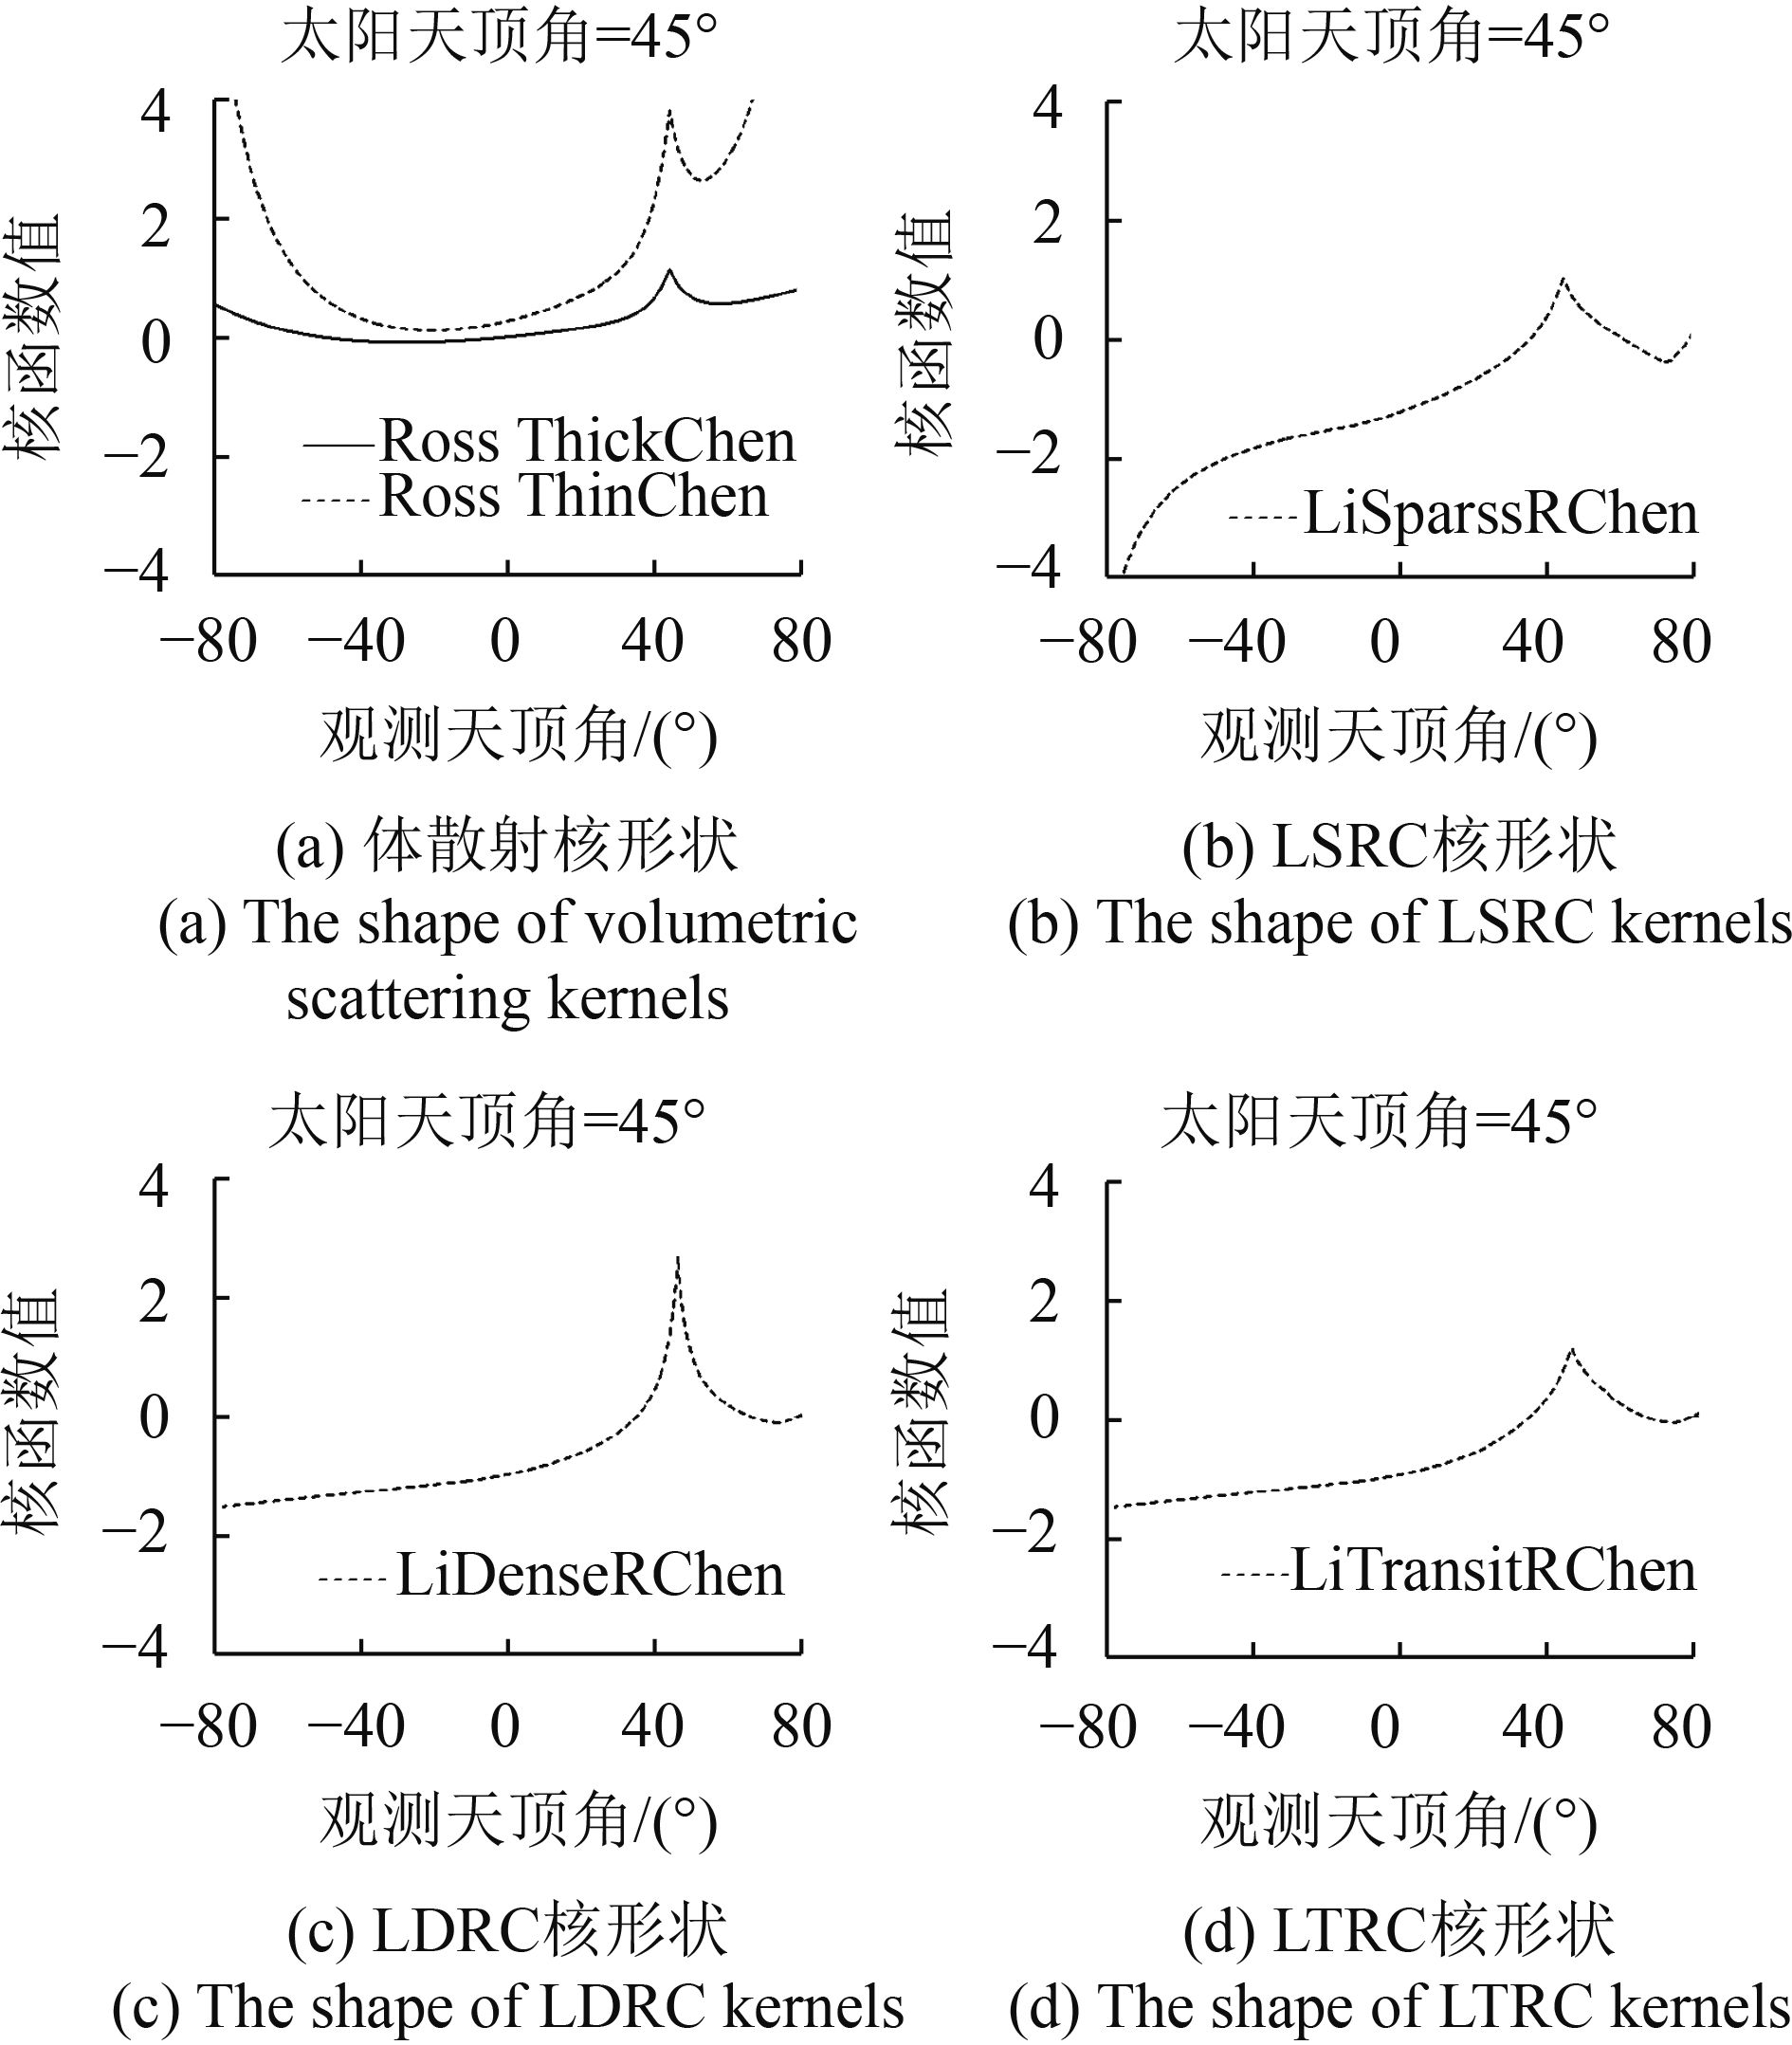
表 1 6种核组合模型
Table 1 Six kernel combined model
| BRDF模型 | LiSparseRC | LiDenseRC | LiTransitRC |
| RossThickChen | RTCLSRC | RTCLDRC | RTCLTRC |
| RossThinChen | RTNCLSRC | RTNCLDRC | RTNCLTRC |
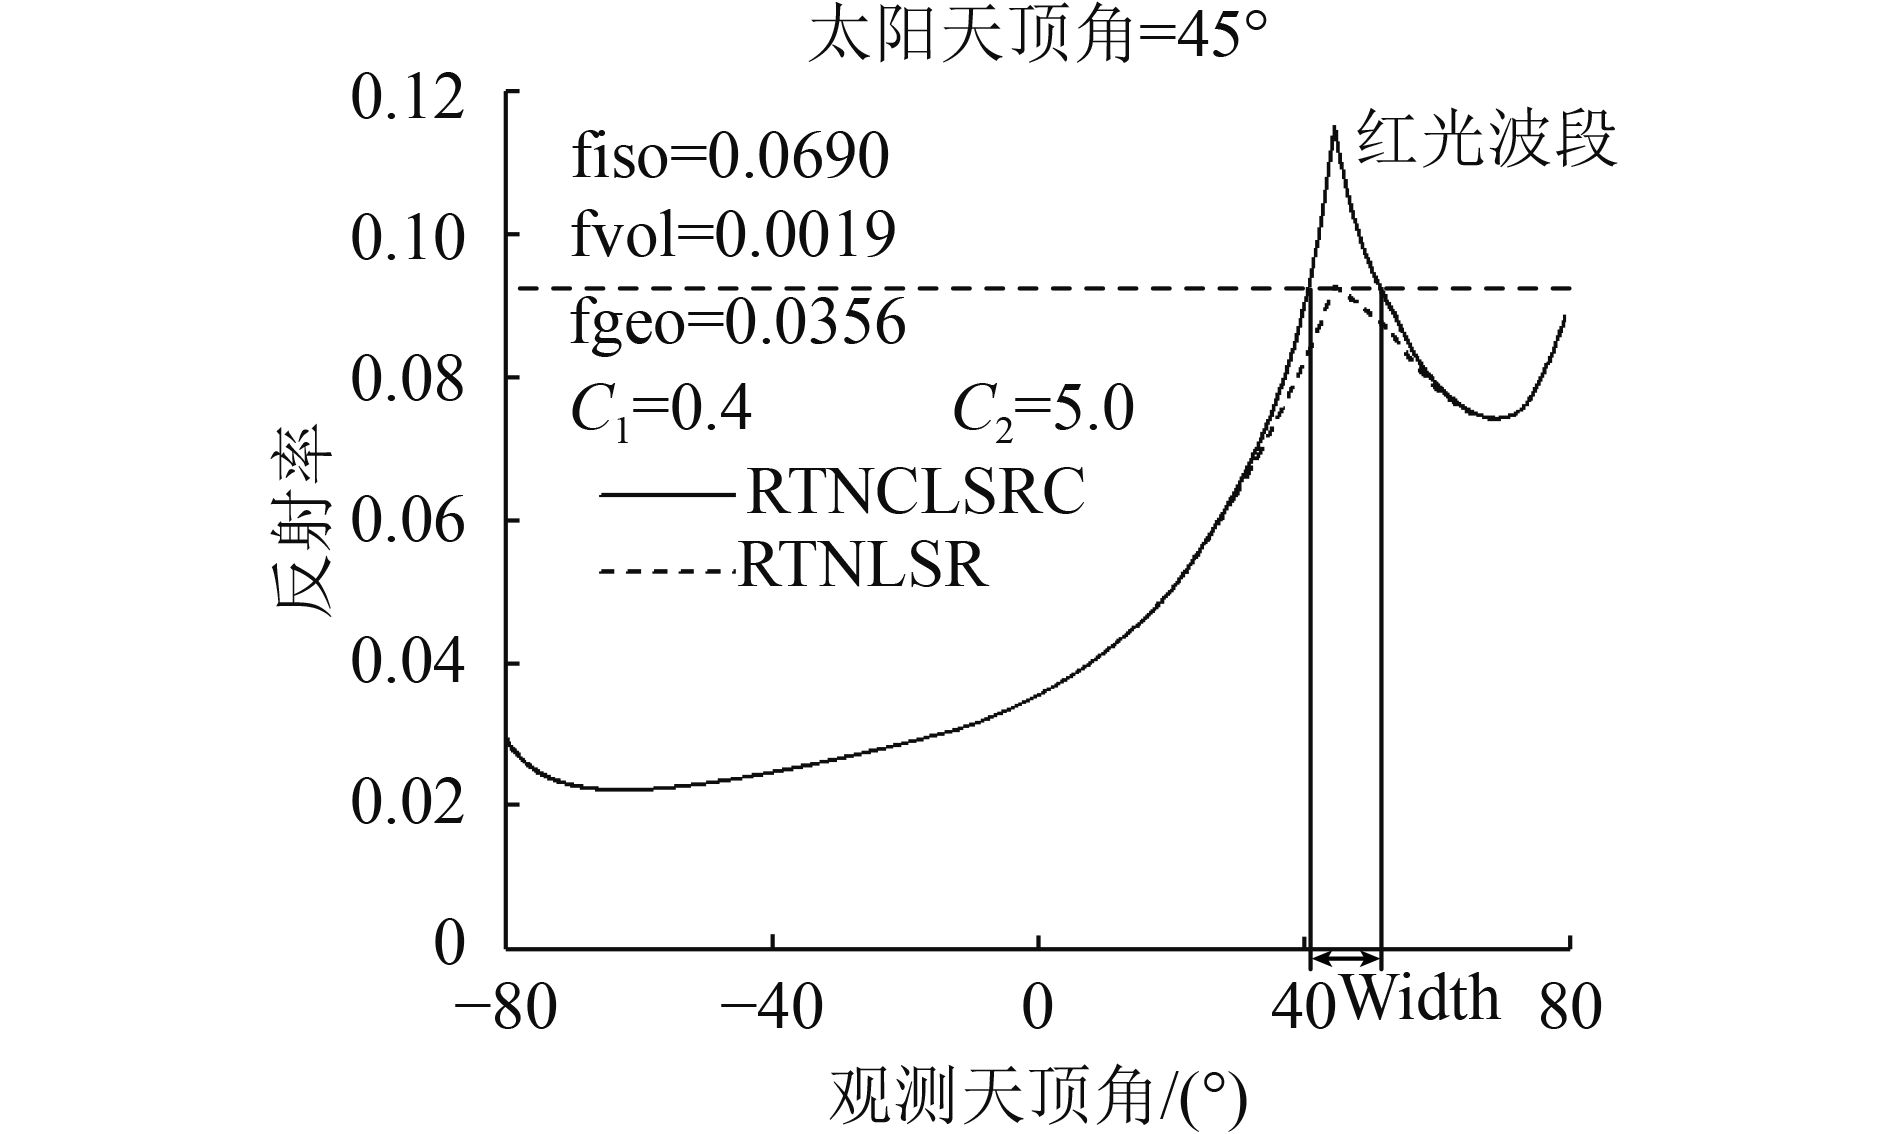
2.6 热点宽度
本研究为了定量分析热点宽度随热点参数的变化,对热点宽度进行定义。同一模型在不加入热点参数的情况下热点处(观测天顶角与太阳天顶角相同)的反射率值,对应该模型加入热点参数后该反射率对应的热点附近的两个观测天顶角之间的差值,定义为热点宽度,图3为热点宽度示意图。
3 结果与分析
3.1 不同核组合对典型数据的拟合结果与分析
为了验证以上6种核驱动模型是否可以通过改变热点参数的方式较好地拟合热点附近的观测,本文从POLDER数据库中挑选了一组典型的数据,通过改变热点参数,观察不同核组合的模型对该组数据的拟合效果。该组数据是中心波长670nm的红波段数据(IGBP_01_200609brdf_ndvi08.0824_1671),共183个观测角度,IGBP类型为常绿针叶林,该组数据的角度分布情况见图1。Jiao等(2016)使用该组数据对经过热点校正的RTCLSR模型的模拟情况进行了验证与比较,说明该数据对热点的观测相对充足,适用于热点的研究。
图4为不同核组合情况下,最优热点参数拟合的BRDF对典型POLDER数据在主平面上的拟合情况,从图中可以看出,校正前的模型显著低估了热点方向的反射率,校正后的模型对热点反射率的拟合精度有了显著提高,通过调整热点参数C1和C2的值,不同核的组合构成的模型均可以较好的模拟热点附近的反射率特征,说明本研究所采用的热点校正方式是有效的。
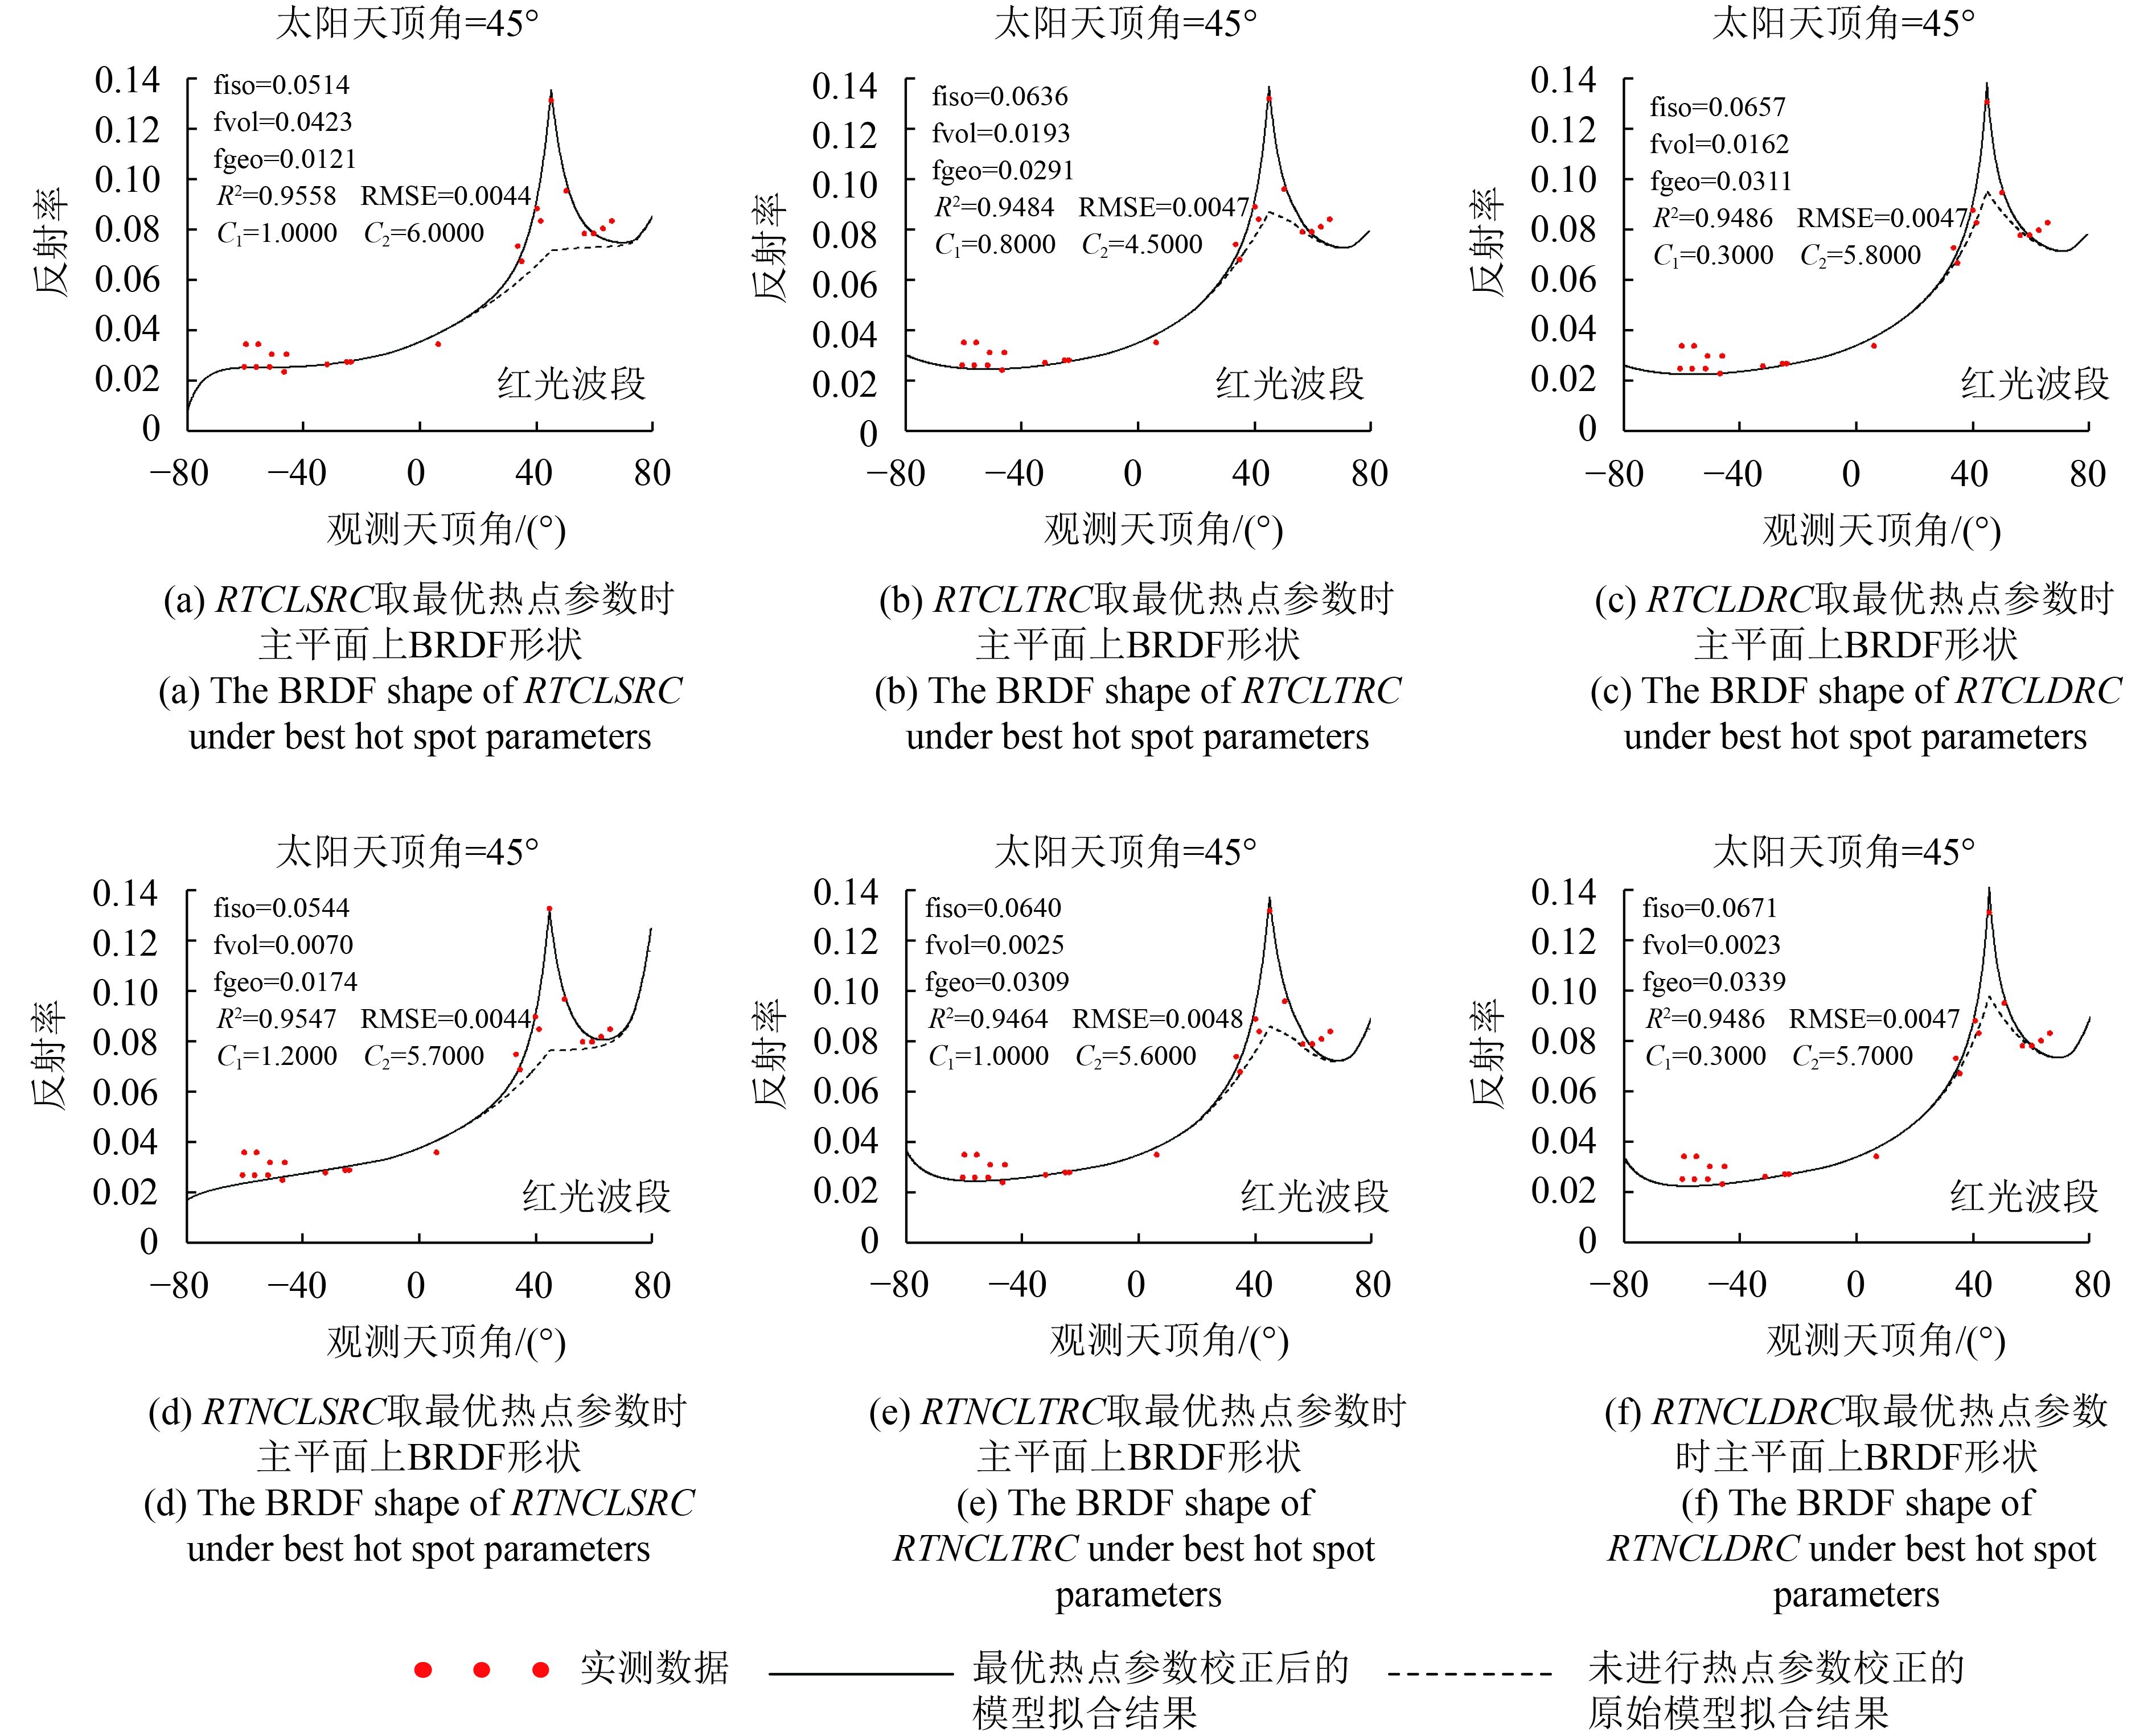
在6种模型中,由LSRC核函数构成的模型的拟合效果相对较好,可以恰当的描述热点高度,由LDRC核组成的两个模型略微高估了热点反射率,这是由于LDRC核自身较好特征化了热点的情况(图2),因此热点高度所需校正的量级相对较小,C1参数值在LDRC核函数组成的模型中最优取值远小于其他模型,也体现了这一特点。
研究结果表明,针对该组数据,不同模型均可通过调整热点参数较好地拟合反射率,特别是热点附近的反射率。RTCLSRC模型的拟合精度最好,特别是对热点附近的拟合,LDRC核组成的模型对热点处BRDF存在一定程度的高估。
3.2 热点参数敏感性分析
本研究通过固定一个热点参数,改变另一参数的方式,分析随着热点参数的变化,不同模型热点宽度与高度的变化情况,进一步分析不同模型对热点参数的敏感性,图5(a)表示C2的值固定为5.0时,随着C1的值在0.1—0.8范围变化,主平面上热点处(VZA=44.89°)的反射率与对应模型没有进行热点校正时反射率的差值的变化情况,本文将该值作为模型热点高度的量化表示。结果表明,几何光学核为LDRC的模型组合对热点高度变化最敏感,特别是在C1取值大于0.4后,热点高度增加随C1的增大而加快。其余4种模型组合的热点高度随着C1值的增大呈现线性增大趋势,RTCLSRC的敏感性略高于其他3种组合。这一特征的出现与各个核的形状相关,LDRC核的热点明显高于其他几何光学核,RTNC核的热点高于RTC核(图2)。图5(b)表示固定C1值为0.4时,热点宽度随C2取值的变化情况。在C2变化范围内,RTCLSRC模型对应的热点宽度最大,并呈现线性增大的趋势,RTNCLSRC变化趋势与之类似,但热点宽度较小且变化速度较慢,其原因是RTC核的热点宽度远大于RTNC核;RTCLDRC与RTNCLDRC模型的热点宽度次之,且热点宽度在C2值为1.0—2.5范围内迅速增大,在2.5—6.0范围内增大速度变慢;其余模型的热点宽度较小且随C2的变化较慢。

通过以上分析,可知在典型数据的六种模型组合中,RTCLDRC与RTNCLDRC对参数C1的变化最为敏感;在C2值为1.0—2.5范围内RTCLTRC与RTCLDRC对参数C2的变化最敏感,C2值大于2.5后,RTCLSRC模型的对C2变化最为敏感。
3.3 最优热点参数确定与精度分析
为研究热点参数在数据库全部数据各个波段中的变化特点,本文对全部POLDER数据按波段进行最优热点参数的确定(表2)。全部数据参数变化情况为:相同体散射核组合下,LDRC核的C1值最小,LSRC的C1值最大,这是由于LTRC核在热点处与LSRC核重合并且明显低于LDRC核,所以二者组成的模型的C1值较为接近,并且都大于LDRC核组成模型的C1值。RTC核的热点高度在相同的热点参数下低于RTNC核(图2),因此,在相同几何光学核分别和RTC核与RTNC核组成的模型中,RTC核组成的模型的C1值整体偏大。C2的值在不同核的组合模型中的变化无明显规律,这一特点在单组数据所表现的C2的特征中也有体现。所有模型的拟合误差(RMSE)均从第1波段向第6波段逐渐增大,拟合精度逐渐降低,RTCLSRC模型的拟合误差在所有模型中最小,说明该模型的拟合精度最高。
表 2 全部POLDER数据对6种核组合模型热点参数标定结果
Table 2 The best hotspot parameters calculated by all POLDER data for six kernel combination models
| 波段 | 1 | 2 | 3 | 4 | 5 | 6 | |
| 中心波长/nm | 490 | 565 | 670 | 765 | 865 | 1020 | |
| RTCLSRC | C1 | 0.4 | 0.5 | 0.5 | 0.4 | 0.5 | 0.4 |
| C2 (°) | 3.8 | 3.1 | 3.4 | 4.1 | 3.0 | 4.5 | |
| RMSE | 0.0065 | 0.0088 | 0.0091 | 0.0141 | 0.0151 | 0.0161 | |
| RTCLTRC | C1 | 0.3 | 0.4 | 0.5 | 0.4 | 0.4 | 0.4 |
| C2 (°) | 2.6 | 1.8 | 1.3 | 1.6 | 1.5 | 1.6 | |
| RMSE | 0.0072 | 0.0084 | 0.0100 | 0.0157 | 0.0170 | 0.0181 | |
| RTCLDRC | C1 | 0.2 | 0.2 | 0.2 | 0.2 | 0.2 | 0.2 |
| C2 (°) | 2.0 | 1.5 | 1.2 | 1.3 | 1.2 | 1.3 | |
| RMSE | 0.0075 | 0.0086 | 0.0103 | 0.0153 | 0.0163 | 0.0177 | |
| RTNCLSRC | C1 | 0.6 | 0.6 | 0.7 | 0.6 | 0.6 | 0.6 |
| C2 (°) | 2.9 | 3.2 | 2.8 | 3.0 | 3.1 | 3.3 | |
| RMSE | 0.0069 | 0.0080 | 0.0096 | 0.0152 | 0.0163 | 0.0172 | |
| RTNCLTRC | C1 | 0.5 | 0.5 | 0.6 | 0.5 | 0.5 | 0.5 |
| C2 (°) | 1.1 | 1.1 | 1.0 | 1.0 | 1.0 | 1.1 | |
| RMSE | 0.0073 | 0.0084 | 0.0102 | 0.0155 | 0.0168 | 0.0181 | |
| RTNCLDRC | C1 | 0.2 | 0.2 | 0.2 | 0.2 | 0.2 | 0.2 |
| C2 (°) | 1.0 | 1.0 | 1.0 | 1.0 | 1.0 | 1.0 | |
| RMSE | 0.0071 | 0.0083 | 0.0101 | 0.0152 | 0.0163 | 0.0172 | |
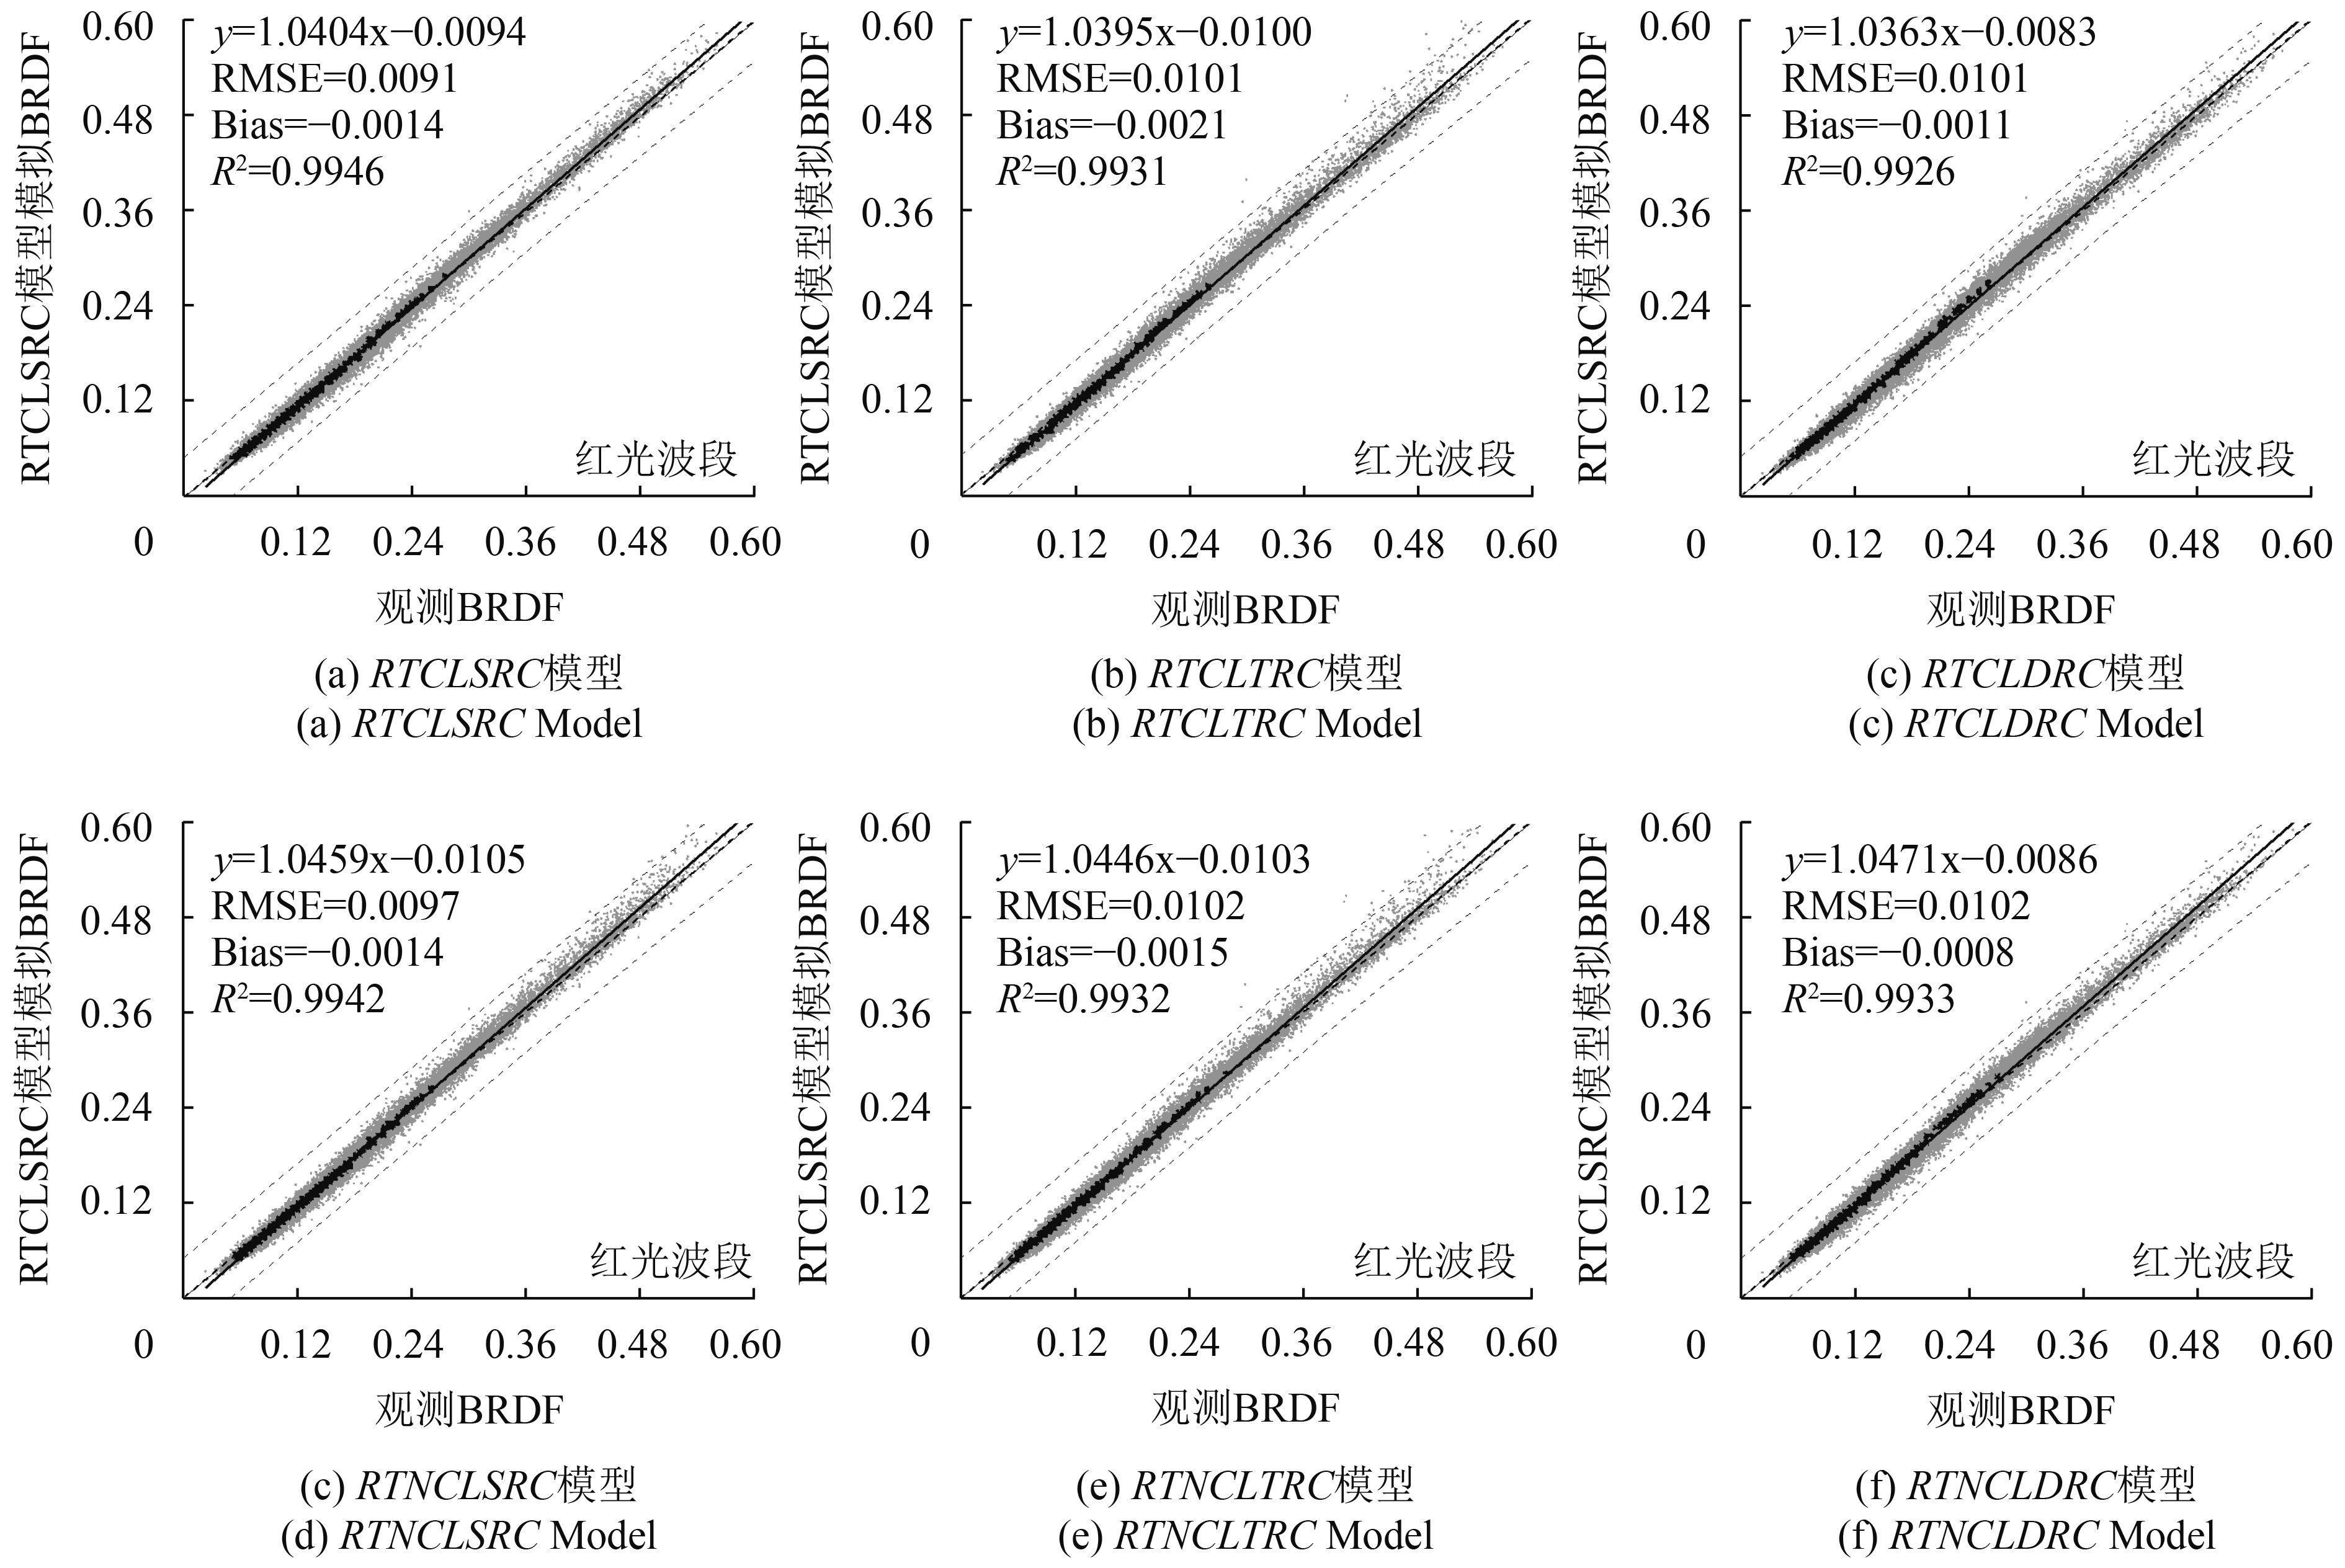
图6为红光波段POLDER热点观测反射率与6种模型拟合结果之间的密度散点图,图中深色点为在对应位置出现频率较高的数据,其中热点数据采用相角小于5°范围内的数据。除了RTNCLDRC模型以外,其余5种模型模拟值均略微低估了实际观测值(Bias < 0),但是Bias值较小,所以这种低估或高估基本可以忽略不计。从整体结果分析,热点校正后的模型的拟合效果整体较好,R2均大于0.99。对比6种模型可知,RTCLSRC模型的拟合精度最高,RMSE最小,RTNCLSRC模型精度次之,RTCLDRC模型拟合精度最低。这一结果与典型数据的结果基本一致,因此我们得出结论,在经过热点校正后的核组成的模型中,RTCLSRC模型对热点的拟合效果最好,几何光学核为LDRC的模型对热点数据存在一定程度上的高估。
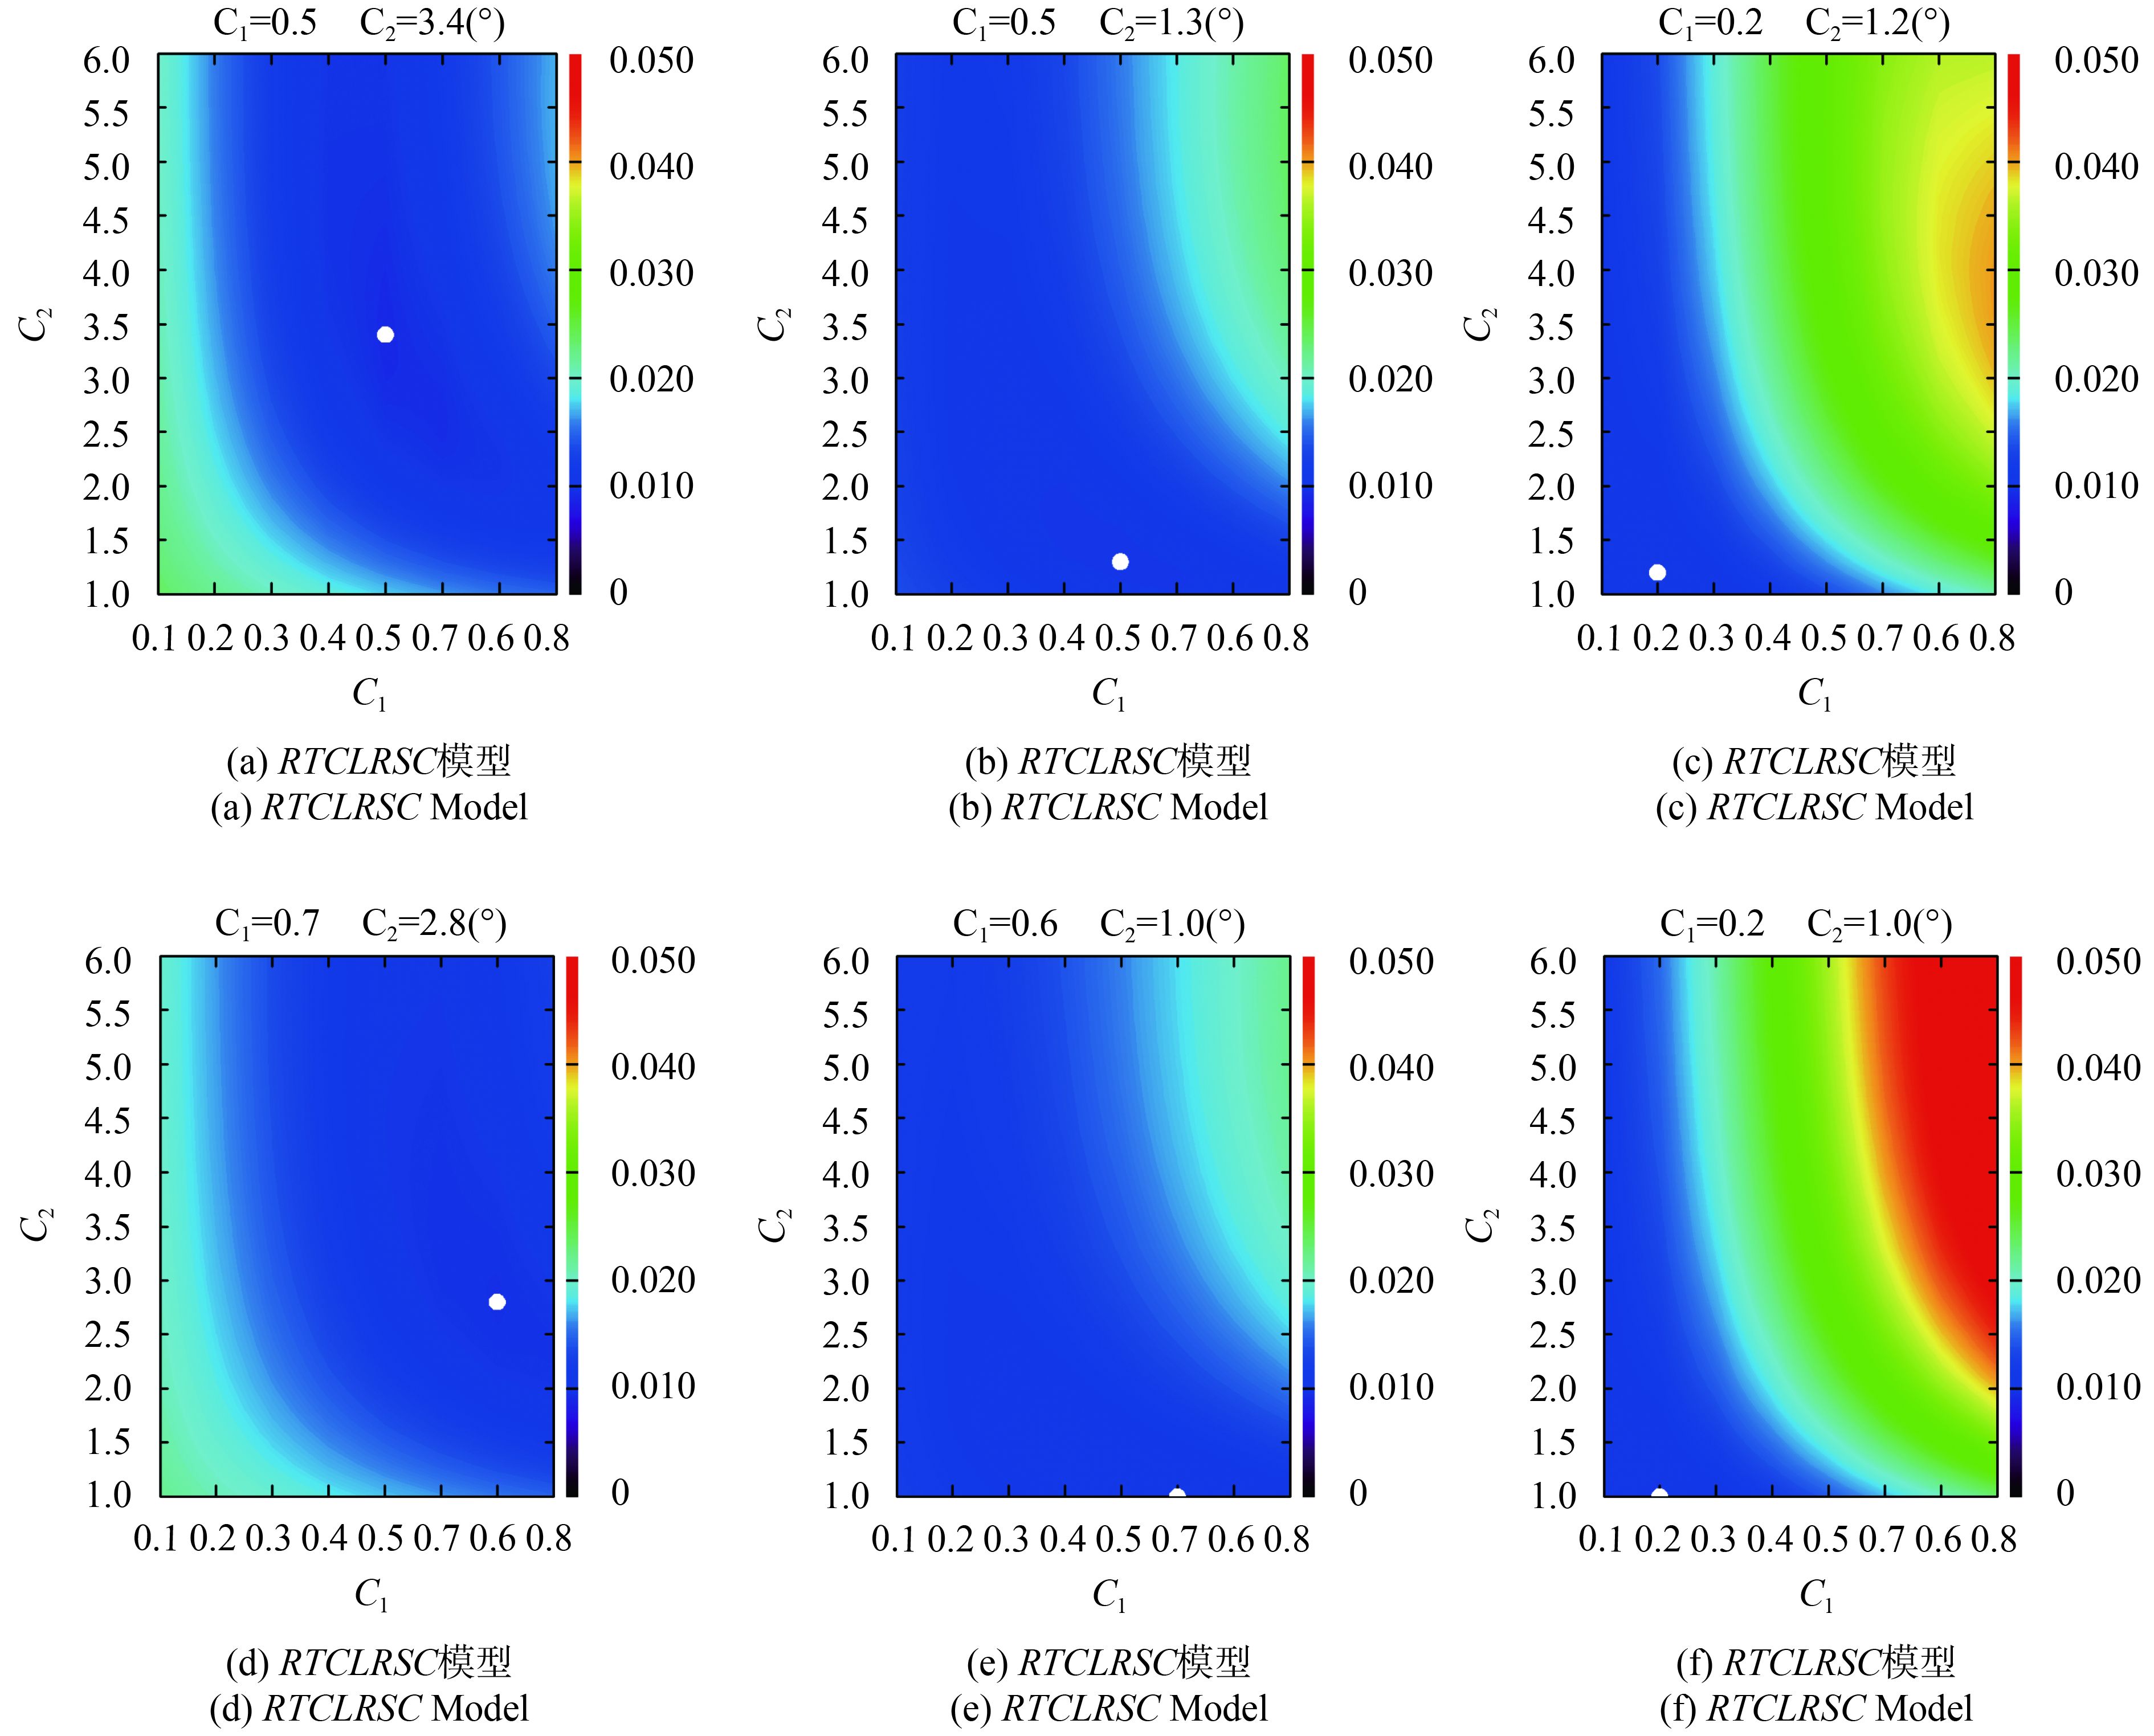
由于控制热点高度与宽度的参数C1与C2并不是两个完全独立的变量,因此单独研究两个变量与热点的关系可能不能完整表述参数与敏感性特征的关系,但RMSE是衡量热点拟合情况的重要标准,因此为验证热点拟合结果对热点参数的敏感性。本研究将拟合结果(RMSEs)作为因变量,将参数C1与C2作为自变量,制作了全部数据红光波段的二维等值线轮廓(Contour)图(图7)。图中白色的点代表最小拟合RMSE对应的最优C1与C2的值。第一行体散射核为RTC核,第二行为RTNC核;左边一列几何光学核为LSRC核,中间一列为LTRC核,右边一列为LDRC核。结果表明,RTNCLDRC模型拟合精度对热点参数最敏感,RTCLDRC模型次之,这一结果与单组数据的敏感性分析结果一致。其余4个模型的拟合精度对参数敏感性较低,拟合误差RMSE随参数C1与C2的变化范围较小,对于几何光学核为LSRC核的模型组合,拟合误差RMSE随着C1与C2的增大,呈现出先减小后增大的趋势,并且在确定的C2值下,RMSE的值对C1呈现对称的趋势。对于几何光学核为LTRC的模型组合,拟合误差RMSE随着C1与C2的增大,呈现增大的趋势。对所有模型,对给定的C1的值,RMSE随C2的变化范围较小,并且随着C2的增加,RMSE的值趋向稳定,对给定C2的值,RMSE随C1的变化范围更广,说明参数C1对热点变化更为敏感。图中白色圆点代表最小拟合误差出现时对应的最优的C1与C2的值。
4 结 论
本文参照RTC核与LSRC核的热点校正方法,对RTN核与LTR核和LDR核分别进行了热点校正,并对热点校正后的核进行组合,形成6种模型,综合分析了Ross-Li模型热点校正情况。首先将各组模型应用到典型数据中,验证了改进后的模型对热点的拟合能力,并分析了不同模型对热点参数的敏感性;又以POLDER多角度观测数据作为实测数据确定各个模型的最优热点参数。最优热点参数表明,所有模型组合均可通过调整热点参数的值实现对热点反射率的准确拟合。但是由于LDRC核自身对热点的表征,热点参数在该核函数组成的模型中的作用相对其他核函数较小,因此在后续应用中,需要注意C1值在LDRC核中的取值。LTRC核与LSRC核的核形状并不完全重合,其原因与太阳角度的变化有关。
由于单组数据在热点处的观测较少,因此单组数据的热点参数敏感性采用热点处的高度与宽度表征更为直观;对于全部数据集,则采用热点处RMSE随热点参数的变化表示热点参数的敏感性,因为参数C1与C2对热点的影响并不独立,可以进一步研究热点参数之间的关系。
本文通过对Ross-Li模型进行统一的热点校正,为进一步推广核驱动模型的应用,尤其是为关注热点效应的用户提供了方便,同时,也为Ross-Li模型今后用于具有自主知识产权的国产多角度卫星中,尤其为准确重构多角度数据的热点信号提供了重要的方法和参考依据。
参考文献(References)
-
Bréon F M. 2005. Parasol Level-1 product data format and user manual. Paris: CNES: 2-8
-
Bréon F M and Maignan F. 2017. A BRDF–BPDF database for the analysis of earth target reflectances. Earth System Science Data, 9 (1): 31–45. [DOI: 10.5194/essd-9-31-2017]
-
Bréon F M, Maignan F, Leroy M and Grant I. 2002. Analysis of hot spot directional signatures measured from space. Journal of Geophysical Research: Atmospheres, 107 (D16): AAC 1-1–AAC 1-15. [DOI: 10.1029/2001JD001094]
-
Canisius F and Chen J M. 2007. Retrieving forest background reflectance in a boreal region from multi-angle imaging spectroradiometer (MISR) data. Remote Sensing of Environment, 107 (1/2): 312–321. [DOI: 10.1016/j.rse.2006.07.023]
-
Chen J M and Cihlar J. 1997. A hotspot function in a simple bidirectional reflectance model for satellite applications. Journal of Geophysical Research: Atmospheres, 102 (D22): 25907–25913. [DOI: 10.1029/97JD02010]
-
Chen J M, Menges C H and Leblanc S G. 2005. Global mapping of foliage clumping index using multi-angular satellite data. Remote Sensing of Environment, 97 (4): 447–457. [DOI: 10.1016/j.rse.2005.05.003]
-
Deschamps P Y, Breon F M, Leroy M, Podaire A, Bricaud A, Buriez J C and Seze G. 1994. The polder mission: instrument characteristics and scientific objectives. IEEE Transactions on Geoscience and Remote Sensing, 32 (3): 598–615. [DOI: 10.1109/36.297978]
-
Dong Y D, Jiao Z T, Yin S Y, Zhang H, Zhang X M, Cui L, He D D, Ding A X, Chang Y X and Yang S T. 2018. Influence of snow on the magnitude and seasonal variation of the clumping index retrieved from MODIS BRDF products. Remote Sensing, 10 (8): 1194 [DOI: 10.3390/rs10081194]
-
Dong Y D, Jiao Z T, Zhang H, Bai D N, Zhang X N, Li Y and He D D. 2016. A visualization tool for the kernel-driven model with improved ability in data analysis and kernel assessment. Computers and Geosciences, 95 : 1–10. [DOI: 10.1016/j.cageo.2016.06.010]
-
Dong Y D, Jiao Z T, Zhang H, Li J Y, Jiao G P and Shi H Y. 2014. Efficient algorithm for improving the hotspot effect of the operational MODIS BRDF product. Journal of Remote Sensing, 18 (4): 804–825. [DOI: 10.11834/jrs.20143229] ( 董亚冬, 焦子锑, 张虎, 李佳悦, 焦广平, 石涵予. 2014. 改善MODIS BRDF产品热点效应的方法研究. 遥感学报, 18 (4): 804–825. [DOI: 10.11834/jrs.20143229] )
-
He L M, Chen J M, Pisek J, Schaaf C B and Strahler A H. 2012. Global clumping index map derived from the MODIS BRDF product. Remote Sensing of Environment, 119 : 118–130. [DOI: 10.1016/j.rse.2011.12.008]
-
Hill M J, Román M O, Schaaf C B, Hutley L, Brannstrom C, Etter A and Hanan N P. 2011. Characterizing vegetation cover in global savannas with an annual foliage clumping index derived from the MODIS BRDF product. Remote Sensing of Environment, 115 (8): 2008–2024. [DOI: 10.1016/j.rse.2011.04.003]
-
Huang X Y, Jiao Z T, Dong Y D, Zhang H and Li X W. 2013. Analysis of BRDF and albedo retrieved by kernel-driven models using field measurements. IEEE Journal of Selected Topics in Applied Earth Observations and Remote Sensing, 6 (1): 149–161. [DOI: 10.1109/JSTARS.2012.2208264]
-
Jiao Z T and Dong Y D. 2018. A method to enhance the geometric-optical kernel for further improving hotspot effect in MODIS BRDF model//Proceedings of the 2018 IEEE International Geoscience and Remote Sensing Symposium. Valencia, Spain: IEEE: 1715-1718 [DOI: 10.1109/IGARSS.2018.8517916]
-
Jiao Z T, Dong Y D, Schaaf C B, Chen J M, Román M, Wang Z S, Zhang H, Ding A X, Erb A, Hill M J, Zhang X N and Strahler A. 2018. An algorithm for the retrieval of the clumping index (CI) from the MODIS BRDF product using an adjusted version of the kernel-driven BRDF model. Remote Sensing of Environment, 209 : 594–611. [DOI: 10.1016/j.rse.2018.02.041]
-
Jiao Z T, Schaaf C B, Dong Y D, Román M, Hill M J, Chen J M, Wang Z S, Zhang H, Saenz E, Poudyal R, Gatebe C, Bréon F M, Li X W and Strahler A. 2016. A method for improving hotspot directional signatures in BRDF models used for MODIS. Remote Sensing of Environment, 186 : 135–151. [DOI: 10.1016/j.rse.2016.08.007]
-
Jiao Z T, Li X W, Wang J D and Zhang H. 2011. Assessment of MODIS BRDF shape indicators. Journal of Remote Sensing, 15 (3): 432–456. [DOI: 10.11834/jrs.20110073] ( 焦子锑, 李小文, 王锦地, 张虎. 2011. 评估MODIS的BRDF角度指数产品. 遥感学报, 15 (3): 432–456. [DOI: 10.11834/jrs.20110073] )
-
Jupp D L B and Strahler A H. 1991. A hotspot model for leaf canopies. Remote Sensing of Environment, 38 (3): 193–210. [DOI: 10.1016/0034-4257(91)90089-O]
-
Lacaze R, Chen J M, Roujean J L and Leblanc S G. 2002. Retrieval of vegetation clumping index using hot spot signatures measured by polder instrument. Remote Sensing of Environment, 79 (1): 84–95. [DOI: 10.1016/S0034-4257(01)00241-3]
-
Leblanc S G, Chen J M, White H P, Latifovic R, Lacaze R and Roujean J L. 2005. Canada-wide foliage clumping index mapping from multiangular polder measurements. Canadian Journal of Remote Sensing, 31 (5): 364–376. [DOI: 10.5589/m05-020]
-
Li X and Strahler A H. 1992. Geometric-optical bidirectional reflectance modeling of the discrete crown vegetation canopy: effect of crown shape and mutual shadowing. IEEE Transactions on Geoscience and Remote Sensing, 30 (2): 276–292. [DOI: 10.1109/36.134078]
-
Li X W, Gao F, Chen L Z and Strahler A H. 1999. Derivation and validation of a new kernel for kernel-driven BRDF models//Proceedings Volume 3868, Remote Sensing for Earth Science, Ocean, and Sea Ice Applications. Florence, Italy: SPIE: 368-380 [DOI: 10.1117/12.373123]
-
Lucht W and Lewis P. 2000. Theoretical noise sensitivity of BRDF and albedo retrieval from the EOS-MODIS and MISR sensors with respect to angular sampling. International Journal of Remote Sensing, 21 (1): 81–98. [DOI: 10.1080/014311600211000]
-
Lucht W, Schaaf C B and Strahler A H. 2000. An algorithm for the retrieval of albedo from space using semiempirical BRDF models. IEEE Transactions on Geoscience and Remote Sensing, 38 (2): 977–998. [DOI: 10.1109/36.841980]
-
Maignan F, Bréon F M and Lacaze R. 2004. Bidirectional reflectance of earth targets: evaluation of analytical models using a large set of spaceborne measurements with emphasis on the hot spot. Remote Sensing of Environment, 90 (2): 210–220. [DOI: 10.1016/j.rse.2003.12.006]
-
Mõttus M, Sulev M and Lang M. 2006. Estimation of crown volume for a geometric radiation model from detailed measurements of tree structure. Ecological Modelling, 198 (3/4): 506–514. [DOI: 10.1016/j.ecolmodel.2006.05.033]
-
Nicodemus F E, Richmond J C, Hsia J J, Ginsberg I W and Limperis T. 1977. Geometrical considerations and nomenclature for reflectance. NBS Monograph 160, Washington D.C.
-
Pisek J, Chen J M, Lacaze R, Sonnentag O and Alikas K. 2010. Expanding global mapping of the foliage clumping index with multi-angular polder three measurements: evaluation and topographic compensation. ISPRS Journal of Photogrammetry and Remote Sensing, 65 (4): 341–346. [DOI: 10.1016/j.isprsjprs.2010.03.002]
-
Pisek J, Chen J M and Nilson T. 2011a. Estimation of vegetation clumping index using MODIS BRDF data. International Journal of Remote Sensing, 32 (9): 2645–2657. [DOI: 10.1080/01431161.2010.507611]
-
Pisek J, Lang M, Nilson T, Korhonen L and Karu H. 2011b. Comparison of methods for measuring gap size distribution and canopy nonrandomness at Jörvselja RAMI (radiation transfer model intercomparison) test sites. Agricultural and Forest Meteorology, 151 (3): 365–377. [DOI: 10.1016/j.agrformet.2010.11.009]
-
Pisek J, Ryu Y, Sprintsin M, He L M, Oliphant A J, Korhonen L, Kuusk J, Kuusk A, Bergstrom R, Verrelst J and Alikas K. 2013. Retrieving vegetation clumping index from multi-angle imaging spectroradiometer (MISR) data at 275 m resolution. Remote Sensing of Environment, 138 : 126–133. [DOI: 10.1016/j.rse.2013.07.014]
-
Roujean J L, Leroy M and Deschamps P Y. 1992. A bidirectional reflectance model of the earth’s surface for the correction of remote sensing data. Journal of Geophysical Research: Atmospheres, 97 (D18): 20455–20468. [DOI: 10.1029/92JD01411]
-
Schaaf C B, Gao F, Strahler A H, Lucht W, Li X W, Tsang T, Strugnell N C, Zhang X Y, Jin Y F, Muller J P, Lewis P, Barnsley M, Hobson P, Disney M, Roberts G, Dunderdale M, Doll C, D’Entremont R P, Hu B X, Liang S L, Privette J L and Roy D. 2002. First operational BRDF, albedo nadir reflectance products from MODIS. Remote Sensing of Environment, 83 (1/2): 135–148. [DOI: 10.1016/S0034-4257(02)00091-3]
-
Schlerf M and Atzberger C. 2006. Inversion of a forest reflectance model to estimate structural canopy variables from hyperspectral remote sensing data. Remote Sensing of Environment, 100 (3): 281–294. [DOI: 10.1016/j.rse.2005.10.006]
-
Wanner W, Li X and Strahler A H. 1995. On the derivation of kernels for kernel-driven models of bidirectional reflectance. Journal of Geophysical Research: Atmospheres, 100 (D10): 21077–21089. [DOI: 10.1029/95JD02371]
-
Wanner W, Strahler A H, Hu B, Lewis P, Muller J P, Li X, Schaaf C L B and Barnsley M J. 1997. Global retrieval of bidirectional reflectance and albedo over land from EOS MODIS and MISR data: theory and algorithm. Journal of Geophysical Research: Atmospheres, 102 (D14): 17143–17161. [DOI: 10.1029/96JD03295]
-
Wei S S and Fang H L. 2016. Estimation of canopy clumping index from MISR and MODIS sensors using the normalized difference hotspot and darkspot (NDHD) method: the influence of BRDF models and solar zenith angle. Remote Sensing of Environment, 187 : 476–491. [DOI: 10.1016/j.rse.2016.10.039]
-
Zhu G L, Ju W M, Chen J M, Gong P, Xing B L and Zhu J F. 2012. Foliage clumping index over China’s landmass retrieved from the MODIS BRDF parameters product. IEEE Transactions on Geoscience and Remote Sensing, 50 (6): 2122–2137. [DOI: 10.1109/TGRS.2011.2172213]