|
|

|
收稿日期: 2015-05-04; 修订日期: 2015-10-14;
优先数字出版日期: 2015-10-21
基金项目: 国家自然科学基金(编号: 41205013)
第一作者简介: 朱恩泽(1991-), 男, 硕士研究生, 研究方向为卫星遥感反演及应用。E-mail: zezqy@outlook.com
通信作者简介: 张雷(1988— ), 男, 博士研究生, 研究方向为微波遥感资料反演及应用。E-mail: zlei_best@126.com
中图分类号: P731.11
文献标识码: A
文章编号: 1007-4619(2016)02-0315-13
|
摘要
利用美国国家浮标数据中心NDBC和热带大气海洋计划TAO浮标的海表面温度数据,对WindSat 2004年-2013年近10年的海表面温度产品进行了验证。结果表明,在美国沿岸海域,WindSat反演得到的海表面温度的平均偏差为0.10 ℃,标准偏差为0.59 ℃;在近赤道太平洋海域,反演得到的海表面温度的平均偏差为–0.15 ℃,标准偏差为0.33 ℃。WindSat海表面温度在夏季相对浮标实测值有正偏差增大和负偏差缩小的趋势,在美国东海岸以及墨西哥湾区域部分站点反演得到的海表面温度的标准偏差较大,其标准偏差超过1 ℃。在5–10 m/s风速段,WindSat 海表面温度反演效果比较理想,平均偏差和标准偏差相对恒定。当风速大于12 m/s时,WindSat 海表面温度反演的不确定性明显增加。与AMSR-E月平均海表面温度产品对比发现,夏季,WindSat SST较 AMSR-E偏低;冬季,WindSat SST较 AMSR-E偏高。
关键词
海表面温度, WindSat, NDBC浮标, TAO浮标, AMSR-E
Abstract
Sea Surface Temperature (SST) is one of the important parameters of hydrodynamic and oceanographic research. It has been widely utilized in the study of climate change, weather forecasting, numerical weather prediction(NWP), atmospheric and oceanographic applications, fisheries, and other sciences. This study comparesSST derived from WindSat to those directly observed by NDBC/TAO buoy and SST provided by AMSR-E. In the collocation of WindSat and buoy data, an SST value with a rain rate larger than zero was rejected. Collocation adopted a ±30 min time constraint and 25 km maximum separation. A total of 82,247 WindSat-NDBC collocations and 366,693 WindSat-TAO collocations were acquired. Rsults show that WindSat SST has a mean bias of 0.10 ℃ and standard deviation of 0.59 ℃ in the coastal and offshore waters of the United States. In the tropical Pacific Ocean, WindSat SST has a mean bias of –0.15 ℃ and standard deviation of 0.33 ℃. In addition, WindSat SST has an increasing warm bias or a decreasing cool bias in summer. The standard deviations of the satellite-derived SST are both relatively large in the US East Coast and in the Gulf of Mexico; the standard deviations of certain regions are higher than 1 ℃. When the buoy wind speed ranges from 5 m/s to 10 m/s, the accuracy of WindSat SST is good, and the mean bias and standard deviation are relatively constant. When the buoy wind speed exceeds 12m/s, the uncertainty of WindSat SST increases. Global comparison with AMSR-E shows that WindSat monthly averaged SST is cooler than that of AMSR-Ein summer and warmer in winter. Even though it has operated beyond its designed life of seven years, WindSat SST continues to exhibit acceptable accuracy. WindSat retrieves SST better in tropical Pacific and worse in US coasts and in the Gulf of Mexico. The part of wind direction correction in retrieval algorithms needs to be improved to increase the accuracy of SST retrieval under conditions of high wind speed.
Key words
sea surface temperature, WindSat, NDBC buoy, TAO buoy, AMSR-E
1 引 言
海表面温度SST(Sea Surface Temperature)是大气和海洋学研究中的重要参数之一,其影响着海气之间的热量、动量和水汽交换过程(Curry等,2004)。海表面温度是构建天气和气候预测模型的外强迫项,其对于气候变化的研究有着重要意义(Sutton和Hodson,2003)。传统的SST测量手段主要包括岸基观测、船舶观测和海上浮标监测等,这些测量方式可以直接地获得实时测量数据,然而受观测成本以及复杂天气状况等因素的影响,传统的观测手段在空间分布连续性以及时间同步上都受到了一定的限制,它们无法获得大面积或全球范围内的海表面温度。随着卫星遥感技术的发展,使获取全球范围内的海表面温度成为了可能。卫星测量SST的手段主要包括红外遥感和微波遥感。对于红外遥感来说,SST的提取主要是基于分裂窗技术(Pichel等,2001)。相对于微波遥感手段而言,红外遥感SST具有较高的空间分辨率,但是其易受大气状况尤其是云层遮挡的影响,影响着SST反演的精度或造成SST反演的空白;微波遥感SST可以提供全天候条件下的测量,能在一定程度上克服云等因素的影响(姜景山,1999),然而其观测的空间分辨率较低,且易受到海表面粗糙度和降水等因素的影响(李明等,2010)。目前在轨的能够提供海表面温度测量的典型的微波辐射计主要有TRMM上搭载的TMI、Coriolis上搭载的WindSat及GCOM-W1卫星上搭载的AMSR-2。
国内外学者对星载海表面温度产品的验证已开展了相关工作。Stammer等人(2003)基于RS(Reynolds and Smith)数据对TMI SST数据进行验证,得出在±38° W范围内,平均偏差为0.18 ℃,标准偏差为0.54 ℃。Gentemann等人(2004)基于4年的TAO/TRITON浮标数据对TMI SST数据进行验证,得出TMI SST的平均偏差为-;0.07 ℃,标准偏差为0.57 ℃。Chelton和Wentz(2005)基于TMI SST数据对AMSR-E SST数据进行验证,得出平均偏差为0.06 ℃,标准偏差为0.56 ℃。李明等人(2010)基于SVP(Surface Velolity Program)漂流浮标数据对AMSR-E在30°S以南的南大洋海域SST数据进行评估,发现AMSR-E SST比浮标数据偏低,夏季偏差为0.004 ℃,标准偏差为0.64 ℃,冬季偏差为-;0.06 ℃,标准偏差为0.75 ℃。Kachi等人(2013,2014)基于GTS(Global Telecommunica System)浮标SST数据对AMSR-2 SST数据进行验证,得出均方根误差为0.56 ℃。Meissner和Wentz(2007)基于RS OI(Reynolds and Smith Optimum Interpolated)数据对2003年至2006年的WindSat SST数据进行验证,得到平均偏差为-;0.11 ℃,标准偏差为0.66 ℃。目前,WindSat传感器已经在轨运行12年(Gaiser等,2004),作为全球第一颗星载全极化微波辐射计,有必要及时更新、全面探讨WindSat海表面温度产品的反演精度。基于此,本文利用NDBC和TAO浮标数据、以及AMSR-E月平均海表面温度产品,对WindSat 2004年-2013年的SST产品进行了验证分析。
2 数据及方法
2.1 WindSat海表温度产品
WindSat是全球第一颗星载全极化微波辐射计,由美国国家海军研究实验室和海军空间技术中心共同研制。它于2003年1月搭载在Coriolis卫星上发射升空,目前仍在轨运行。它采用圆锥式扫描方式,工作在高度约为830 km的太阳同步轨道,使用11个双极化喇叭馈源,可以提供16个“通道”的亮温信息。其中,SST反演利用了6.8 GHz 、10.7 GHz 、18.7 GHz 、23.8 GHz 以及37.0 GHz的水平和垂直极化通道共计10个通道的亮温信息。本文使用的WindSat SST数据,是由RSS(Remote Sensing System)处理发布的第7版(v7)数据,时间为2004年1月1日至2013年12月31日,空间分辨率为0.25 km × 0.25 km。其反演算法继承于AMSR-E的海表面温度反演方法,即多元线性回归算法(Meissner和Wentz,2005,2007)。
2.2 浮标观测数据
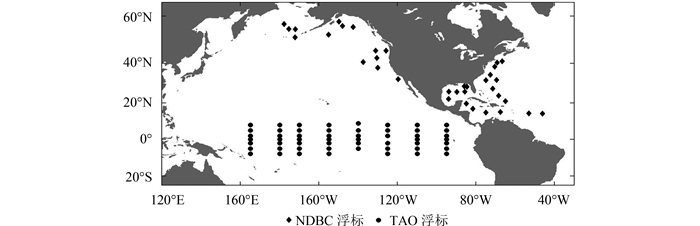
SST实际观测数据选用美国国家浮标数据中心NDBC(National Data Bouy Center)提供的NDBC和热带大气海洋计划TAO浮标数据。相关学者基于这两种浮标数据对海表面温度的验证开展了大量工作(Gentemann等,2004;Castro等,2012;Lean和Saunders,2013)。NDBC浮标主要分布在美国东西海岸沿岸、墨西哥湾、夏威夷群岛周边、秘鲁沿岸以及马歇尔群岛附近,测量海面以下1.0 m或1.5 m深的海水温度。TAO浮标是由太平洋海岸环境实验室PMEL(Pacific Marine Environmental Laboratory)建立的热带大气海洋计划(Tropical Atmosphere- Ocean)锚定浮标阵列,主要分布在近赤道太平洋(McPhaden,1995),测量海面下1 m深水温(Mangum等,1994)。
NDBC浮标传感器测温精度为0.08 ℃(http://www.ndbc.noaa.gov/NDBCH and bookof AutomatedDataQualityControl2009.pdf),时间分辨率为1 h;TAO浮标数据的时间分辨率为10 min,数据精度介于0.01-0.02 ℃(http://tao.ndbc.noaa.gov/proj_overview/sensors_ndbc.shtml)。本文所选NDBC浮标离岸距离均大于100 km,共35个站点,TAO浮标分布在近赤道太平洋,共54个站点。图 1 是浮标站点位置分布。

2.3 AMSR-E数据
考虑到浮标空间分布的局限性,本文基于AMSR-E的海表面温度产品,对WindSat海表面温度数据进行了全球范围的比较。AMSR-E(Advanced Microwave Scanning Radiometer for the Earth Observing System)传感器是搭载在美国Aqua卫星(2002年5月发射)上的微波扫描辐射计,它是一个双极化、圆锥扫描方式的被动微波传感器,拥有6.9 GHz和10.7 GHz两个低频频道。AMSR-E SST数据来源于RSS处理发布的第7版(v7)数据,选取2004年至2011年间1月和7月的AMSR-E SST月平均数据。其空间分辨率为0.25 km × 0.25 km。
2.4 质量控制与匹配方法
首先进行数据质量控制:剔除无效反演值;为避免降水影响,剔除了WindSat数据中Rain Rate(降水量)不为0的SST数据。匹配的空间和时间窗口分别限定在25 km和30 min之内,共计得到82247组WindSat-NDBC的匹配数据对和366693组WindSat-TAO的匹配数据对。
3 10年整体比较
3.1 与浮标数据的比较
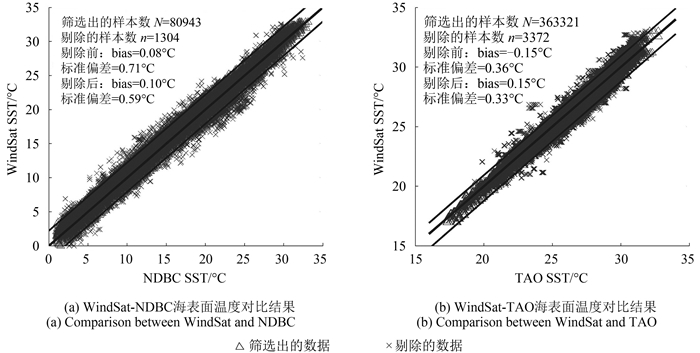
图 2是WindSat海表面温度数据与浮标实测数据的对比结果。WindSat与NDBC之间平均偏差为0.08 ℃,标准偏差为0.71 ℃,与TAO之间平均偏差为-;0.15 ℃,标准偏差为0.36 ℃。根据3sigma原则(Pukelsheim,1994),即数据样本量足够大时,距离平均值正负3倍标准偏差范围内,置信度水平能达到99.73%,将μ±3σ范围外的数据视为大误差数据,进行粗大误差剔除后,美国沿岸区域反演得到的海表面温度的标准偏差可以达到0.60 ℃,近赤道太平洋区域的海表面温度反演误差可以达到0.33 ℃。
3.2 海表面温度日间变化比较
分别选取10年中春季(3-5月)、夏季(6-8月)、秋季(9-11月)、冬季(12-2月)一天24小时各时段WindSat与浮标的SST匹配数据进行对比分析,以整点前后半个小时内的数据计为该整点的数据,得到4个季节的海温日间变化状况,如图 3所示,图中空白处匹配数据缺失。除了20:00和21:00时数据缺失,WindSat 与NDBC各时刻的匹配数据对最多为2225组,最少为123组。WindSat与TAO各时刻匹配数据对中最多为8025组,最少为1421组。
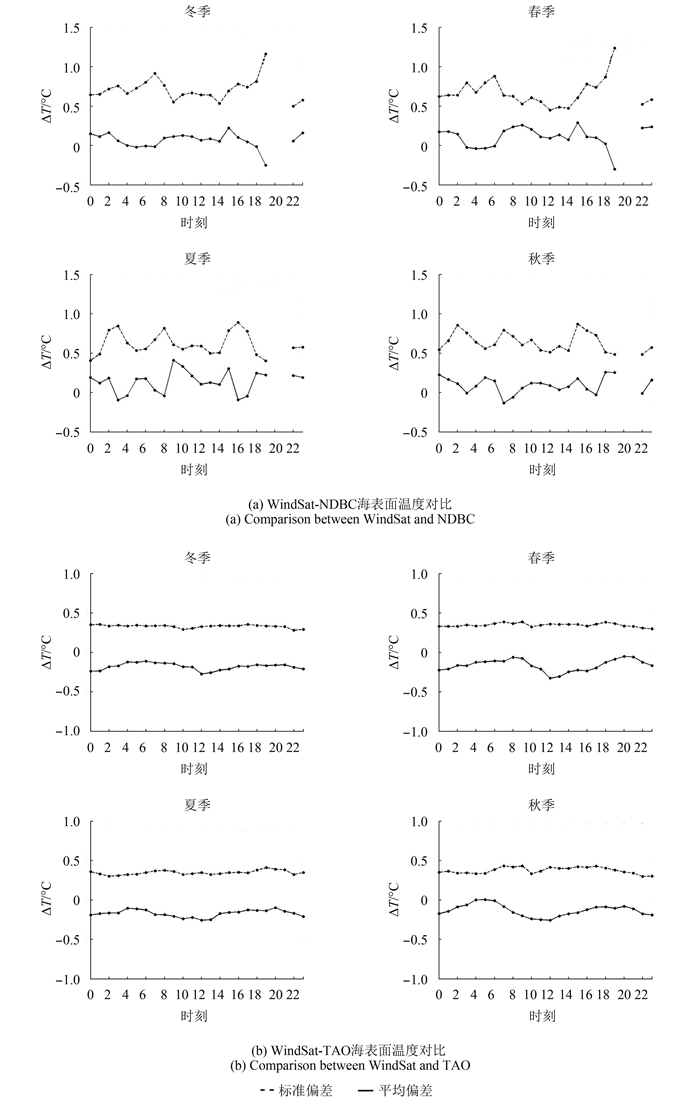
从图 3中看出,在美国沿岸区域WindSat反演得到的海表面温度的平均偏差在一天当中变化较大,而太平洋区域反演得到的海表面温度的平均偏差变化相对平稳,可能由于NDBC浮标离岸比较近,分布区域有着较大的时空多样性,偏差和随机误差较大,而TAO浮标处于开阔海域,偏差和随机误差较小(Gentemann,2004)。
由图 3(a)看出,冬、春季节的日间变化相似,WindSat SST与NDBC之间的平均偏差在黎明前(3-6时)几乎为0;昼间(6-18时)相对较大,春季达到0.20 ℃,夏季达到0.25 ℃;日落之后(18-19时)则低于0 ℃,标准偏差在6时左右和19时左右是两个峰值,18时达到1 ℃以上。在日间太阳辐射增强,导致海水皮层(1 mm)温度升高,皮层温度偏高于表层温度(Price等,1986,Yokoyama等,1995),会使得SST的卫星探测值高于浮标探测值。夏、秋季节的日间变化相似,3时、7时或8时、16或17时平均偏差达到谷值(< 0 ℃),标准偏差出现峰值(0.80 ℃左右)。
图 3(b)显示,冬季与夏季,WindSat SST与TAO之间平均偏差和标准偏差的日间变化不明显,平均偏差在-;0.30--;0.15 ℃之间,标准偏差约为0.30 ℃;春季与秋季,两种SST数据之间的平均偏差和标准偏差日间变化较为明显,春季在8时和20时、秋季在5时和20时左右,标准偏差达到最小值,两个季节在12时左右达到最大值(约为0.40 ℃)。
3.3 海表面温度月际变化比较
图 4是WindSat SST数据与浮标数据的逐月10年平均值的比较分析。表 1给出了各月份匹配数据组数。从图 4中不难发现,WindSat SST全年均高于NDBC SST,而低于TAO SST。WindSat与两种浮标的平均偏差在一年中的变化趋势相似,4-11月,WindSat与NDBC的正偏差较大,与TAO的负偏差较小,1-3月则相反。说明夏季WindSat 的SST观测值相对实测值的暖偏差更大。这与AMSR-E反演得到的结果类似(Dong等2006)。1-3月以及8-9月WindSat与NDBC的标准偏差较大,且1-3月均超过了0.80 ℃,而与TAO的标准偏差变化不明显。
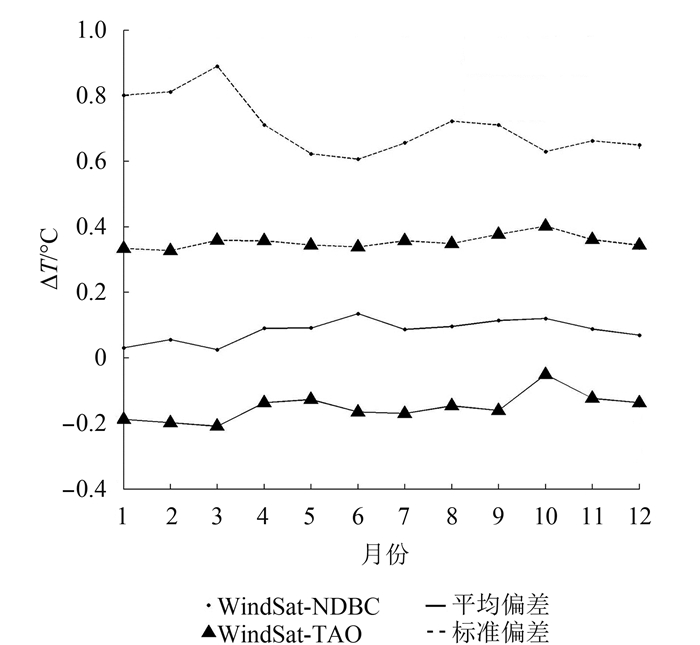
表 1 WindSat SST与浮标对比各月匹配数据组数
Table 1 Sample sizes of each month of the inter-monthly comparison
| 月份 | 1 | 2 | 3 | 4 | 5 | 6 | 7 | 8 | 9 | 10 | 11 | 12 |
| 与NDBC匹配的样本数 | 7642 | 6788 | 7021 | 6361 | 6095 | 5115 | 6112 | 6531 | 7511 | 7593 | 7890 | 7756 |
| 与TAO匹配的样本数 | 34630 | 29823 | 28865 | 28108 | 29523 | 25148 | 30031 | 32258 | 32315 | 31552 | 32494 | 31934 |
3.4 海表面温度年际变化比较
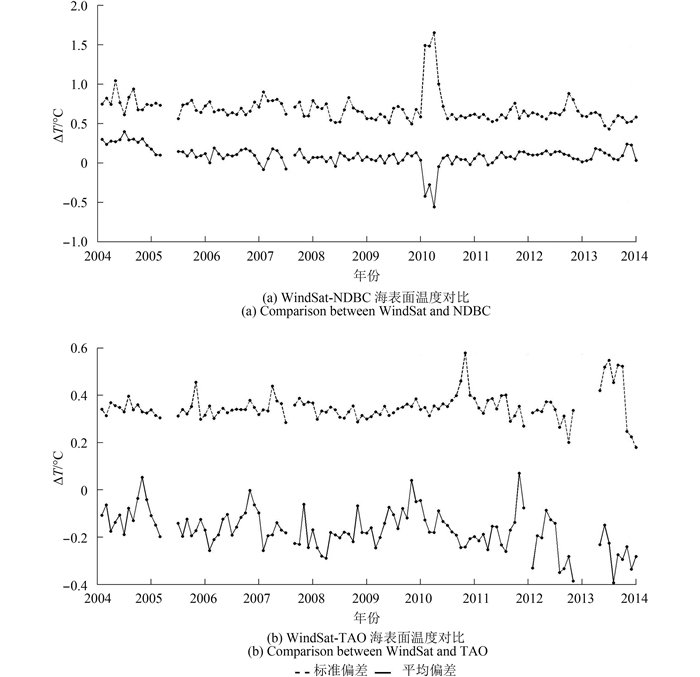
图 5为2004到2013年各月份WindSat SST与浮标数据的平均偏差和标准偏差分布,空缺处表示该月份数据缺失,2005年3-5月由于技术故障关闭了卫星传感器,导致这3个月数据缺失;除去缺失月份数据,WindSat-NDBC各月匹配数据组数最多为1080组,最少为203组; WindSat-TAO在 2012年和2013年匹配数据组数相对较少,其他年份各月匹配数据组数最多为7174组,最少为1147组。从图 5(a)可以看出,WindSat SST与NDBC之间的偏差的季节变化和年际变化规律不明显,但是在2004年、2007年和2010年出现异常变化,可能与厄尔尼诺事件导致东太平洋海水增温(Trenberth,1997)有关。2010年初WindSat SST与NDBC之间偏差明显增大,将浮标数据与WindSat数据以及AMSR-E数据对比发现该现象是由于编号为42002号(26.09°N,93.76°W)和46059号(38.05°N,129.97°W)浮标在2010年1-4月份测量海温值出现异常所致。排除异常值后,WindSat SST与NDBC的平均偏差变化范围为0-0.25 ℃,标准偏差变化范围为0.50-0.90 ℃。由图 5(b)可以发现,WindSat SST整体偏低于TAO 观测值,但是几乎每年10月份左右会出现正偏差或最小的负偏差,而在1-2月份出现最大负偏差。两种数据的平均偏差变化范围为-;0.30-0.10 ℃,标准偏差变化范围为0.30-0.50 ℃。
3.5 WindSat海表面温度误差的空间分布
图 6是WindSat与浮标之间10年间SST数据的平均偏差和标准偏差的空间分布,圆圈代表浮标的分布。图 6(a)中,不同颜色表示平均偏差大小,详见表 2和表 3。WindSat SST数据在近赤道太平洋海域总体要低于浮标测得海温,但在靠近马来群岛和新几内亚岛的地方,WindSat SST偏高于浮标值,这个地区的浮标靠近岛屿,受海温反演中陆地污染的影响表现出趋暖偏差(Gentemann等,2004)。在美国东西海岸沿岸及墨西哥湾,WindSat SST总体偏高于浮标测量值。
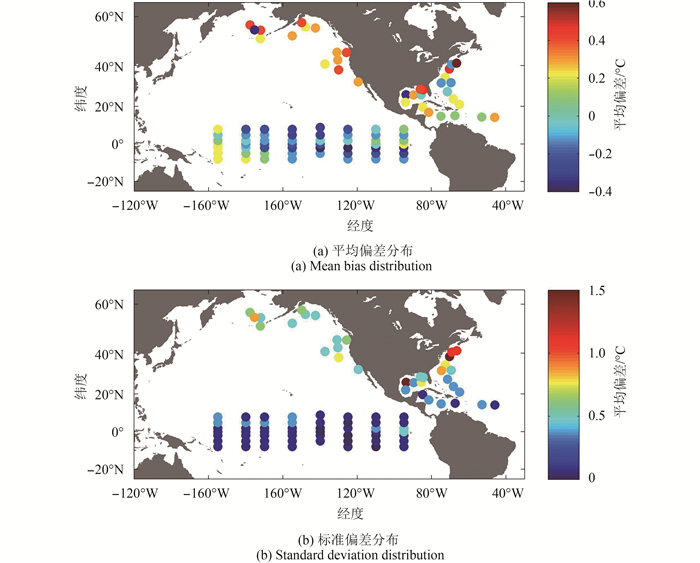
表 2 NDBC各站点平均偏差和标准偏差
Table 2 Mean bias and standard deviations of NDBC buoys
| 纬度/ °N | 经度/ °E | 平均偏差/℃ | 标准偏差/℃ | 纬度/ °N | 经度/ °E | 平均偏差/℃ | 标准偏差/℃ | ||
| 34.56 | 287.37 | 0.09 | 0.73 | 42.59 | 229.53 | 0.16 | 0.55 | ||
| 31.86 | 285.16 | –0.19 | 0.83 | 57.92 | 210.13 | 0.28 | 0.69 | ||
| 26.09 | 266.24 | –0.63 | 1.48 | 45.89 | 234.18 | 0.23 | 0.63 | ||
| 38.484 | 289.57 | 0.36 | 1.39 | 15pt2 | 306.98 | –0.05 | 0.42 | ||
| 40.50 | 290.75 | –0.13 | 1.18 | 19.80 | 275.14 | 0.04 | 0.39 | ||
| 56.30 | 212.08 | 0.02 | 0.56 | 14.92 | 285.08 | –0.01 | 0.45 | ||
| 45.96 | 229.00 | 0.12 | 0.55 | 55.03 | 188.00 | 0.24 | 0.57 | ||
| 40.75 | 222.54 | 0.03 | 0.54 | 14.33 | 313.92 | 0.13 | 0.36 | ||
| 32.40 | 240.46 | 0.19 | 0.56 | 22.20 | 266.00 | 0.06 | 0.41 | ||
| 52.79 | 204.95 | 0.19 | 0.54 | 17.00 | 278.50 | 0.11 | 0.42 | ||
| 25.89 | 270.34 | 0.11 | 0.46 | 55.08 | 184.73 | –0.28 | 0.80 | ||
| 26.04 | 274.39 | –0.06 | 0.72 | 21.06 | 295.03 | 0.06 | 0.40 | ||
| 28.50 | 275.48 | 0.39 | 0.54 | 15.18 | 292.52 | –0.02 | 0.39 | ||
| 28.79 | 273.99 | 0.26 | 0.54 | 55.87 | 217.51 | 0.16 | 0.55 | ||
| 57.03 | 182.26 | 0.24 | 0.60 | 23.89 | 291.63 | 0.02 | 0.48 | ||
| 38.05 | 230.03 | 0.28 | 0.71 | 27.52 | 288.52 | –0.09 | 0.49 | ||
| 51.66 | 187.84 | 0.08 | 0.69 | 31.95 | 290.50 | –0.13 | 0.51 | ||
| 41.11 | 293.42 | 0.64 | 1.16 |
表 3 TAO各站点平均偏差和标准偏差
Table 3 Mean bias and standard deviations of NDBC buoys
| 纬度/ °N | 经度/ °E | 平均偏差/℃ | 标准偏差/℃ | 纬度/ °N | 经度/ °E | 平均偏差/℃ | 标准偏差/℃ | |
| –8 | 165 | 0.02 | 0.37 | 2 | 250 | –0.04 | 0.46 | |
| –8 | 180 | 0.03 | 0.34 | 2 | 265 | –0.03 | 0.51 | |
| –8 | 190 | 0.00 | 0.36 | 5 | 165 | –0.07 | 0.43 | |
| –8 | 205 | –0.11 | 0.35 | 5 | 180 | –0.13 | 0.42 | |
| –8 | 235 | –0.12 | 0.32 | 5 | 190 | –0.14 | 0.41 | |
| –8 | 250 | –0.12 | 0.27 | 5 | 205 | –0.22 | 0.40 | |
| –8 | 265 | –0.13 | 0.32 | 5 | 220 | –0.22 | 0.35 | |
| –5 | 165 | 0.03 | 0.34 | 5 | 235 | –0.13 | 0.27 | |
| –5 | 180 | –0.03 | 0.35 | 5 | 250 | –0.11 | 0.38 | |
| –5 | 190 | –0.04 | 0.33 | 5 | 265 | –0.13 | 0.37 | |
| –5 | 205 | –0.11 | 0.31 | 8 | 165 | 0.00 | 0.43 | |
| –5 | 220 | –0.13 | 0.30 | 8 | 180 | –0.18 | 0.39 | |
| –5 | 235 | –0.17 | 0.29 | 8 | 190 | –0.17 | 0.39 | |
| –5 | 250 | –0.20 | 0.31 | 8 | 205 | –0.25 | 0.42 | |
| –5 | 265 | –0.25 | 0.34 | 8 | 235 | –0.16 | 0.35 | |
| –2 | 165 | 0.07 | 0.37 | 8 | 250 | –0.07 | 0.38 | |
| –2 | 180 | –0.09 | 0.31 | 8 | 265 | –0.03 | 0.34 | |
| –2 | 190 | –0.18 | 0.33 | 9 | 220 | –0.23 | 0.39 | |
| –2 | 205 | –0.21 | 0.31 | 0 | 220 | –0.17 | 0.28 | |
| –2 | 220 | –0.36 | 0.35 | 0 | 250 | –0.09 | 0.35 | |
| –2 | 235 | –0.30 | 0.29 | 0 | 265 | 0.03 | 0.58 | |
| –2 | 250 | –0.27 | 0.27 | 2 | 165 | –0.04 | 0.37 | |
| –2 | 265 | –0.26 | 0.31 | 2 | 180 | –0.06 | 0.38 | |
| 0 | 165 | 0.06 | 0.33 | 2 | 190 | –0.15 | 0.35 | |
| 0 | 180 | –0.14 | 0.31 | 2 | 205 | –0.14 | 0.31 | |
| 0 | 190 | –0.17 | 0.31 | 2 | 220 | –0.06 | 0.29 | |
| 0 | 205 | –0.20 | 0.32 | 2 | 235 | –0.06 | 0.31 |
图 6(b)中圆的颜色表示标准偏差大小,详见表 2和表 3。可以看出,WindSat与TAO的相比,其标准偏差均小于0.60 ℃;与NDBC的标准偏差只有加勒比海与美国东海岸部分站点小于0.50 ℃,大部分都大于0.50 ℃,有4个站点的标准偏差超过了1 ℃,其中3个在美国东海岸,一个在墨西哥湾。WindSat SST在美国东海岸以及墨西哥湾有着最大的标准偏差,这些区域都受到墨西哥湾流的影响,有较高的时空变异性,可能导致卫星反演SST不确定性较大(Gentemann等,2004)。
3.6 WindSat SST数据与浮标风速之间的相关性
为了探究WindSat SST反演误差与海面风速之间的关系,本文以1 m/s为间隔,计算了在不同的浮标风速范围内WindSat SST与浮标值之间的平均偏差和标准偏差,图 7显示了WindSat SST的平均偏差和标准偏差与浮标风速之间的关系,与NDBC对比的风速范围为0-18 m/s,与TAO对比的风速范围为0-12 m/s。
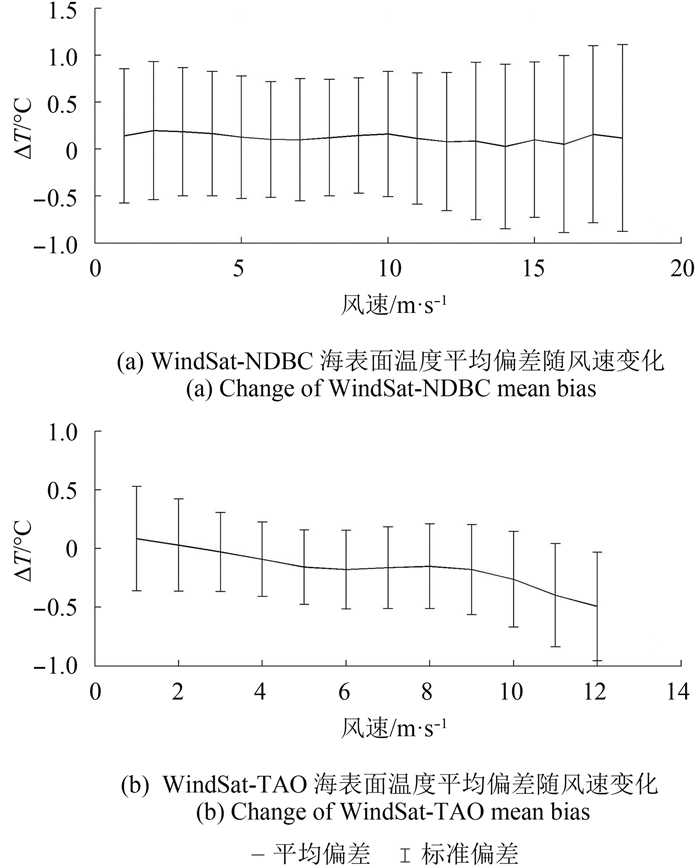
图 7(a)显示,WindSat SST与NDBC的平均偏差随风速的增大没有明显变化,但是,标准偏差受风速影响较为明显。风速为1-5 m/s时,标准偏差随风速增大而减小;风速为5-10 m/s时,标准偏差比较稳定;当风速超过12 m/s时,标准偏差随风速增大而增大,在18 m/s风速时,平均偏差达到0.20℃,标准偏差达到0.80 ℃。从图 7(b)看出,风速超过2 m/s后,WindSat SST较TAO浮标值由偏高变为偏低,3-6 m/s时负偏差随风速增大而增大,6-8 m/s时偏差趋于稳定,超过8 m/s时负偏差随风速增大迅速增大,标准偏差在风速小于4 m/s时随风速增大而减小,4-8 m/s时比较稳定,超过8 m/s时随风速增大而增大,在12 m/s风速时平均偏差达到-;0.44 ℃,标准偏差约为0.40 ℃。
以上分析显示对于不同海域,WindSat SST随海面风速的变化规律不同,使用时需要注意其区域适应性。在美国沿岸以及墨西哥湾海域,WindSat SST与实测值的平均偏差随风速变化不明显,标准偏差在风速大于10m/s时开始增大;在近赤道太平洋,WindSat SST与实测值的平均偏差随风速增大而负向增大,标准偏差变化较小。不管是与NDBC还是TAO对比,都显示WindSat在5-10 m/s风速段反演SST的效果比较好。
图 7(b)中风速2-6 m/s区间内平均偏差随风速增加而负向增大,这时风浪产生的海面粗糙度是影响海面发射率的主要因素。一般认为,海面风速超过7 m/s时,海浪破碎形成泡沫,对发射率影响非常大。由图 7(b)可知,风速超过9 m/s时,平均偏差和标准偏差随风速增加而变大,此时泡沫成为影响海表发射率的主要因素。当风速超过12 m/s时(图 7(a)),标准偏差随风速增大迅速增加,在这种高风速海况下,泡沫急剧增加,海况变化剧烈,出现大量不确定因素,使得海温的反演出现很大困难(Chelton等,2001)。WindSat海温反演算法需要进行风向校正(Meissner和Wentz,2007),WindSat海温在风速大于10 m/s时的误差增大可能是由于风向反演误差引起。殷晓斌等人(2007)根据AMSR的海表面温度反演算法研究得出,1m/s的海面风速反演误差和20°的风向反演误差可能导致海表面温度1℃甚至更高的反演误差。
3.7 WindSat SST与AMSR-E SST的对比
为了探求WindSat海温数据在全球范围内的准确度情况,将其与目前比较成熟的AMSR-E数据进行对比,选取两种传感器2004年-2011年间的月平均海温数据。WindSat和AMSR-E SST数据都从RSS获得,两者同为1440×720的格点数据。Castro等人(2012)将2005年-2008年AMSR-E SST第5版数据与漂流浮标数据进行了对比,发现昼间偏差和标准偏差为0.03 ℃和0.62 ℃,夜间偏差和标准偏差为0.02 ℃和0.63 ℃。Lean和Saunders(2013)将2003年-2009年AMSR-E 第5版SST数据与ATSR(Along-Track Scanning Radiometer)气候再处理数据ARC(Reprocessing for Climate)以及漂流浮标数据进行了三方搭配分析,发现AMSR-ESST误差在0.46 ℃(2003年-2006年)至0.50 ℃(2009年)之间。
图 8是WindSat与AMSR-E的SST月平均值在1月和7月的8年(2004-2011)平均值之间平均偏差的分布图,空白处为数据缺失。可以看出WindSat与AMSR-E的海表面温度误差基本在±0.50 ℃以内,大部分海域的误差在±0.20 ℃以内。1月份,-;50°N-40°N之间的大部分海域,WindSat SST偏低于AMSR-E反演值,而在40°N以北海域,WindSat SST整体偏高。7月份,WindSat SST几乎在整个南半球海域相对于AMSR-E呈现暖偏差,同时,其偏低区域整体北移,且纬度范围减小。
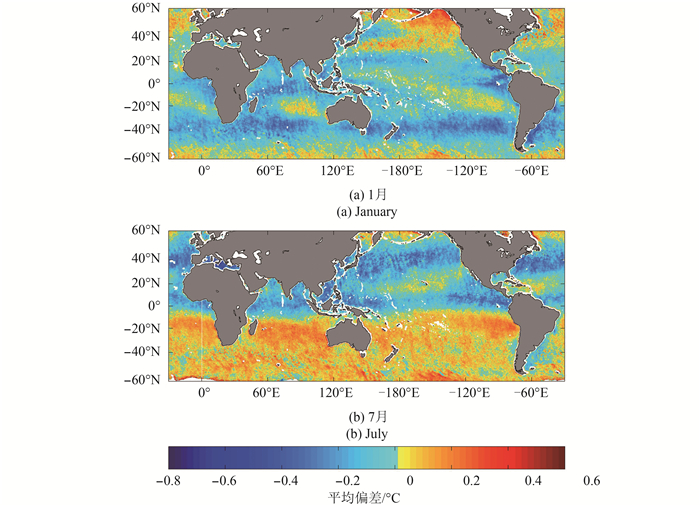
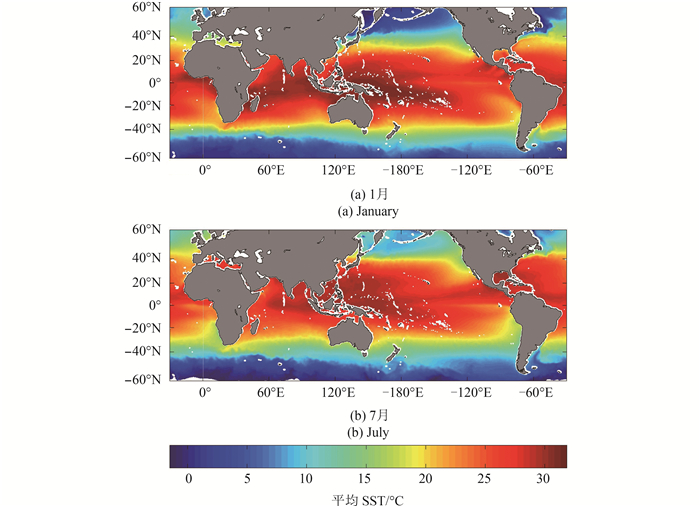
为了探求WindSat与AMSR-E SST偏差与海温分布的关系,分别给出1月和7月AMSR-E海温数据8年平均值的全球分布图(如图 9)。图 9(a)显示,1月份,40°S-30°N之间为暖水区域(> 20 ℃),与图 8(a)中WindSat SST偏低于AMSR-E的区域吻合。图 9(a)中赤道东太平洋冷舌与图 8(a)中赤道东太平洋狭长偏高带吻合。图 9(b)显示,7月份,低纬与中低纬地区的暖水区北移,纬度范围变为-;40°N-40°N,对应于图 8(b)中WindSat SST的偏低区北移,赤道东太平洋冷舌缩短变宽,WindSat在赤道东太平洋的偏高带也缩短。图 8和图 9显示,WindSat SST与AMSR-E SST间偏差在北半球海域随季节变化不明显,在南半球海域随季节变化显著。夏季,WindSat SST较AMSR-E偏低;冬季,WindSat SST较 AMSR-E偏高。
4 结 论
本文以2004年-2013年10年间的WindSat SST数据为主要评估对象,以NDBC和TAO浮标观测数据为主要验证数据、AMSR-E月平均SST数据为辅助验证数据,从时间尺度和空间尺度进行了对比分析。
WindSat SST数据与NDBC SST数据之间的平均偏差为0.08 ℃,标准偏差为0.71 ℃,与TAO海表面温度数据之间的平均偏差为-;0.15 ℃,标准偏差为0.36 ℃。根据3-sigam原则进行粗大误差处理后,WindSat与NDBC之间平均偏差为0.10 ℃,标准偏差为0.59 ℃,略优于Meissne和Wentz(2007)基于RS OI(Optimum Interpolated)数据的验证结果(Bias = -;0.11 ℃,标准偏差 = 0.66 ℃),WindSat与TAO之间平均偏差为-;0.15 ℃,标准偏差为0.33 ℃。相比于Castro等人(2012)利用漂流浮标对AMSR-E SST 数据的验证结果(昼间Bias = 0.03 ℃,标准偏差 = 0.62 ℃,夜间Bias = 0.02 ℃,标准偏差 = 0.63 ℃),WindSat海温反演精度略低。 WindSat SST数据在不同区域的反演偏差存在着一定的差异性。在NDBC浮标所处的美国东西海岸沿岸及墨西哥湾,WindSat SST与实测值相比总体偏高,在一天中各时段,平均偏差和标准偏差比较多变,而且春冬和夏秋呈现不同的规律性;一年之中,WindSat SST在冬末春初和夏末秋初存在较大的不确定性。而在TAO浮标所处的近赤道太平洋海域,WindSat SST总体偏低于实测值,一天中平均偏差和标准偏差相对都比较稳定,春秋季节标准偏差的日间变化呈现一定的规律性,一年中,与实测值的标准偏差比较稳定。从对各浮标站点的分析来看,WindSat SST在美国东海岸及墨西哥湾有着很大的不确定性。
本文针对风速对WindSat SST的影响作了分析,发现WindSat SST与实测值的平均偏差在不同海域受风速的影响不同,在美国沿岸及墨西哥湾,平均偏差随风速变化很小,而在近赤道太平洋,平均偏差受风速影响很大。综合与两种浮标数据的比较结果发现,在5-10 m/s风速段,WindSat SST反演效果比较理想,平均偏差和标准偏差相对比较稳定。风速大于12 m/s时WindSat SST不确定性急剧增大。与AMSR-E月平均SST数据的对比显示,WindSat与AMSR-E间测量海温偏差在北半球海域随季节变化不明显,在南半球海域随季节变化显著。夏季,WindSat SST较AMSR-E偏低;冬季,WindSat SST较AMSR-E偏高。
总体来看,WindSat SST在近赤道太平洋海域的反演效果比较好,在美国沿岸及墨西哥湾海域反演结果相对较差。考虑到不同风速下海表面温度反演的差异,下一步应改进算法中的风向校正部分,提高风速大于12m/s时的反演精度。此外,在进行全极化微波辐射计SST算法建立时,应充分考虑到洋流、异常气候、陆地污染等对其的影响。
志 谢 感谢美国国家浮标数据中心(NDBC)网站为本文提供了现场实测海表面温度资料,RSS网站为本文提供了WindSat和AMSR-E海表面温度资料。
参考文献
-
Castro S L, Wick G A and Emery W J. 2012. Evaluation of the relative performance of sea surface temperature measurements from different types of drifting and moored buoys using satellite-derived reference products. Journal of Geophysical Research:Oceans, 117(C2):C02029[DOI:10.1029/2011JC007472]
-
Chelton D B, Esbensen S K, Schlax M G, Thum N, Freilich M H, Wentz F J, Gentemann C L, McPhaden M J and Schopf P S. 2001. Observations of coupling between surface wind stress and sea surface temperature in the eastern tropical Pacific. Journal of Climate, 14(7):1479-1498[DOI:10.1175/1520-0442(2001)014<1479:OOCBSW>2.0.CO;2]
-
Chelton D B and Wentz F J. 2005. Global microwave satellite observations of sea surface temperature for numerical weather prediction and climate research. Bulletin of the American Meteorological Society, 86(8):1097-1115[DOI:10.1175/BAMS-86-8-1097]
-
Curry J A, Bentamy A, Bourassa M A, Bourras D, Bradley E F, Brunke M, Castro S, Chou S H, Clayson C A, Emery W J, Eymard L, Fairall C W, Kubota M, Lin B, Perrie W, Reeder R A, Renfrew I A, Rossow W B, Schulz J, Smith S R, Webster P J, Wick G A and Zeng X. 2004. Seaflux. Bulletin of the American Meteorological Society, 85(3):409-424[DOI:10.1175/BAMS-85-3-409]
-
Dong S F, Gille S T, Sprintall J and Gentemann C. 2006. Validation of the advanced microwave scanning radiometer for the Earth Observing System(AMSR-E) sea surface temperature in the Southern Ocean. Journal of Geophysical Research:Oceans(1978-2012), 111(C4):C04002[DOI:10.1029/2005JC002934]
-
Gaiser P W, St Germain K M, Twarog E M, Poe G A, Purdy W, Richardson D, Grossman W, Jones W L, Spencer D, Golba G, Cleveland J, Choy L, Bevilacqua R M and Chang P S. 2004. The WindSat spaceborne polarimetric microwave radiometer:sensor description and early orbit performance. IEEE Transactions on Geoscience and Remote Sensing, 42(11):2347-2361[DOI:10.1109/TGRS.2004.836867]
-
Gentemann C L, Wentz F J, Mears C A and Smith D K. 2004. In situ validation of Tropical Rainfall Measuring Mission microwave sea surface temperatures. Journal of Geophysical Research:Oceans(1978-2012), 109(C4):C04021[DOI:10.1029/2003JC002092]
-
Jiang J S. 1999. China microwave remote sensing technology facing to 21st Century. Engineering Science, 1(2):78-82(姜景山. 面向21世纪的中国微波遥感技术发展. 中国工程科学, 1999, 1(2):78-82)
-
Kachi M, Naoki K, Hori M and Imaoka K. 2013. AM-SR2 validation results//2013 IEEE International Geoscience and Remote Sensing Symposium(IGARSS). Melbourne, VIC:IEEE:831-834[DOI:10.1109/IGARSS.2013.6721287]
-
Kachi M, Shibata A, Murakami H and Imaoka K. 2014. Japanese GHRSST activities and the AMSR2 SST Validations//EGU General Assembly Conference Abstracts. Vienna, Austria:16:EGU2014-13862
-
Lean K and Saunders R W. 2013. Validation of the ATSR Reprocessing for Climate(ARC) dataset using data from drifting buoys and a three-way error analysis. Journal of Climate, 26(13):4758-4772[DOI:10.1175/JCLI-D-12-00206.1]
-
Li M, Liu J P, Zhang Z H and Zhang L. 2010. Evaluation of AMSR-E SST in the Southern Ocean using drifting buoy data. Acta Oceanologica Sinica, 32(6):47-55(李明, 刘骥平, 张占海, 张林. 利用南大洋漂流浮标数据评估AMSR-E SST. 海洋学报, 2010, 32(6):47-55)
-
Mangum L J, Freitag H P and McPhaden M J. 1994. TOGA-TAO array sampling schemes and sensor ev-aluations//Proceedings of OCEANS'94. 'Oceans Engineering for Today's Technology and Tomorrow's Preservation. Brest:IEEE:2:Ⅱ/402-Ⅱ/406[DOI:10.1109/OCEANS.1994.364077]
-
McPhaden M J. 1995. The tropical atmosphere ocean array is completed. American Meteorological Society, Bulletin, 76(5):739-741
-
Meissner T and Wentz F. 2005. Ocean retrievals for WindSat:radiative transfer model, algorithm, validation//Proceedings of MTS/IEEE. Washington DC, USA:IEEE:1:130-133[DOI:10.1109/OCEANS.2005.1639750]
-
Meissner T and Wentz F. 2007. High quality sea surface temperature from the windsat radiometer:algorithm and validation//Proceedings of IEEE International Geoscience and Remote Sensing Symposium. Barcelona:IEEE:862-864[DOI:10.1109/IGARSS. 2007.4422933]
-
Pichel W, Maturi E, Clemente-Colón P and Sapper J. 2001. Deriving the operational nonlinear multichannel sea surface temperature algorithm coefficients for NOAA-15 AVHRR/3. International Journal of Remote Sensing, 22(4):699-704[DOI:10.1080/01431160010013793]
-
Price J F, Weller R A and Pinkel R. 1986. Diurnal cycling:observations and models of the upper ocean response to diurnal heating, cooling, and wind mixing. Journal of Geophysical Research:Oceans(1978-2012), 91(C7):8411-8427[DOI:10.1029/JC091iC07p08411]
-
Pukelsheim F. 1994. The three sigma rule. The Americ-an Statistician, 48(2):88-91[DOI:10.1080/00031305.1994.10476030]
-
Stammer D, Wentz F and Gentemann C. 2003. Validation of microwave sea surface temperature measurements for climate purposes. Journal of Climate, 16(1):73-87[DOI:10.1175/1520-0442(2003)016<0073:VOMSST>2.0.CO;2]
-
Sutton R T and Hodson D L R. 2003. Influence of the ocean on North Atlantic climate variability 1871-1999. Journal of Climate, 16(20):3296-3313[DOI:10.1175/1520-0442(2003)016<3296:IOTOON> 2.0.CO;2]
-
Trenberth K E. 1997. The definition of el niño. Bulletin of the American Meteorological Society, 78(12):2771-2777.[DOI:http://dx.doi.org/10.1175/1520-0477(1997)078<2771:TDOENO>2.0. CO;2]
-
Yin X B, Liu Y G, Wang Z Z, Cheng Y C, Gu Y Z and Wen F. 2007. Comparison between infrared and microwave radiometers for retrieving the sea surface temperature. Marine Science Bulletin, 26(5):3-10, 21(殷晓斌, 刘玉光, 王振占, 程永存, 顾艳振, 文凡. 红外和微波辐射计反演海表面温度的比较. 海洋通报, 2007, 26(5):3-10, 21)[DOI:10.3969/j.issn.1001-6392.2007.05.001]
-
Yokoyama R, Tanba S and Souma T. 1995. Sea surface effects on the sea surface temperature estimation by remote sensing. International Journal of Remote Sensing, 16(2):227-238[DOI:10.1080/01431169508954392]