纳米压痕测试是一种有效评估块体、涂层及薄膜材料力学性能的方法,其制样方便、操作简单、位移荷载分辨率高,目前广泛用于弹性模量和硬度的测试中[1-3]。随着理论研究的深入,利用压痕测试获取材料的本构关系成为一个研究热点[4-8]。当前针对本构关系的研究,主要集中于反演分析方法的推导,而忽略了材料的本身特性。对于塑性变形明显的材料来说,压痕实验中存在凸起(Pile-up)现象,即卸载后压头周围材料位置高于初始样品表面[1]。然而,当前商用压痕测试理论Oliver-Pharr(O-P)法中,没有考虑材料的Pile-up现象,这会导致测试值偏高,Pharr等[9]通过仿真研究表明测试误差严重时可以达到50%左右。然而Pile-up现象对材料测试精度的影响以及对本构关系反演计算的影响,鲜有研究报道。针对这一问题,对几种典型材料进行纳米压痕测试,利用能量法和极限分析法,结合有限元模拟,探讨Pile-up现象对测试材料力学参数及本构关系的影响。
1 能量法理论当前纳米压痕商业化测试中采用的理论为Oliver-Pharr法,通过计算压痕接触面积及卸载刚度等计算力学参数,该方法忽略了材料Pile-up现象的影响。能量法认为压痕测试是能量消耗或者做功的过程,是通过载荷-位移曲线计算压痕过程中总功与弹塑性功的比例来计算硬度和弹性模量的一种方法。由于其计算过程不考虑压痕接触面积等因素,因此Pile-up现象不影响其计算精度[10-12]。
图 1为纳米压痕测试过程,由加载曲线和卸载曲线组成。能量法假设加载曲线下面积为总功wtot,卸载曲线下的面积为弹性功we,则不可逆功即塑性功为wp=wtot-we。

|
Download:
|
| 图 1 能量法示意图 Fig. 1 Schematic illustration of energy method | |
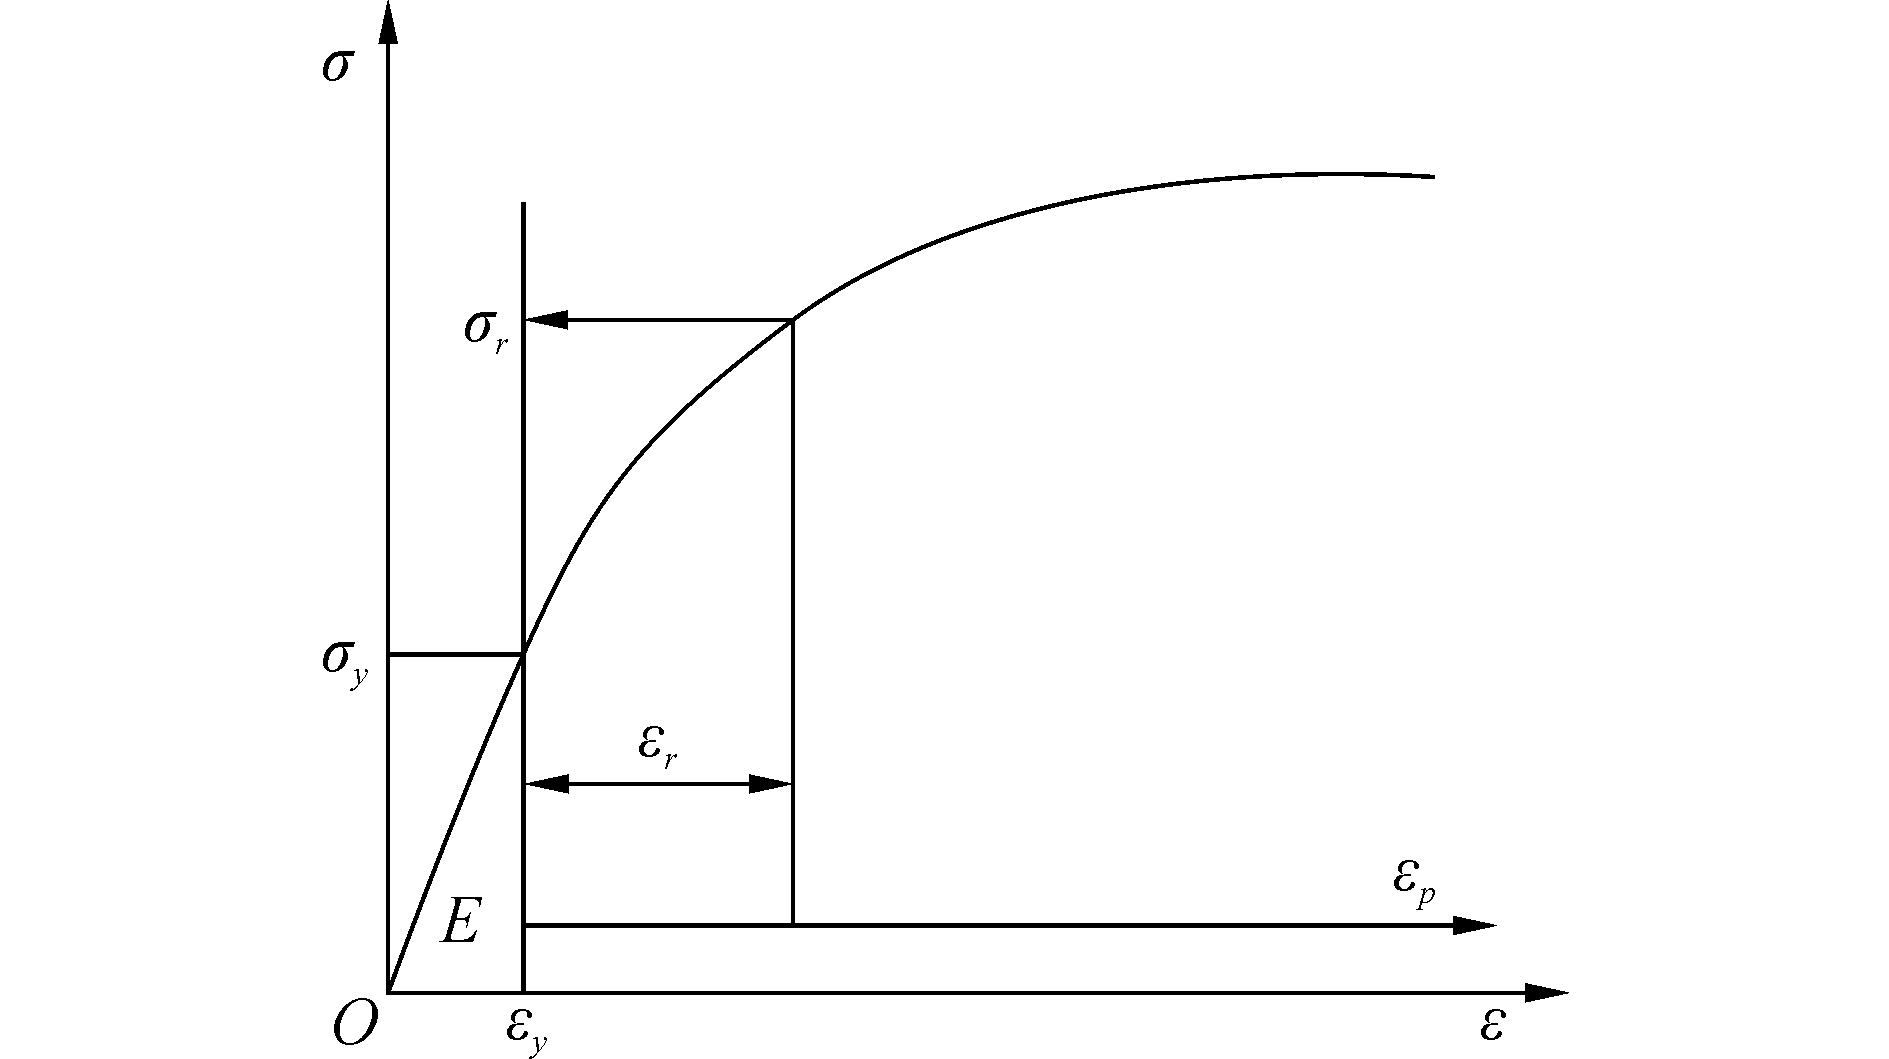
选取幂律函数作为材料的本构模型,如图 2所示。根据Cheng-Cheng理论[10],当压头压入材料时,压痕载荷P是材料力学参数和压痕参数的函数,表示为
| $ F = {f_l}\left( {{E^ * },\upsilon ,Y,n,h,\theta } \right) $ | (1) |
|
Download:
|
| 图 2 幂律本构模型 Fig. 2 The power law stress-strain behavior | |
式中:υ为材料泊松比,Y为屈服强度,n为硬化指数,h为压头位移,θ为压头角度,E*为折合模量。
根据Hertz弹性接触理论以及弹性半空间的Sneddon接触模型,得出两弹性体法向接触的一般表达式[13-14]:
| $ {E^ * } = S\sqrt {\rm{ \mathsf{ π} }} /\left( {2\beta \sqrt A } \right),H = P/A $ | (2) |
| $ \frac{1}{{{E^ * }}} = \frac{{1 - {\upsilon ^2}}}{E} + \frac{{1 - \upsilon _i^2}}{{{E_i}}} $ | (3) |
式中:S为压痕测试卸载刚度,β为与压头形状有关的常数,玻氏压头βb=1.034,维氏压头βv=1.012,圆柱压头βc=1.000, A为压痕测试面积函数,H为材料硬度,E为材料弹性模量,υi为压头泊松比,Ei为压头弹性模量。值得注意的是,该式虽然建立于弹性接触理论之上,但也适用于弹塑性接触。
同理,卸载过程,压痕荷载表示为
| $ F = {f_u}\left( {{E^ * },\upsilon ,Y,n,h,{h_m},\theta } \right) $ | (4) |
根据量纲分析和有限元分析得出:
| $ \frac{H}{{{E^ * }}} = \kappa \frac{{{W_{\rm{e}}}}}{{{W_{{\rm{tot}}}}}},\;\;\;\;{h_f}/{h_m} > 0.4 $ | (5) |
式中:κ=1/[λ(1+γ)];λ=1.5tan θ+0.327;γ为常数,根据Cheng-Cheng理论[10]仿真的we/wtot比值拟合得出,当hf/hm > 0.4时,γ=0.27;60°≤θ≤80°;hf为压痕测试残余深度;hm为最大压痕深度;H为材料硬度。
由式(2)、(3)和式(5)联立可以看出,只需求出卸载刚度、弹性功以及总功就可以求出弹性模量和硬度,整个计算过程没有涉及到接触面积函数的求解,从而避免了Pile-up现象对测试结果的影响。
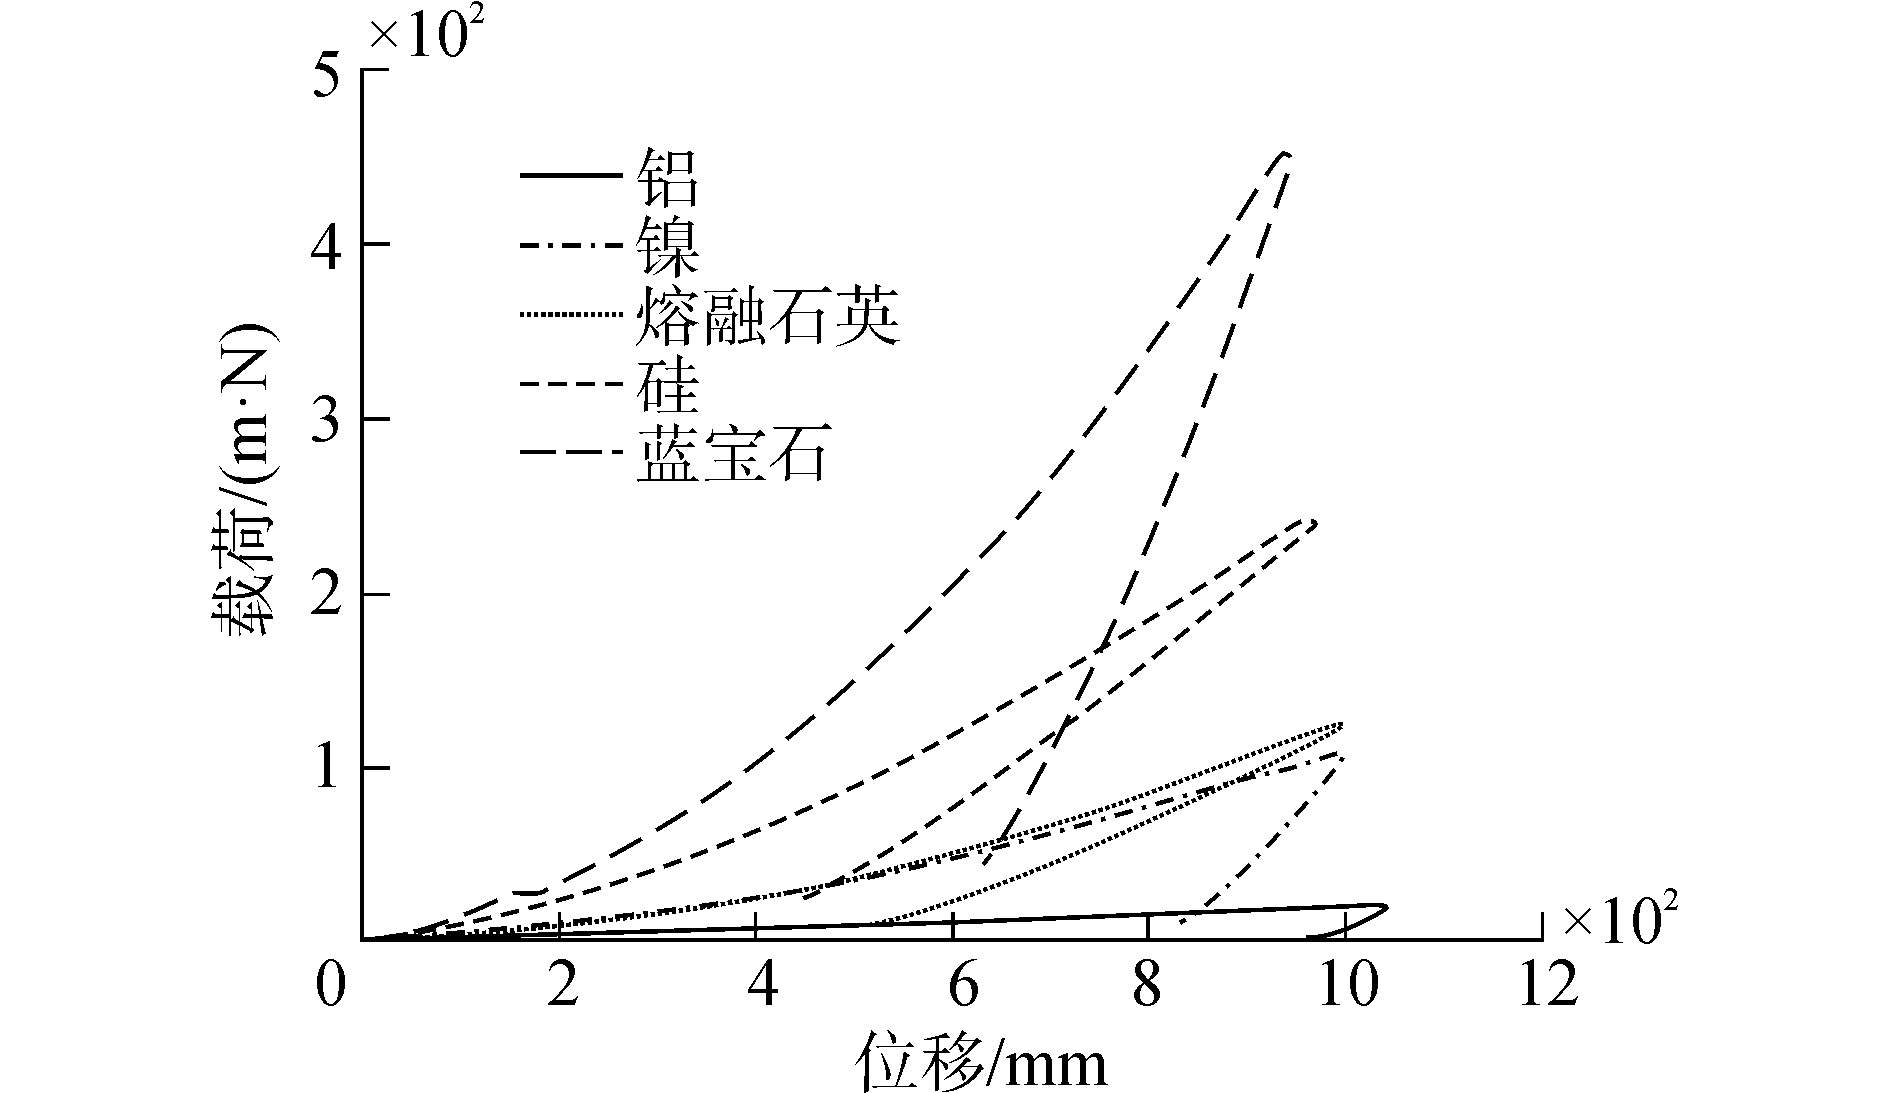
2 纳米压痕试验与结果分析选取纯铝、硅、熔融石英、蓝宝石、纯镍五种材料进行纳米压痕实验,其中,金属铝和镍在压痕测试中存在严重的Pile-up现象,其他三种样品无此现象[1]。每种样品均抛光处理,并进行超声清洗,确保样品表面光滑整洁。采用MTS公司的Nano Ⅱ纳米压痕仪,采用连续刚度法(continuous stiffness measurement, CSM)进行测试,每种样品测试5个点,最大压痕深度均为1 000 nm,数据取测试平均值。
对实验所得荷载-位移曲线进行分析,见图 3,通过卸载曲线可以看出材料铝和镍的弹性恢复较低,残余深度较大,说明压头压入材料后,很快达到屈服强度,发生塑性应变,其压痕残余深度和压入深度的比值较大。而其余三种非金属材料弹性恢复较大,进入塑性区较慢。
|
Download:
|
| 图 3 五种材料实测曲线 Fig. 3 Experimental curves of both specimens | |
利用O-P法和能量法分别对材料进行弹性模量和硬度的计算,并根据荷载-位移曲线计算出压痕残余深度和压入深度的比值(hf/hm),计算结果如图 4所示。定义两种方法的误差率e为
| $ e = \left| {\frac{{{Q_{{\rm{O}} - {\rm{P}}}} - {Q_{\rm{w}}}}}{{{Q_{{\rm{O}} - {\rm{P}}}}}}} \right| \times 100\% $ | (6) |

|
Download:
|
| 图 4 两种方法计算结果对比 Fig. 4 Comparison between the O-P method and energy method | |
式中:QO-P代表Oliver-Pharr法的计算结果,Qw代表能量法的计算结果。
图 4给出了两种方法计算得出的力学参数和误差率,通过两种方法的误差率对比,可以看到,材料铝和镍的误差率较大,即压痕残余深度/压入深度hf/hm>0.7时,硬度值和弹性模量值的误差率均在20%以上。而对于其他三种材料,即当hf/hm<0.7时,误差率均在5%之下,误差较小,可以忽略,这和文献[9]的仿真模拟结果一致。由此得出,O-P法和能量法在计算hf/hm<0.7时的材料时,均可适用。而对于残余深度较大的材料,即塑性变形明显材料(hf/hm > 0.7)时,Pile-up现象对测试结果的影响比较明显,采用O-P法计算存在较大的误差,应适用能量法或者其他方法进行计算。
3 反演分析理论与计算材料本构关系的反演计算前提是获取材料的弹性模量,如前所述,对于塑性变形较明显材料(hf/hm > 0.7)来说,由于材料本身具有Pile-up现象,采用O-P法计算的弹性模量误差较大,进而反演分析的精度有待确定。因此,本节研究Pile-up现象对本构关系的反演影响程度。
3.1 极限分析法假设载荷-位移曲线的加载曲线符合Kick定律,即
| $ F = C{h^2} $ | (7) |
式中C为加载曲线的曲率。
对于玻氏压头、角度固定,可以不考虑,而且泊松比对曲线分布影响不大,因此,式(1)可简化为
| $ F = {f_l}\left( {{E^ * },{\sigma _r},n,h} \right) $ | (8) |
式中σr为特征应力。
对式(8)应用量纲分析中的Π定理:
| $ F = {\sigma _r}{h^2}{\Pi _1}\left( {{E^ * }/{\sigma _r},n} \right) $ | (9) |
| $ C = F/{h^2} = {\sigma _r}{\Pi _1}\left( {{E^ * }/{\sigma _r},n} \right) $ | (10) |
根据式(9),得出:
| $ \frac{F}{{{h^2}{\sigma _r}}} = \frac{C}{{{\sigma _r}}} = \Pi \left( {\frac{{{E^ * }}}{{{\sigma _r}}},n} \right) $ | (11) |
根据Dao等[4]研究,如果使用特征应力进行计算,硬化指数n的数值对函数没有影响,可以忽略。这样公式简化为
| $ \frac{F}{{{h^2}{\sigma _r}}} = \frac{C}{{{\sigma _r}}} = \Pi \left( {\frac{{{E^ * }}}{{{\sigma _r}}}} \right) $ | (12) |
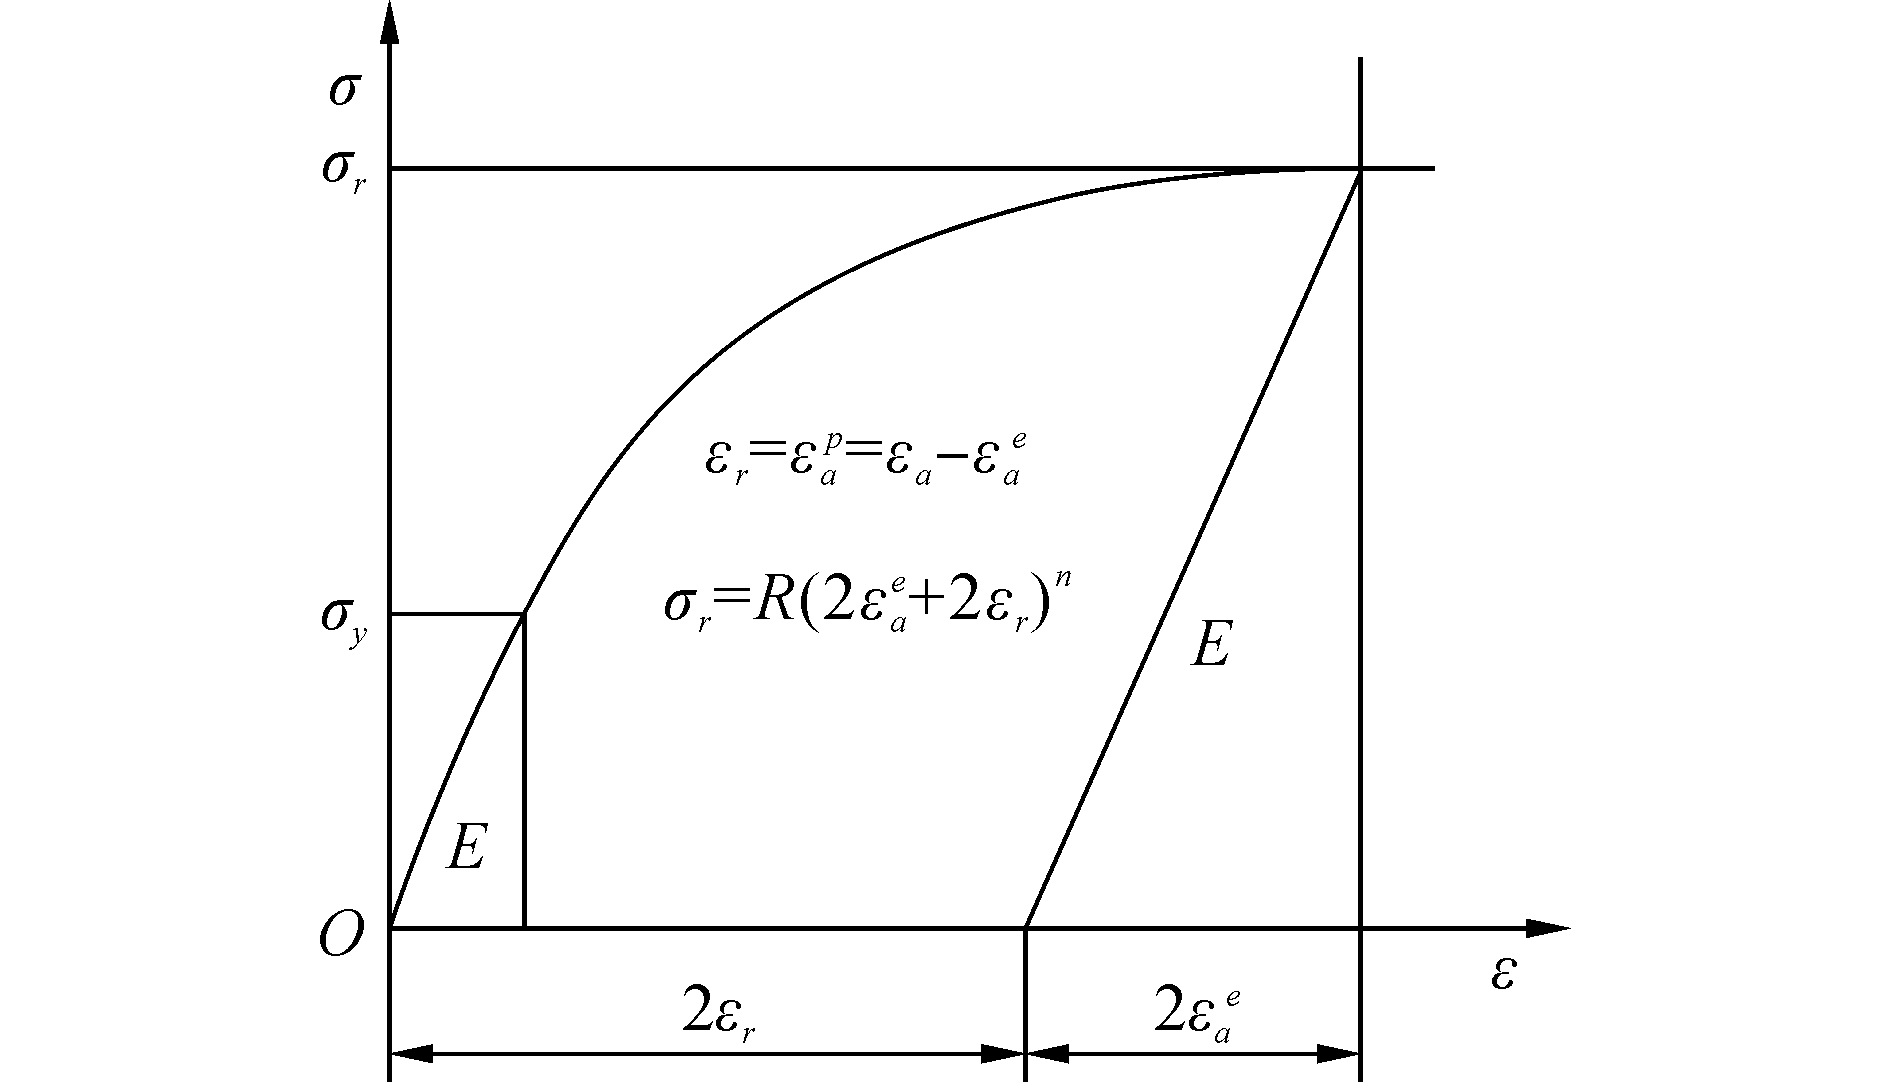
Ogasawara等[7-8]将压头压入材料表面等效为双向受力加载,根据此力学假设,提出了一种新型特征应变,如图 5所示,具体推导步骤参考文献[7]。认为弹塑性材料可以看做是纯弹性和刚塑性材料的组合,提出了弹性极限和塑性极限的概念,并根据弹性极限到塑性极限的变化以及利用有限元模型验证,提出一个基于弹性极限和塑性极限值的经验方程:
| $ {\Pi _{\exp }} = \frac{C}{{{\sigma _r}}} = {\left( {\frac{1}{{{m_e}\frac{{{E^ * }}}{{{\sigma _R}}}}} + \frac{1}{{{m_P}}}} \right)^{ - 1}} $ | (13) |
|
Download:
|
| 图 5 新型幂律本构模型 Fig. 5 The new power law stress-strain behavior | |
式中:me代表弹性极限值,mp代表塑性极限值。
根据式(13),可计算出材料的特征应力,联立式(9)和(10),得出材料的幂律指数和屈服应力,由此计算出材料的本构方程。
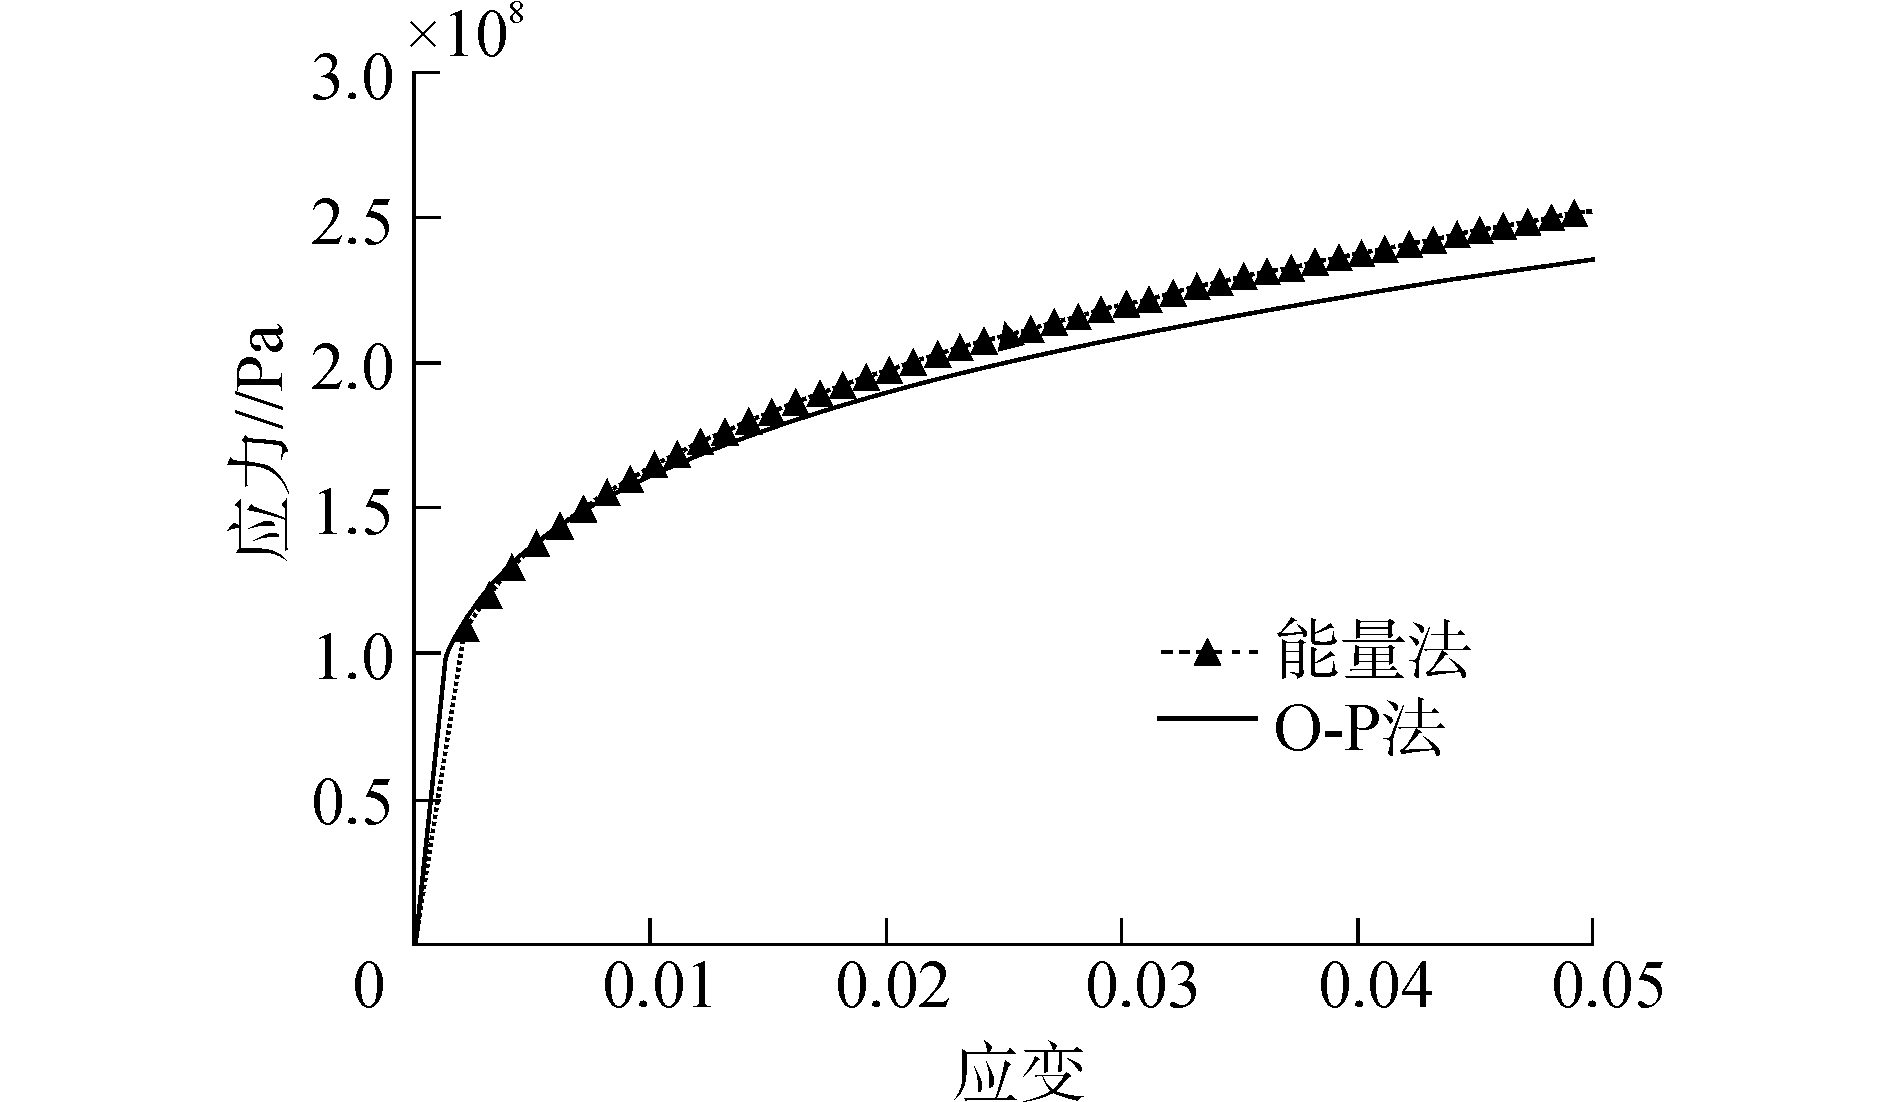
3.2 反演计算选取塑性变形明显的材料铝为例,通过极限分析反演方法,计算得出本构方程,并绘制出本构关系,如图 6所示。
|
Download:
|
| 图 6 两种方法反演本构关系对比 Fig. 6 Computational stress-strain behavior between the O-P method and Energy method | |
利用能量法和O-P法计算出的材料铝的应力应变方程:
| $ {\sigma _w} = \left\{ \begin{array}{l} 50 \times {10^9} \times \varepsilon ,\\ \;\;\;\;\;\sigma \le 109.02 \times {10^6}{\rm{Pa}}\\ 109.02 \times {10^6} \times {\left( {1 + 458.6{\varepsilon _p}} \right)^{0.268}},\\ \;\;\;\;\;\sigma > 109.02 \times {10^6}{\rm{Pa}} \end{array} \right. $ | (14) |
| $ {\sigma _{{\rm{O}} - {\rm{P}}}} = \left\{ \begin{array}{l} 74 \times {10^9} \times \varepsilon ,\\ \;\;\;\;\;\sigma \le 109.02 \times {10^6}{\rm{Pa}}\\ 100.72 \times {10^6} \times {\left( {1 + 734.7{\varepsilon _p}} \right)^{0.268}},\\ \;\;\;\;\;\sigma > 109.02 \times {10^6}{\rm{Pa}} \end{array} \right. $ | (15) |
式中:σ为应力,ε为应变。
图 6为采用能量法和O-P法计算的本构关系对比,可以看到,二种方法在弹性区有明显的差别。刚进入屈服阶段时,二者屈服应力相差较小。但是随着应变的增加,应力差距逐渐扩大,塑性阶段的关系逐渐离散。由此表明Pile-up现象对塑性变形较大材料的本构关系有着明显的影响,尤其是塑性发展后期阶段。
4 有限元模拟利用商用有限元软件ABAQUS进行数值模拟,纳米压痕测试中压头压入材料的过程是一个典型的轴对称问题,由于轴对称问题算法速度较快,且精度符合要求,因此可以选择轴对称模型模拟纳米压痕过程[11-13]。试验中采用的是Berkovich压头,为了减少建模复杂程度,根据等效面积法,将其简化为半锥角为70.3°的圆锥压头[14-16]。
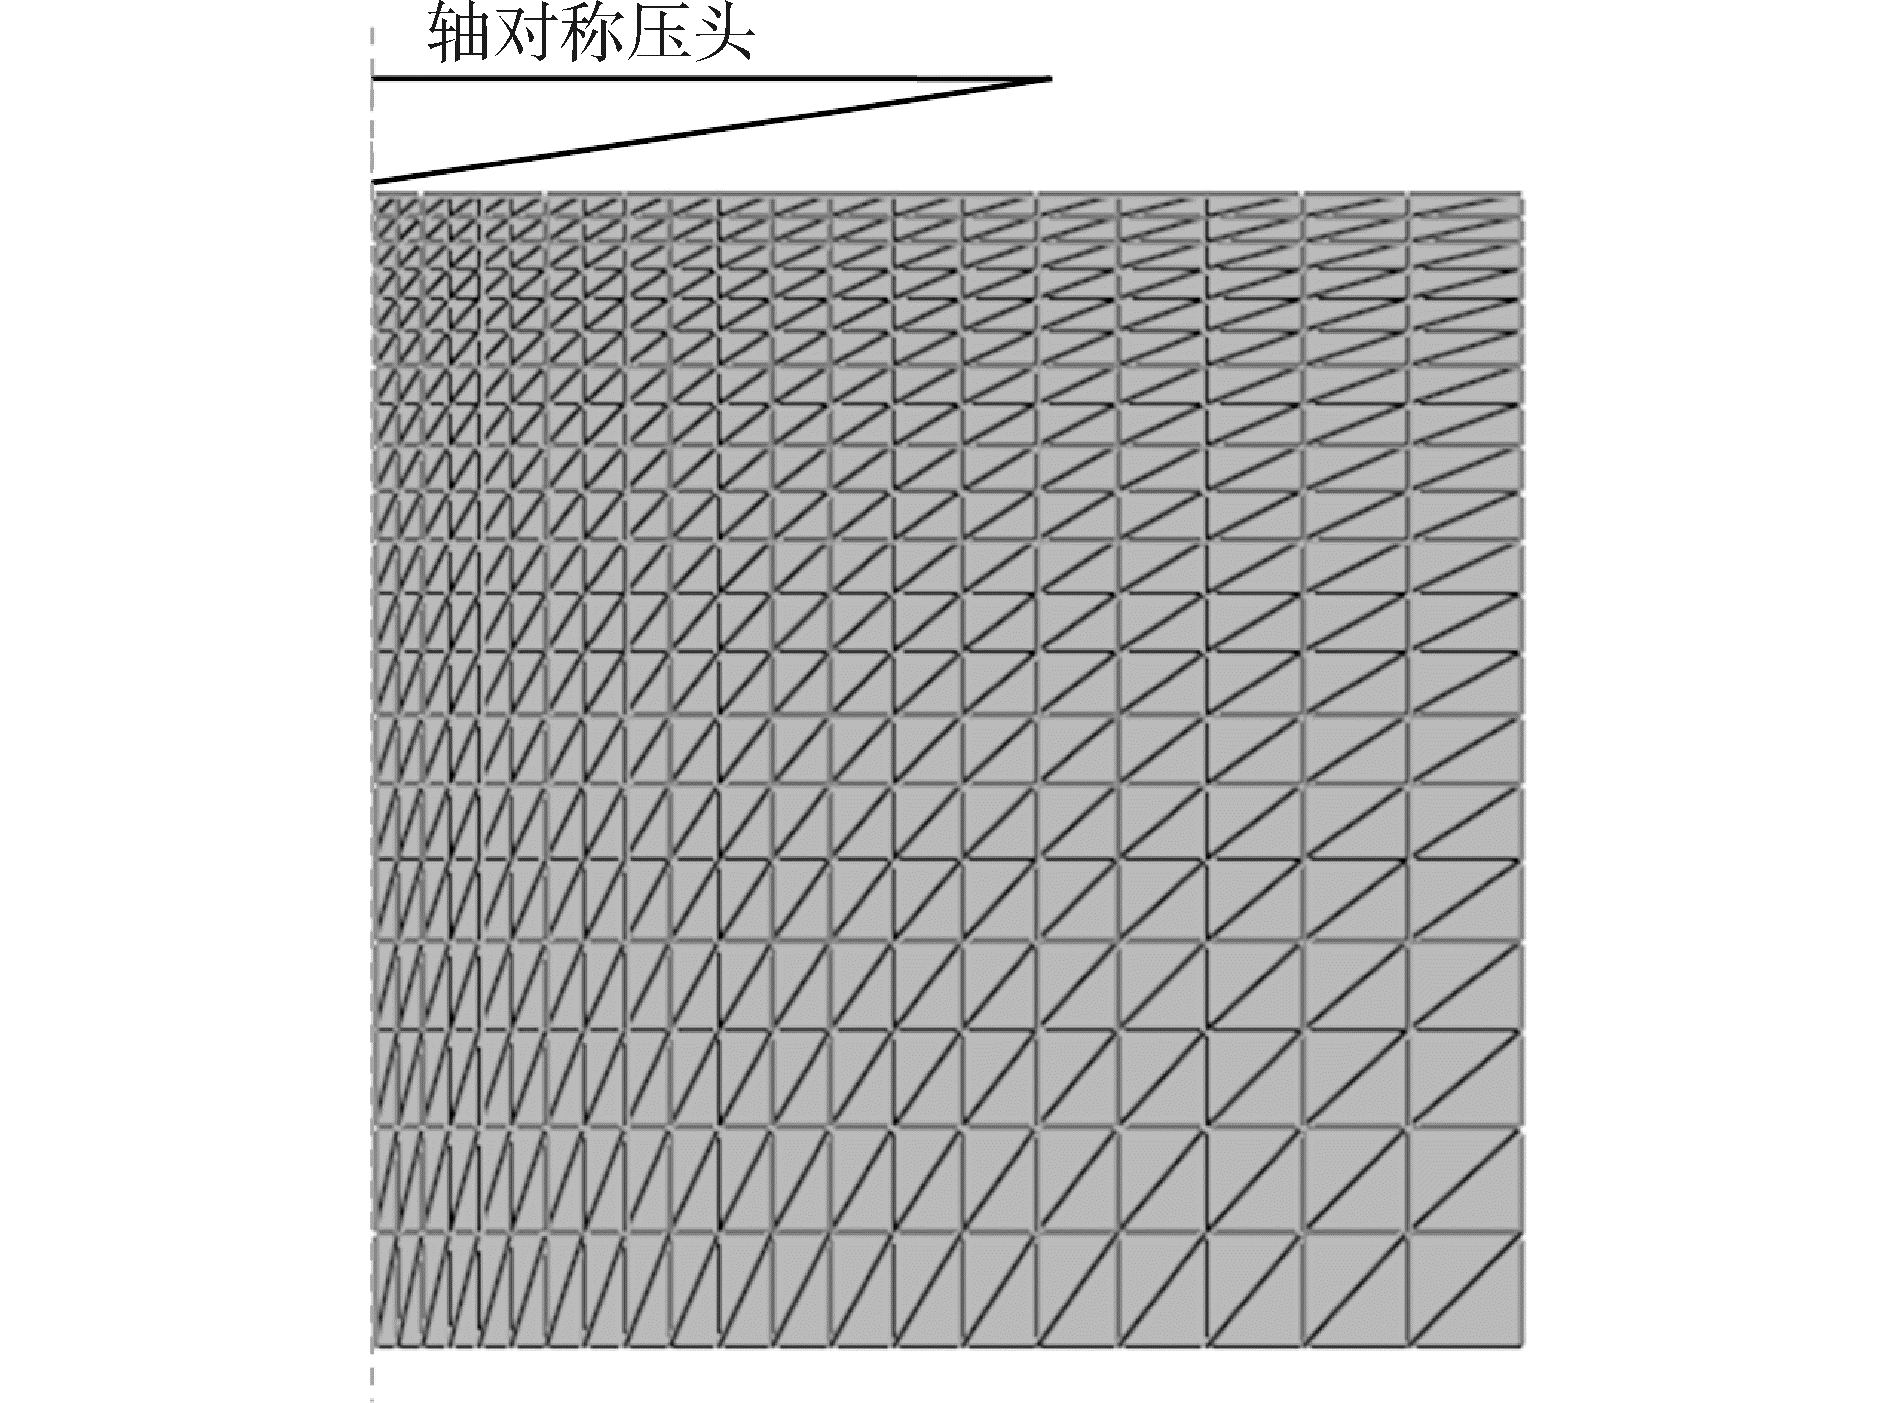
根据圣维南原理,被测材料的变形区集中在压头附近,远处的应力和应变趋近于零,因此,可以取局部材料分析[17-18]。最大压入深度为2 000 nm,因此建模中采用20 000 nm×20 000 nm的模型,大于实验中最大压痕深度的10倍,可消除模型底部约束对压痕分析过程的影响,不考虑基底效应[19-22]。压头简化为解析刚体,靠近压头尖端区域网格进行细化,单元类型为CAX3,网格划分见图 7。在模型底部施加竖直方向约束,左侧对称轴上施加轴对称约束,对压头采用位移控制加载方式,约束其水平方向移动和转动,使其只能沿着垂直方向运动。将上节得到的两种应力应变关系带入有限元模型中,得出纳米压痕仿真下的载荷-位移曲线。
|
Download:
|
| 图 7 有限元模型网格图 Fig. 7 The mesh diagram for finite element model | |
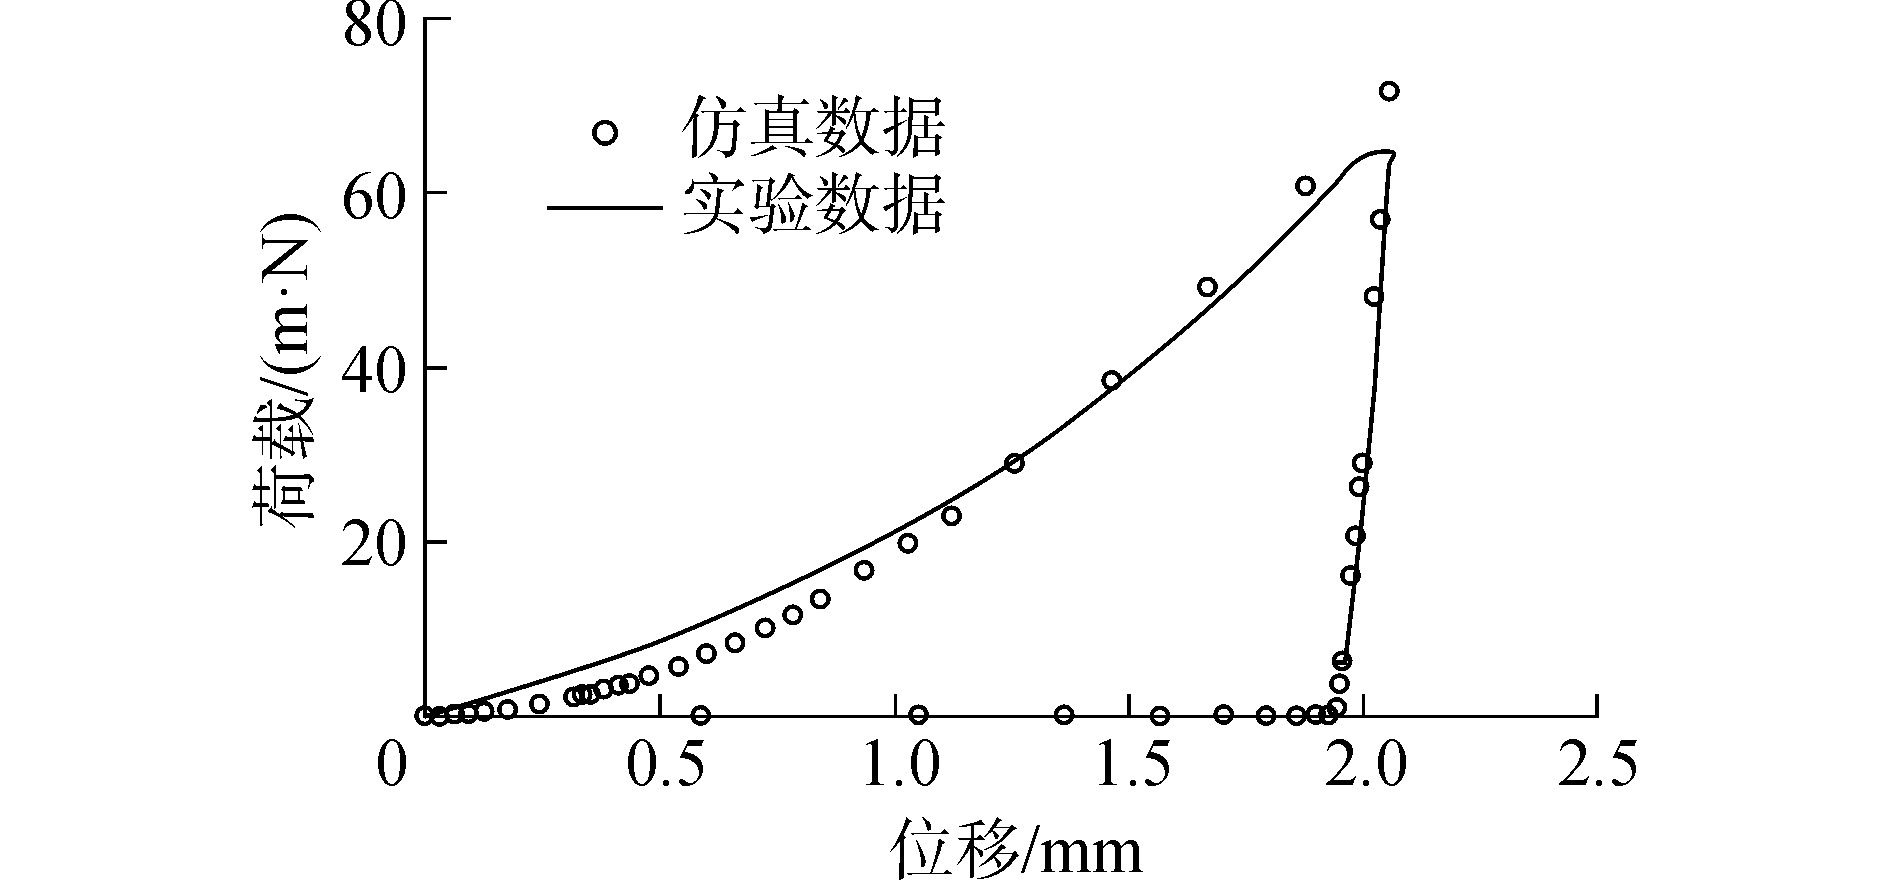
由图 8可以看出,采用能量法得出的数据进行本构关系反演模拟,所得到荷载-位移曲线与实验所测曲线拟合较好。在纳米压痕测试初期,压头压入深度较浅时,仿真曲线与实验曲线有一定的偏差。这是由于压入深度较浅时,压头会受到表面粗糙度、表面效应等因素的综合影响。随着压入深度的增加,仿真所得荷载-位移曲线与实测曲线保持较小误差,验证了纳米压痕数值模拟的有效性。
|
Download:
|
| 图 8 实验与仿真曲线对比 Fig. 8 Experimental versus computational indentation responses | |
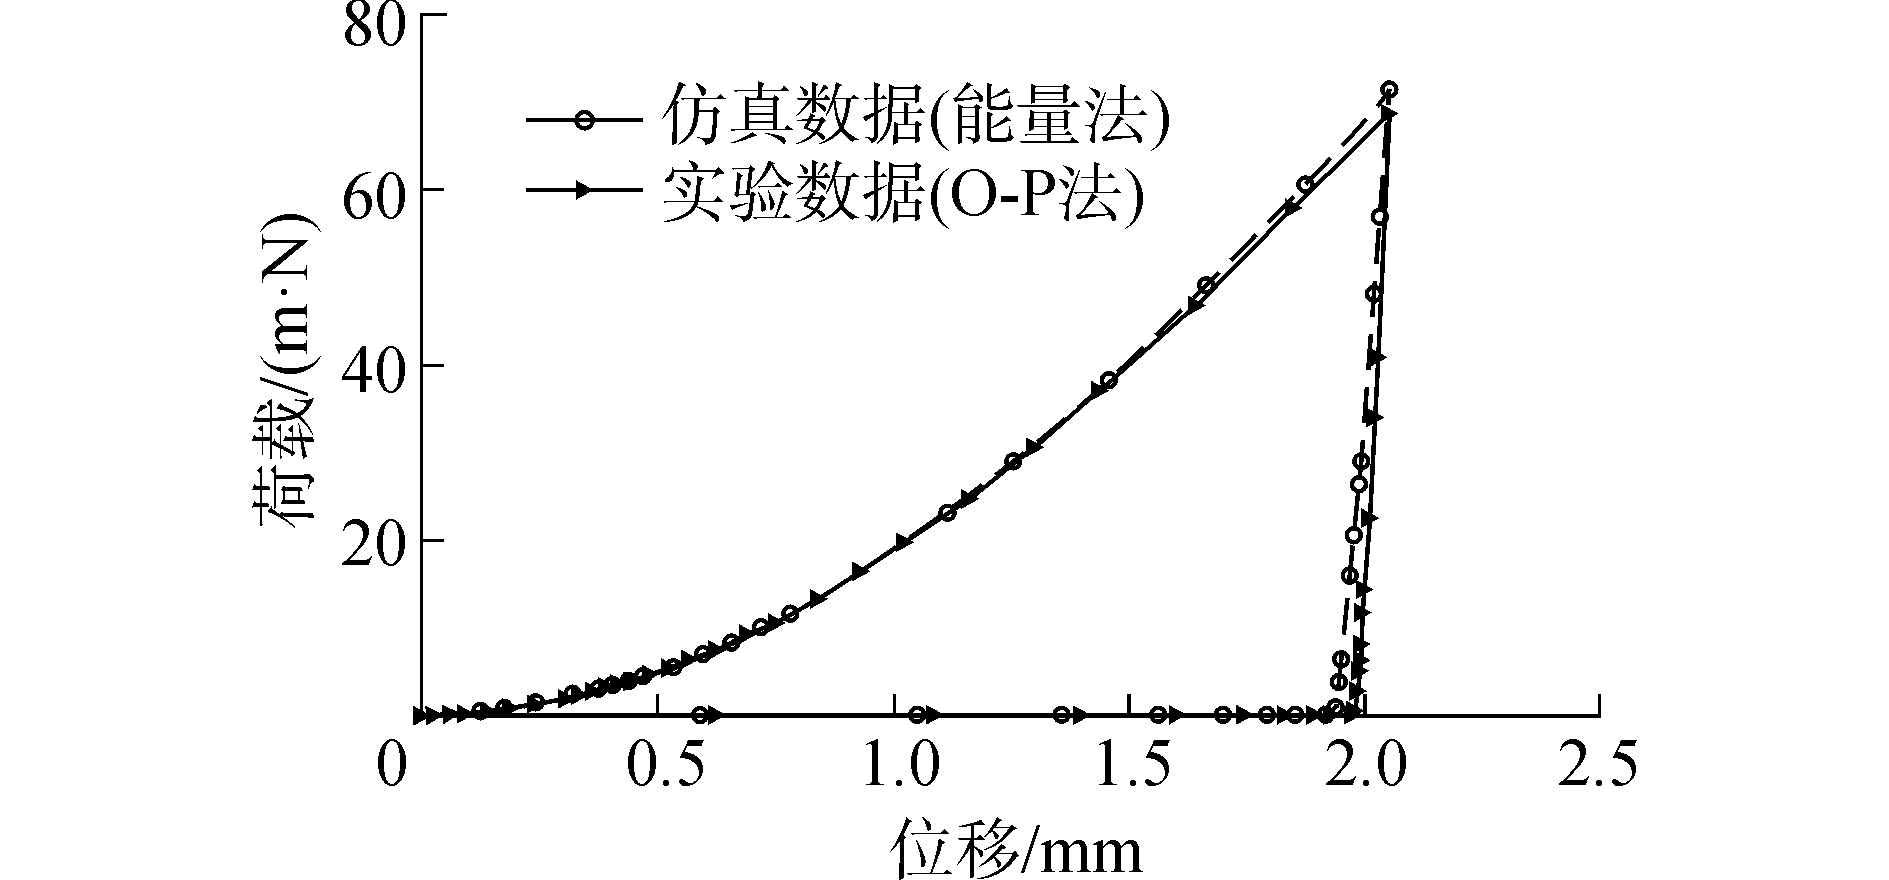
图 9为利用能量法和O-P法两种计算结果进行的反演模拟,通过荷载-位移曲线对比可以看出,两种方法虽然在加载曲线中基本保持一致,但是在卸载过程中,两种方法相差较大,曲线随着卸载深度的增大而逐渐离散,得到的残余压痕深度与最大压入深度的比值(hf/hm)截然不同,差距较大,验证了反演计算结果。因此,对于hf/hm > 0.7的塑性变形明显的材料而言,不能直接采用O-P法得出的弹性模量进行本构关系反演计算,应该利用能量法计算等其他方法去修正,避免Pile-up现象对本构方程计算的影响。
|
Download:
|
| 图 9 两种方法的仿真曲线对比 Fig. 9 Curve comparison between two methods | |
1) 利用能量法和O-P两种方法,通过对5种不同材料的纳米压痕实验结果分析,得出Pile-up现象对塑性变形较大的材料(hf/hm > 0.7)影响明显,利用商用O-P法测量误差较大,达到20%以上,应采用能量法等其他方法来修正。
2) 采用极限分析法对塑性变形较大材料(选取材料铝为例)进行本构关系反演计算,通过对比是否考虑Pile-up现象情况下的应力应变关系,指出Pile-up现象对材料的弹性和塑性计算均有影响。
3) 建立有限元模型对纳米压痕过程进行模拟,通过实验与仿真曲线的对比,证明了本文提出的Pile-up现象对材料本构关系反演计算的影响,并给出了纳米压痕测试中考虑Pile-up现象影响的条件以及反演分析的计算方法,为进一步的理论研究和实际应用提供参考。
| [1] |
OLIVER W C, PHARR G M. An improved technique for determining hardness and elastic modulus using load and displacement sensing indentation experiments[J]. Journal of materials research, 1992, 7(6): 1564-1583. DOI:10.1557/JMR.1992.1564 (  0) 0)
|
| [2] |
OLIVER W C, PHARR G M. Measurement of hardness and elastic modulus by instrumented indentation:advances in understanding and refinements to methodology[J]. Journal of materials research, 2004, 19(1): 3-20. DOI:10.1557/jmr.2004.19.1.3 (  0) 0)
|
| [3] |
HERBERT E G, TENHAEFF W E, DUDNEY N J, et al. Mechanical characterization of LiPON films using nanoindentation[J]. Thin solid films, 2011, 520(1): 413-418. DOI:10.1016/j.tsf.2011.07.068 (  0) 0)
|
| [4] |
DAO M, CHOLLACOOP N, VAN VLIET K J, et al. Computational modeling of the forward and reverse problems in instrumented sharp indentation[J]. Acta materialia, 2001, 49(19): 3899-3918. DOI:10.1016/S1359-6454(01)00295-6 (  0) 0)
|
| [5] |
ANTUNES J M, FERNANDES J V, MENEZES L F, et al. A new approach for reverse analyses in depth-sensing indentation using numerical simulation[J]. Acta materialia, 2007, 55(1): 69-81. DOI:10.1016/j.actamat.2006.08.019 (  0) 0)
|
| [6] |
LIAO Yanguo, ZHOU Yichun, HUANG Yongli, et al. Measuring elastic-plastic properties of thin films on elastic-plastic substrates by sharp indentation[J]. Mechanics of materials, 2009, 41(3): 308-318. DOI:10.1016/j.mechmat.2008.10.008 (  0) 0)
|
| [7] |
OGASAWARA N, CHIBA N, CHEN Xi. Representative strain of indentation analysis[J]. Journal of materials research, 2005, 20(8): 2225-2234. DOI:10.1557/JMR.2005.0280 (  0) 0)
|
| [8] |
OGASAWARA N, CHIBA N, CHEN Xi. Limit analysis-based approach to determine the material plastic properties with conical indentation[J]. Journal of materials research, 2006, 21(4): 947-957. DOI:10.1557/jmr.2006.0108 (  0) 0)
|
| [9] |
BOLSHAKOV A, PHARR G M. Influences of pileup on the measurement of mechanical properties by load and depth sensing indentation techniques[J]. Journal of materials research, 1998, 13(4): 1049-1058. DOI:10.1557/JMR.1998.0146 (  0) 0)
|
| [10] |
CHENG Y T, CHENG Chemin. Scaling, dimensional analysis, and indentation measurements[J]. Materials science and engineering:R:reports, 2004, 44(4/5): 91-149. (  0) 0)
|
| [11] |
BENNETT K C, BERLA L A, NIX W D, et al. Instrumented nanoindentation and 3D mechanistic modeling of a shale at multiple scales[J]. Acta geotechnica, 2015, 10(1): 1-14. (  0) 0)
|
| [12] |
WU D, JANG J S C, NIEH T G. Elastic and plastic deformations in a high entropy alloy investigated using a nanoindentation method[J]. Intermetallics, 2016(68): 118-127. (  0) 0)
|
| [13] |
PATHAK S, KALIDINDI S R. Spherical nanoindentation stress-strain curves[J]. Materials science and engineering:R:Reports, 2015(91): 1-36. (  0) 0)
|
| [14] |
CAO Yanping, QIAN Xiuqing, LU Jian. On the determination of reduced Young's modulus and hardness of elastoplastic materials using a single sharp indenter[J]. Journal of materials research, 2006, 21(1): 215-224. DOI:10.1557/jmr.2006.0018 (  0) 0)
|
| [15] |
YU Chang, YANG Rong, FENG Yihui, et al. Relationships between the work recovery ratio of indentation and plastic parameters for instrumented spherical indentation[J]. MRS communications, 2015, 5(1): 89-94. DOI:10.1557/mrc.2015.10 (  0) 0)
|
| [16] |
MA Z S, ZHOU Y C, LONG S G, et al. On the intrinsic hardness of a metallic film/substrate system:Indentation size and substrate effects[J]. International journal of plasticity, 2012, 34: 1-11. DOI:10.1016/j.ijplas.2012.01.001 (  0) 0)
|
| [17] |
HAN F, TANG B, KOU H, et al. Experiments and crystal plasticity finite element simulations of nanoindentation on Ti-6Al-4V alloy[J]. Materials science and engineering:A, 2015(625): 28-35. (  0) 0)
|
| [18] |
张泰华. 微/纳米力学测试技术及其应用[M]. 北京: 机械工业出版社, 2005: 8-23.
(  0) 0)
|
| [19] |
KANG S K, KIM Y C, KIM K H, et al. Constitutive equations optimized for determining strengths of metallic alloys[J]. Mechanics of materials, 2014, 73: 51-57. DOI:10.1016/j.mechmat.2014.01.010 (  0) 0)
|
| [20] |
PÖHL F, HUTH S, THEISEN W. Indentation of self-similar indenters:an FEM-assisted energy-based analysis[J]. Journal of the mechanics and physics of solids, 2014, 66: 32-41. DOI:10.1016/j.jmps.2014.02.002 (  0) 0)
|
| [21] |
HYUN H C, KIM M, LEE J H, et al. A dual conical indentation technique based on FEA solutions for property evaluation[J]. Mechanics of materials, 2011, 43(6): 313-331. DOI:10.1016/j.mechmat.2011.03.003 (  0) 0)
|
| [22] |
ZHAO Manhong, XIANG Yong, XU J, et al. Determining mechanical properties of thin films from the loading curve of nanoindentation testing[J]. Thin solid films, 2008, 516(21): 7571-7580. DOI:10.1016/j.tsf.2008.03.018 (  0) 0)
|
 2018, Vol. 39


