

|
收稿日期: 2018-06-08; 预印本: 2018-10-19
基金项目: 国家重点研发计划(编号:2018YFB0504900,2018YFB0504902);气象行业专项(编号:GYHY201206002);“万人计划”领军人才(编号:187)
第一作者简介: 张淼,女,1985年生,助理研究员,研究方向为微波遥感及应用。E-mail:zhangmiao@cma.gov.cn
通信作者简介: 陆其峰,男,1975年生,研究员,研究方向为气象卫星资料同化、卫星探测资料观测系统偏差诊断、订正及卫星观测系统性能优化。E-mail:luqf@cma.gov.cn
|
摘要
风云三号(FY-3)的微波成像仪(MWRI)能够全天候获取全球大气水汽含量、云雨参数及海面温度等的空间分布,并可为数值天气预报提供初始场信息进而提高天气预报的准确性。但FY-3C MWRI O-B(O是卫星观测亮温,B是数值天气预报模式模拟亮温)偏差结果存在较大升降轨差异,严重制约了遥感信息的正确提取以及在数值天气预报模式中的业务同化应用。本文通过分析定标方程各参数:定标黑体物理温度、热反射镜背瓣亮温、热反射镜物理温度、冷空反射镜物理温度、接收通道温度、黑体观测计数值、冷空观测计数值、定标斜率、定标截距,并对定标方程各项进行敏感性分析,找出了引起MWRI升降轨偏差的主要原因是热反射镜的发射率异常增大引起的。经过不断调整MWRI的热反射镜发射率,使升轨O-B与降轨O-B的概率分布逐渐重合,初步估算了热反射镜发射率。本文的订正方法可指导未来仪器的发展,并为直接同化MWRI辐射数据提供了条件。
关键词
遥感, 风云三号(FY-3), 微波成像仪, 定标, 升降轨偏差
Abstract
The Microwave Radiometer Imager (MWRI) onboard FY-3C satellites was successfully launched on December 23, 2013. MWRI observes the Earth’s atmosphere and surface at 10.65, 18.7, 23.8, 36.5, and 89.0 GHz with dual polarization and can provide an important initial field for Numerical Weather Prediction (NWP). However, the O-B (observation minus simulation) of MWRI shows a clear bias difference between ascending and descending orbits. The magnitude of this ascending–descending bias is approximately 2 K for all channels, thereby restricting its operational application in NWP data assimilation systems. This research analyzes the causes of the bias and makes appropriate corrections. The parameters of the calibration equation were analyzed, including physical temperature of the warm load, brightness temperature of the hot reflector’s back-lobe, physical temperature of the hot reflector, physical temperature of the cold reflector, receiver channel instrument temperature, warm load radiometric counts, cold space radiometric counts, antenna brightness temperature calibration scale, antenna brightness temperature calibration offset, and a sensitivity analysis of each term of the calibration equation was conducted. Results indicated that high values of the hot load reflector are the main causes of the bias. The reflector was heated periodically by incident solar radiation and emitted a variable radiation with space and time, which caused the ascending–descending bias. Thus, the brightness temperature was simulated using the basic atmospheric parameters of ERA5 in conjunction with the radiative transfer model known as RTTOV. With the principle that the probability density difference between the O-B of ascending and descending orbits is minimum, the emissivity of the hot load reflector is estimated. Results show that before adjusting the emissivity of the hot reflector, the probability density plot of the O-B of ascending and descending orbits was separated. After correction, the bias difference between the ascending and descending orbits were clearly reduced, thereby identifying the main error source of the ascending–descending bias. Such identification can guide the development of future instruments and provide the condition for direct assimilation of MWRI radiance data. Although the accuracy of NWP fields, the radiative transfer model, calibration, and cloud detection are not the main error source of the ascending–descending bias, they may affect the estimation accuracy of the emissivity of the hot load reflector. Thus, strict quality control should be carried out in the future, and after the samples of greater uncertainty are eliminated, more accurate on-orbit emissivity of the hot load reflector can be estimated.
Key words
remote sensing, FY-3C, microwave imager, calibration, difference between the ascending and descending orbits
1 引 言
风云三号(FY-3)系列气象卫星是中国第二代极轨气象卫星(唐世浩 等,2016),微波成像仪(MWRI)是装载于其上的重要遥感仪器(张淼 等,2018),该仪器为全功率双极化微波成像仪,以圆锥方式进行扫描,天线视角45°,幅宽1400 km,扫描周期为1.7 s,在扫描周期内获取6个冷/热源观测数据及254个地球观测数据。
MWRI能够全天候获取全球大气水汽含量、云雨参数及海面温度等的空间分布。通过同化该数据可为数值天气预报提供初始场信息,进而提高天气预报的准确性(卢乃锰 等,2016)。因此准确认识其在轨工作性能、正确评估其数据质量,对于其定量业务同化应用具有重要意义(陆其峰,2011)。通常,对MWRI的在轨精度评价包括两个方面:一是采用模式比对O-B(Lu 等,2011, 2015)(O是卫星观测亮温,B是模式模拟亮温)对MWRI观测亮温偏差特性进行定量评价;二是通过与同类微波仪器时空匹配观测数据交叉比对进行定标精度评价(杨虎 等,2013)。
交叉比对的结果均显示,MWRI具有较好的稳定性及数据质量(黄端 等,2017;王功雪 等,2017),但Lawrence等(2017)利用O-B结果对MWRI亮温偏差进行定量评价时,发现MWRI O-B 偏差存在升降轨差异(FY-3卫星环绕地球运行的示意图如图1所示),升降轨偏差约为2 K。将MWRI资料同化进数值预报模式的一个重要的前提条件是观测资料的偏差必须是无偏的或者全球一致的,因此MWRI的升降轨偏差严重制约了其在数值预报模式中的业务应用。虽然O-B偏差的来源较为复杂,观测与模拟自身都存在误差,但与MWRI具有相似通道的AMSR-2(Advanced Microwave Scanning Radiometer)O-B结果却并不存在该问题,因此该升降轨偏差应与MWRI本身的定标有关(http://www.ecmwf.ine/publications[2018-04-15])。本文主要分析引起MWRI升降轨偏差的主要原因及其订正,为MWRI 的定量及数值预报同化应用奠定基础。


2 数据及其质量控制
2.1 数据介绍
MWRI有5个频率,每个频率都有两个极化模式,具体通道特征见表1。
表 1 MWRI各通道特征
Table 1 Characteristics of MWRI channels
| 中心频率/GHz | |||||
| 10.65 | 18.7 | 23.8 | 36.5 | 89 | |
| 极化方式 | V,H | V,H | V,H | V,H | V,H |
| 带宽/MHz | 180 | 200 | 400 | 900 | 4600 |
| 地面分辨率/km×km | 85×51 | 50×30 | 45×27 | 30×18 | 15×9 |
本文使用的MWRI/L1亮温数据和在轨工程数据(后面简称OBC数据),由国家卫星气象中心业务处理生成,通过国家卫星气象中心风云卫星遥感数据服务网下载(http://satellite.cma.gov.cn/portalsite/default.aspx[2018-08-01])。本文利用ECMWF (European Centre for Medium-range Weather Forecasts)开发的RTTOV(Saunders 等,1999,http://nwpsaf.eu/oldsite/deliverables/rtm/docs_rttov10_svr_1.11.pdf[2018-04-30])(the fast radiative transfer model for TOVS)辐射传输模式模拟观测亮温,该模式利用洋面比辐射率模型FASTEM5(FAST EMissivity model) (http://www.ecmwf.int/publications[2018-08-01])计算洋面比辐射率,并采用参数化的光学厚度计算大气气体吸收。模式输入数据采用ECMWF全球气候再分析资料第5代产品ERA5,水平分辨率为31 km,垂直分辨率为137层,模式层顶达到0.01 hPa。根据微波辐射传输模式需要,选择海表温度、海面压强、10 m风速u和v,2 m温度、2 m湿度及60层的大气温度廓线、大气湿度廓线等参数。
2.2 质量控制
由于受天气条件、下垫面状况等的影响,辐射传输模式模拟亮温可能存在较大误差,因此利用O-B结果进行定量评价前需进行质量控制,剔除受地表、云和雨影响的数据,结合FY-3C MWRI资料数据特征,设计的质控方案如下:
(1)极值检测。MWRI观测亮温阈值为150—350 K,剔除此范围外观测资料。
(2)地表类型检测。利用MWRI海陆模板,选择南北纬50°之间海表数据。
(3)环境条件挑选。利用MWRI 海面风速、降水检测、云中液态水含量及水汽产品,选择海面风速<7 m/s,无降水,云中液态水含量为0,水汽总量<40 mm的数据。
(4)残差检测。剔除视场点中通道的亮温观测模拟偏差大于20 K的数据。
3 MWRI升降轨偏差问题分析
FY-3 MWRI采用天线口面定标法,其特点是高、低温定标信号和测量信号都由天线的主反射面进入,对整个成像仪来说定标信号和测量信号的传输路径完全相同,有助于提高定标的准确度(刘高峰 等,2014)。两个直径为860 mm和1300 mm的准光学反射镜分别安装在热源和冷空观测位置,冷/热定标源的辐射分别通过冷/热反射镜照射到天线反射器上,再进入馈源,从而形成高、低温定标信号,实现两点定标。有关仪器和定标的更多介绍,可参见参考文献(杨虎 等,2013;刘高峰 等,2014;Yang 等,2011)。定标计算过程如下:
(1)计算热定标源辐射亮温(方程各项的物理意义可参见文献(Yang 等,2011)
| $\begin{split} {T_{\rm{BH}}} = & {\eta _{\rm{T}}}{\alpha _{\rm{H}}}( \varepsilon {T_{\rm{H}}}{\eta _{\rm{H}}} + (1 - {\eta _{\rm{H}}}){T_{\rm{EC}}}) + \\ & (1 - {\eta _{\rm{T}}}){T_{\rm{ET}}} + {\eta _{\rm{T}}}(1 - {\alpha _{\rm{H}}}){T_{\rm{hot}}} \end{split}$ | (1) |
(2)计算冷空定标源辐射亮温
| $ {T_{\rm{BC}}} = 2.73 + (1 - {\alpha _{\rm{C}}}){T_{\rm{cold}}} $ | (2) |
(3)计算天线亮温定标斜率
(4)计算天线亮温定标截距
| $ \operatorname{int} cpt = {T_{\rm{BC}}} - gain \cdot spac $ |
(5)计算天线亮温线性相
| $ {T_{\rm{a}}} = BTvolt \cdot gain + \operatorname{int} cpt $ |
(6)计算天线亮温非线性相
| $ \Delta T = U \cdot gai{n^2} \cdot (BTvolt - spac) \cdot (BTvolt - itcnt) $ |
式中,
(7)计算天线最终亮温
计算中用到的各参数来自OBC数据,其定义如表2所示。
表 2 定标参数的定义
Table 2 The definition of calibration parameters
| 参数 | 定义 | 参数 | 定义 | |
| TH | 定标黑体物理温度 | itcnt | 黑体观测计数值 | |
| ε | 定标黑体发射率 | spac | 冷空观测计数值 | |
| αH | 热反射镜的反射率 | Tins | 接收通道温度 | |
| αC | 冷空反射镜的反射率 | BTvolt | 通道接收机自动增益调整电压计数值 | |
| ηH | 黑体效率 | TBH | 热定标源辐射亮温 | |
| TET | 热反射镜背瓣亮温 | TBC | 冷空定标源辐射亮温 | |
| Thot | 热反射镜物理温度 | gain | 天线亮温定标斜率 | |
| Tcold | 冷空反射镜物理温度 | int cpt | 天线亮温定标截距 | |
| ηT | 热反射镜的效率 | TEC | 宇宙背景辐射亮温(2.73 K) |
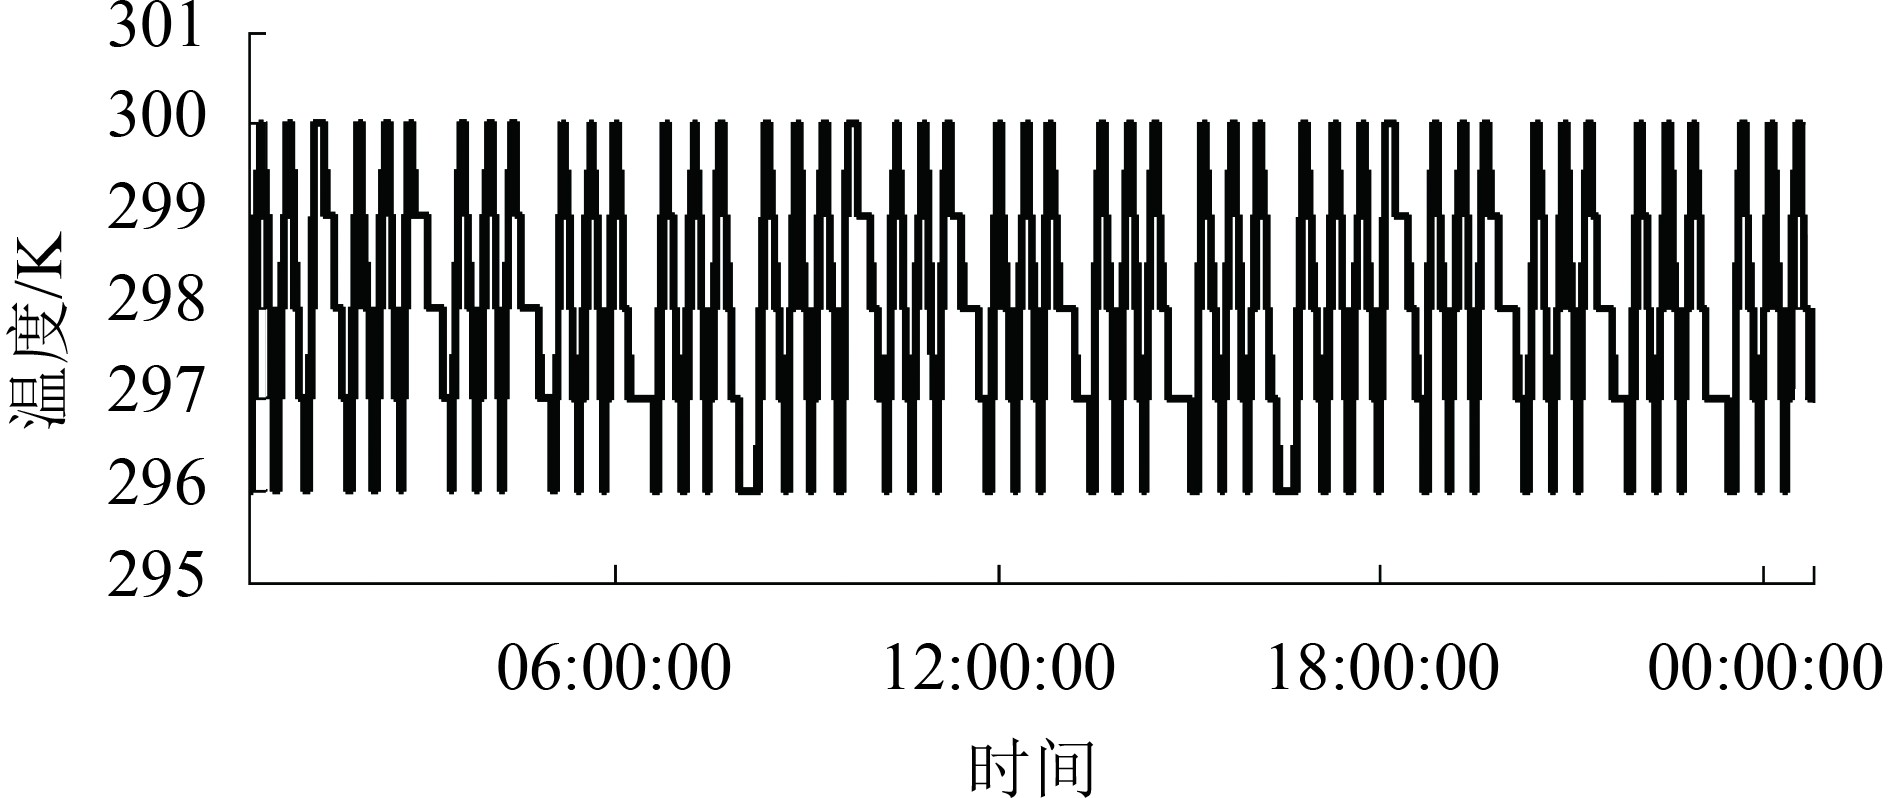
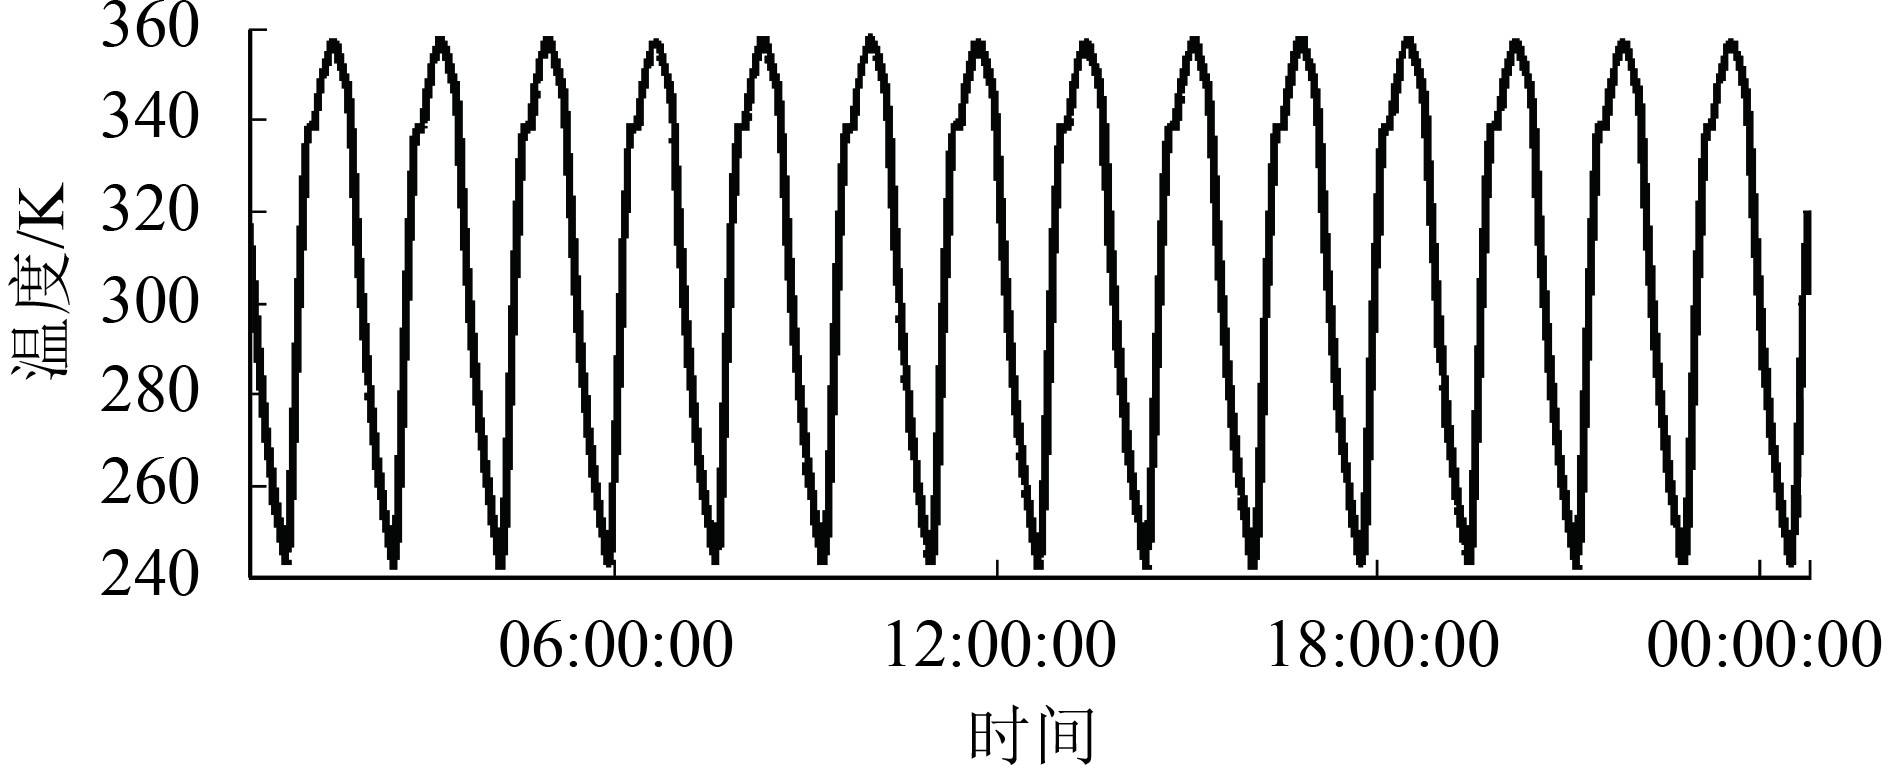
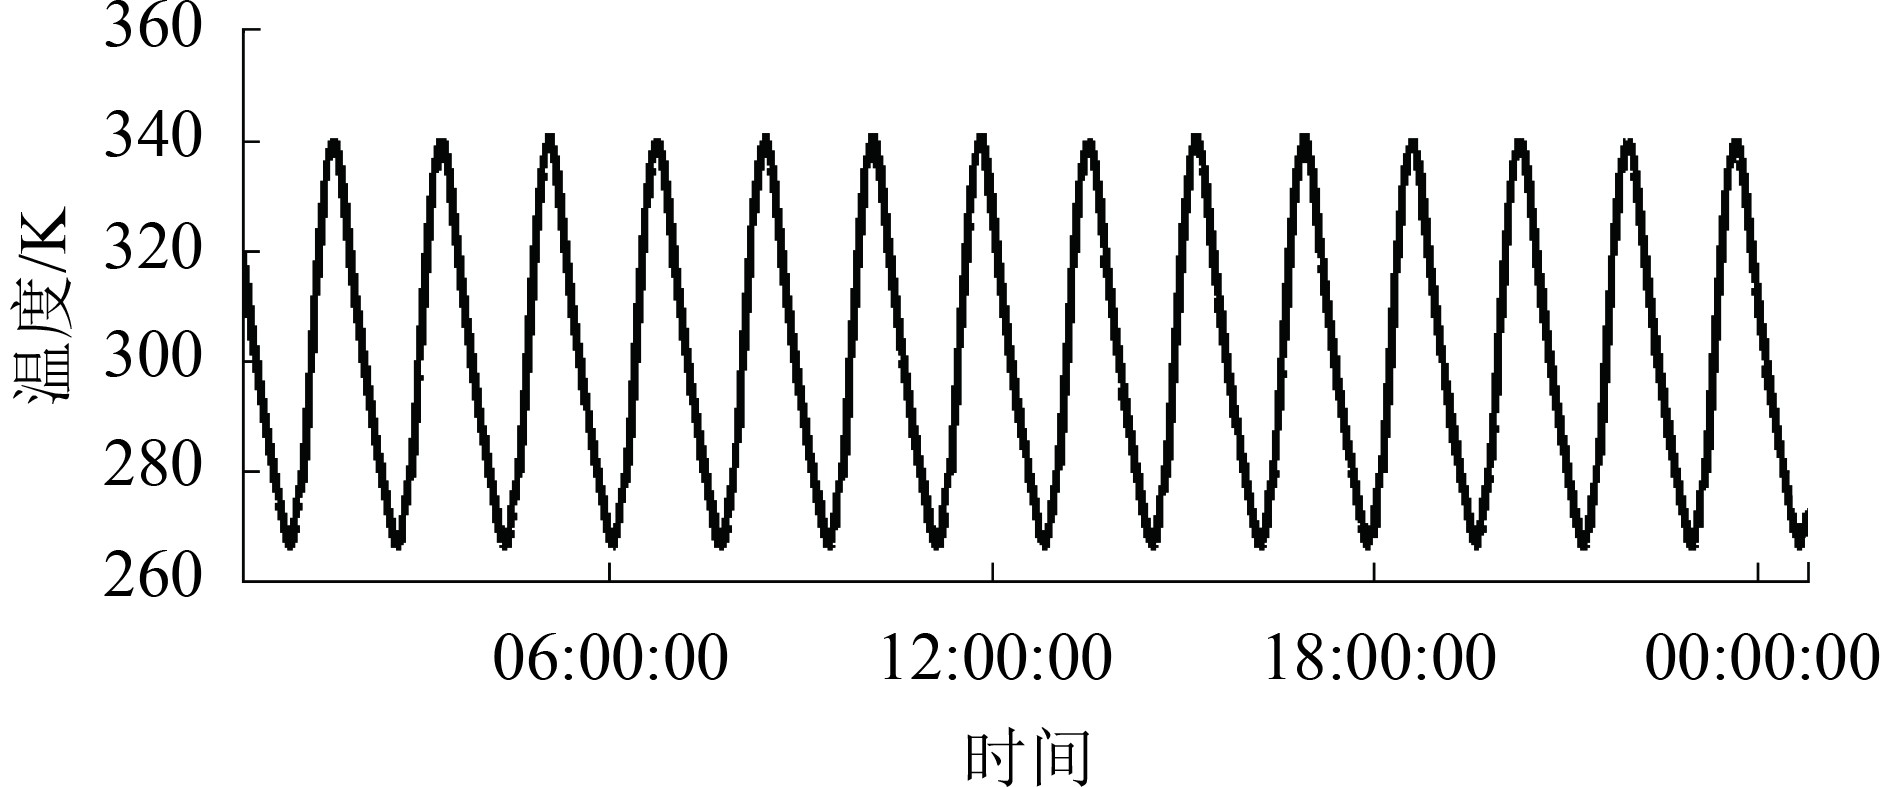
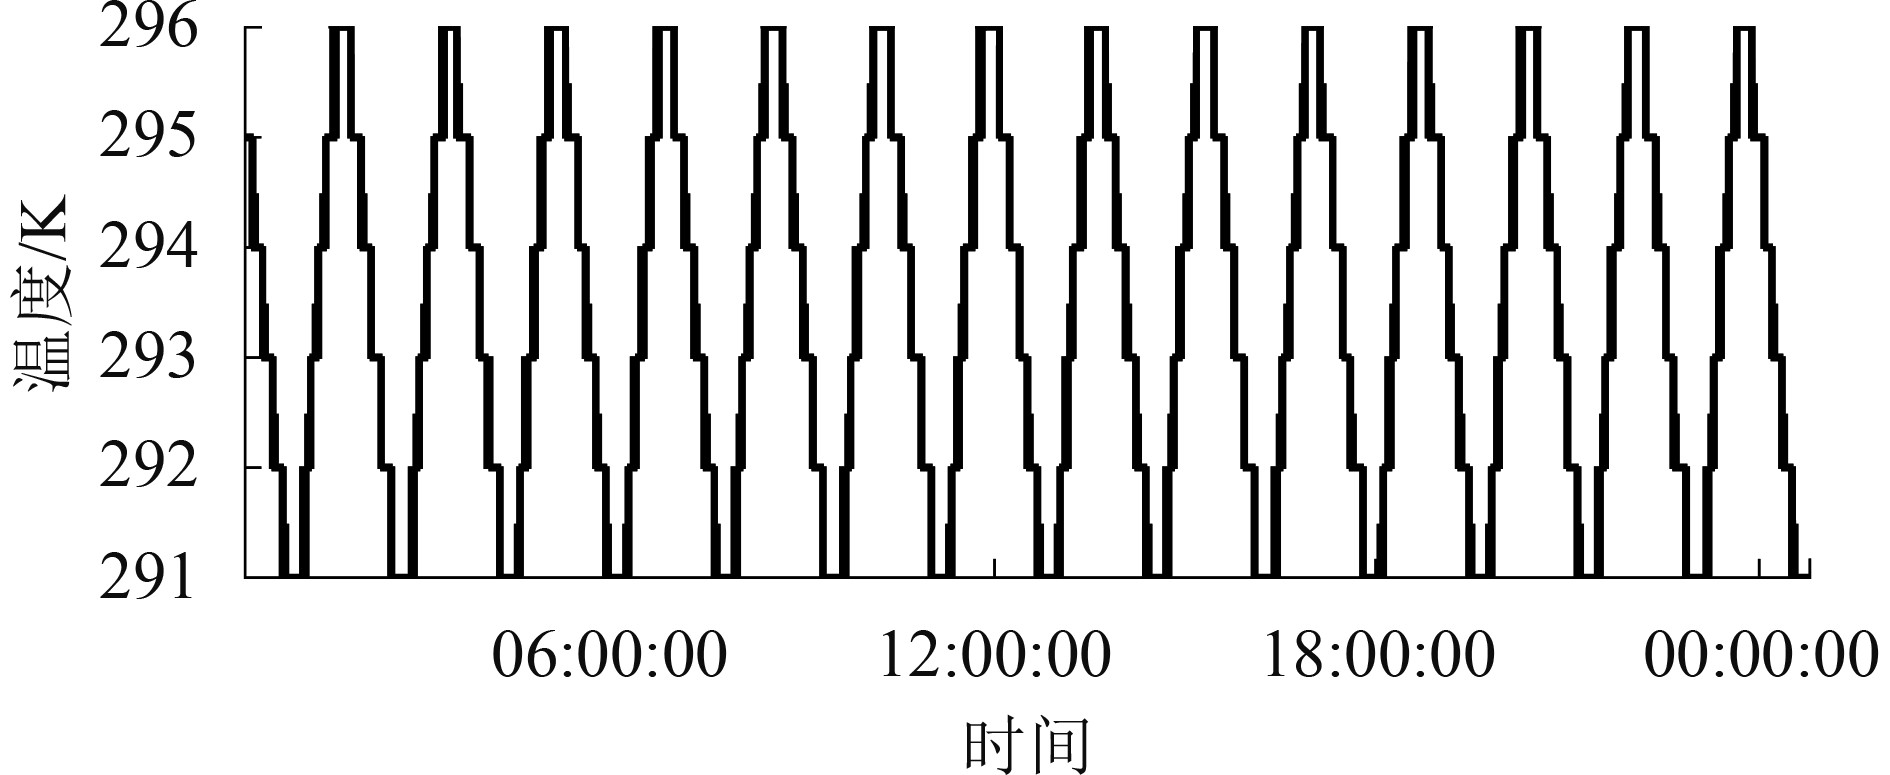
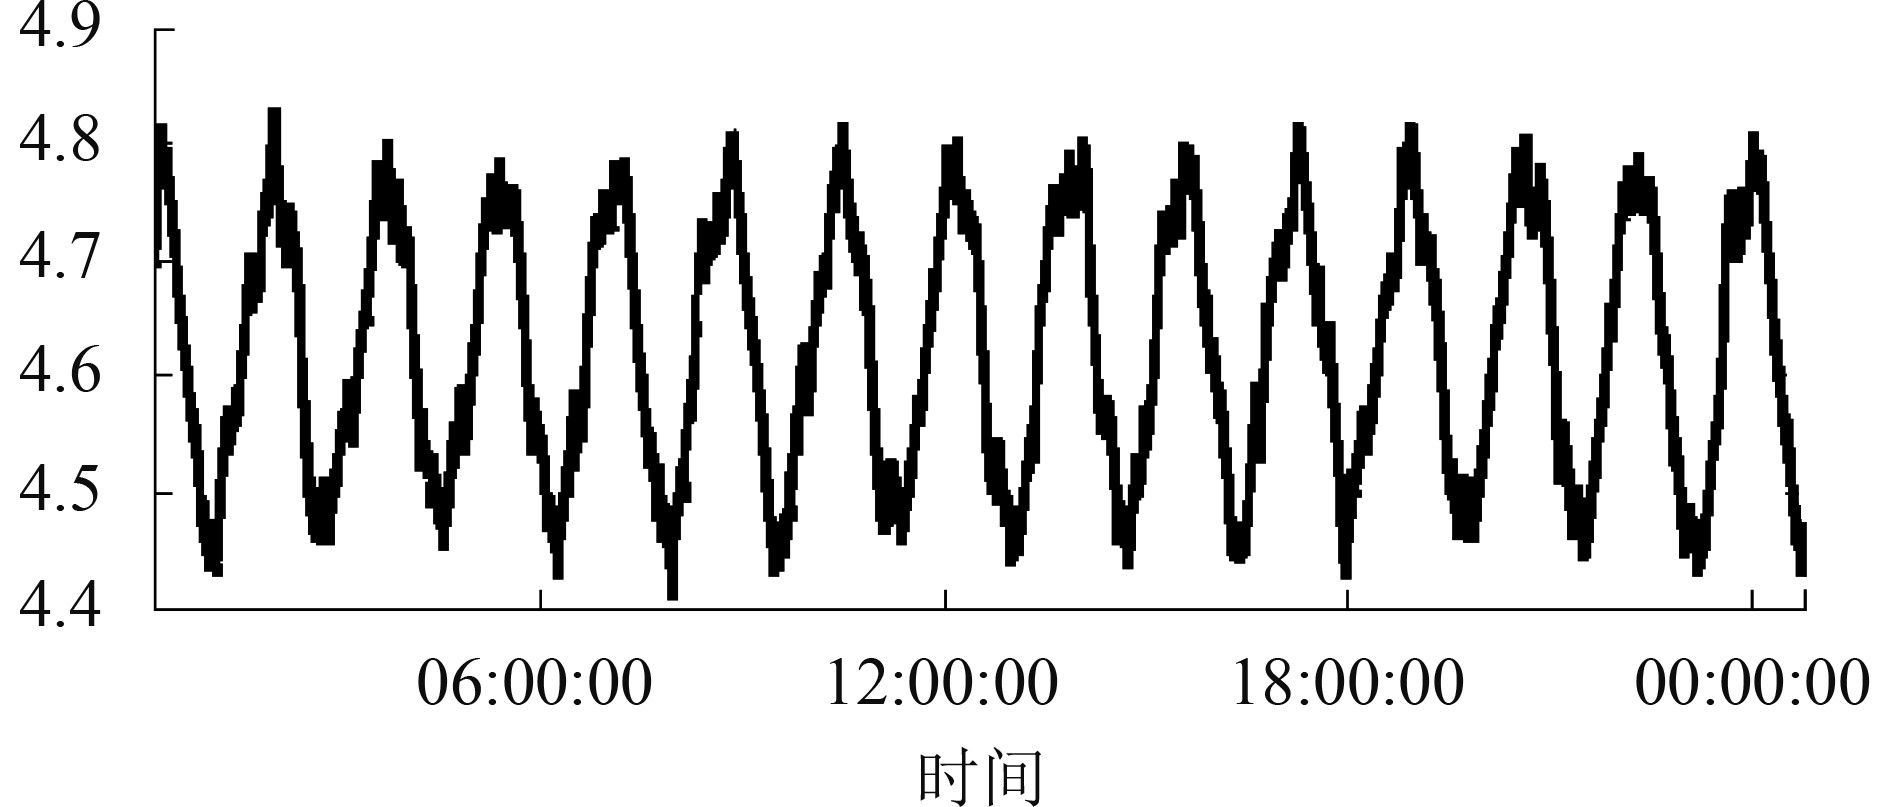
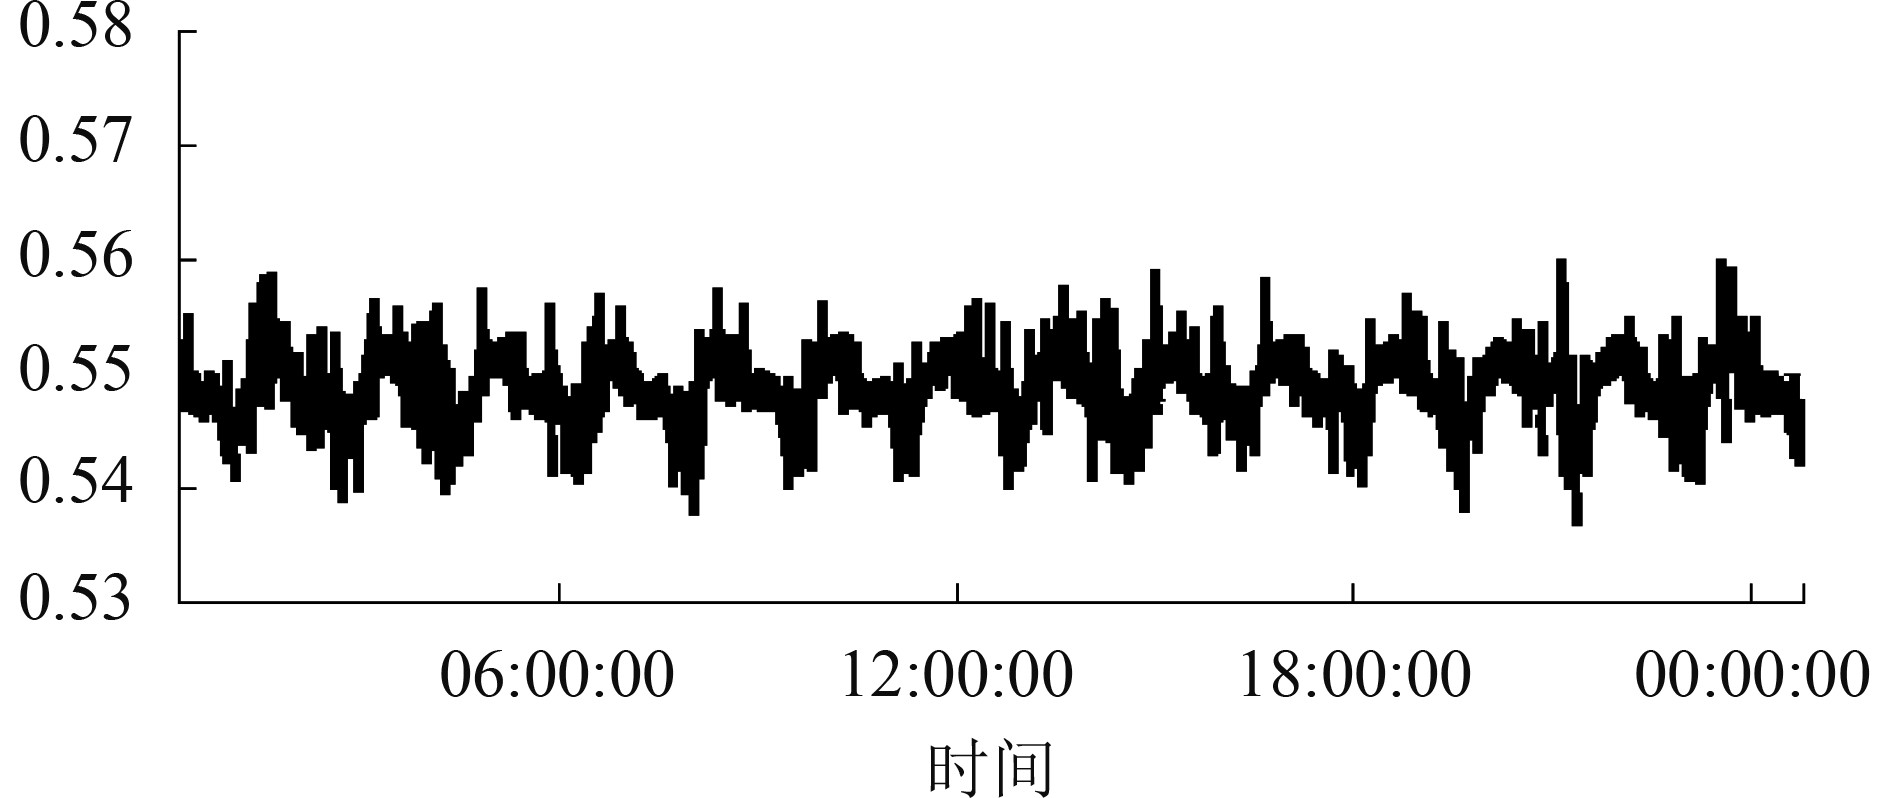
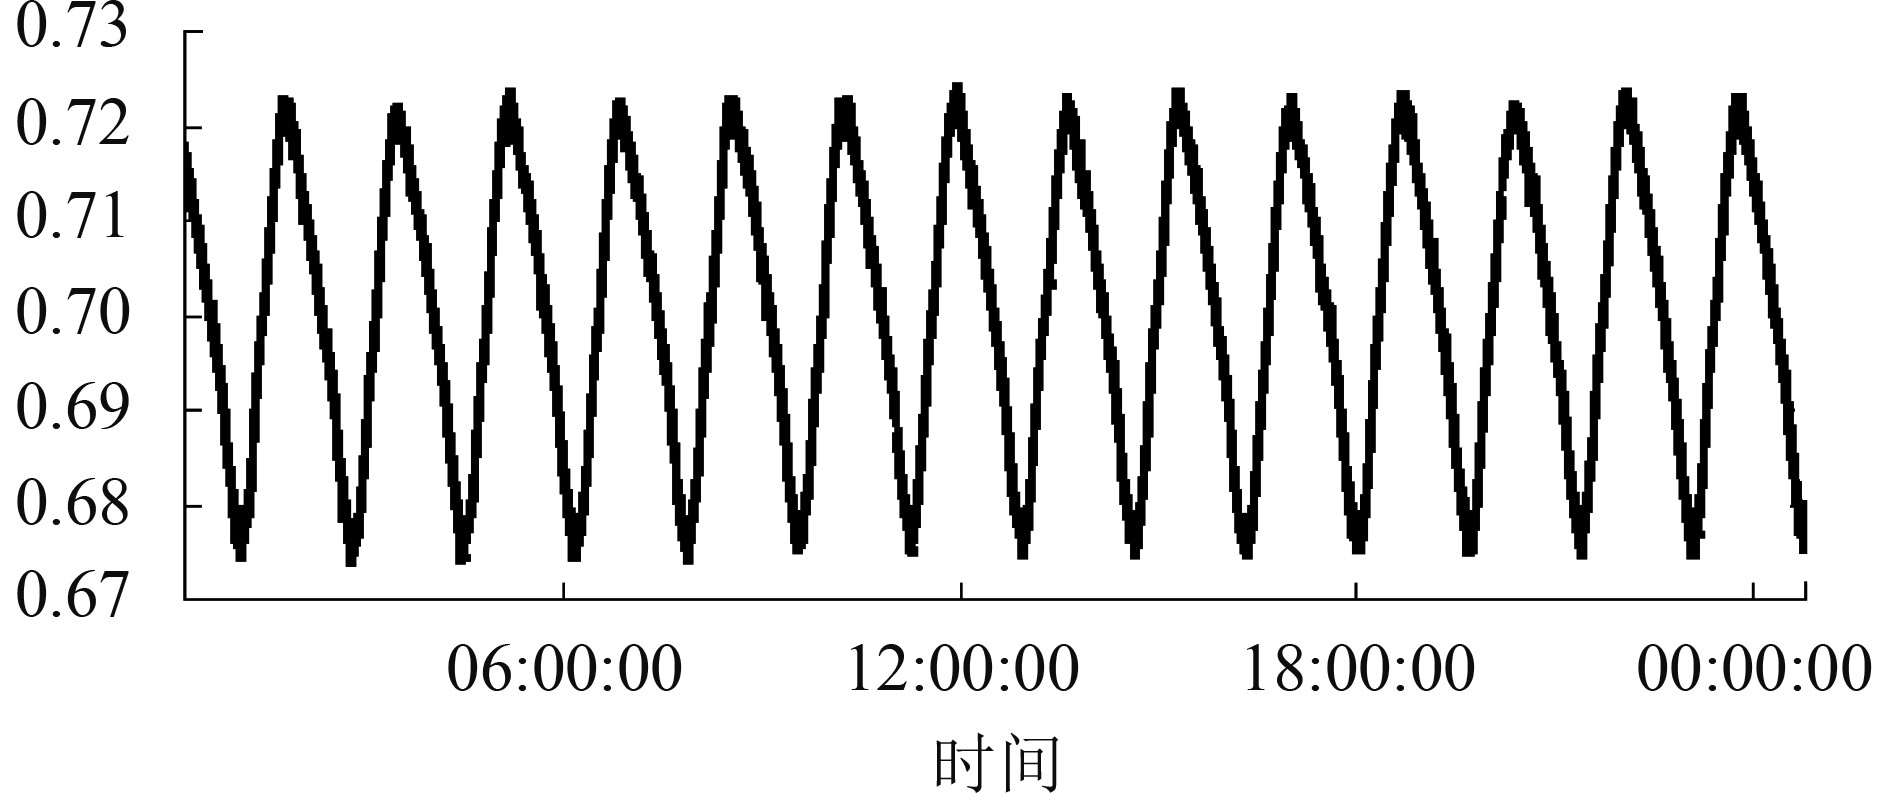
首先分析定标方程各参数,这些参数包括定标黑体物理温度、热反射镜背瓣亮温、热反射镜物理温度、冷空反射镜物理温度、接收通道温度、黑体观测计数值、冷空观测计数值、定标斜率、定标截距。其中,热反射镜背瓣亮温是利用AMSR-E L1数据制作的分升降轨的12个月月平均数据静态文件,不随时间变化,因此首先统计了其升降轨差异,均小于35 K。之后,随机选取2017年6月24日,绘制18.7 GHz垂直极化通道其他参数随时间变化曲线如图2—图9所示,可以看出,由于定标黑体进行了严格的热控,因此黑体温度稳定在296—300 K,升降轨的黑体温度差异小于4 K。接收通道温度稳定在291—296 K,升降轨差异小于5 K。冷空计数值稳定在0.1—0.45,升降轨差异小于0.35。黑体计数值稳定在4.4—4.9,升降轨差异小于0.5。定标斜率稳定在0.53—0.57,升降轨差异小于0.04。定标截距稳定在0.67—0.73,升降轨差异小于0.06。但热反射镜和冷空反射镜的物理温度变化非常剧烈,变化范围分别为240—360 K和260—350 K,升降轨差异分别可达120—90 K。

然后对定标方程各项进行敏感性分析。定标方程中的众多参数都是实验室测量得到的,但卫星发射后受空间环境影响这些参数也可能发生改变,因此下面将分析定标方程各项对这些参数的改变的敏感性。定标方程中
非线性系数由地面真空试验(郭杨 等,2014)获得,a,b,c的值如下:a=[−1.21E−7, −3.26E−7, −6.74E−7, −2.55E−7, −9.34E−8, 5.62E−8, −4.76E−8, −2.26E−7, 1.51E−7, 7.32E−8];b=[7.96E−5, 2.05E−4, 4.10E−4, 1.58E−4, 6.24E−5, −2.73E−5, 3.60E−5, 1.44E−4, −9.16E−5, −4.40E−5];c=[−0.013, −0.032, −0.06, −0.024, −0.010, 0.0032, −0.0066, −0.023, 0.014, 0.0067];由于接受通道温度变化小于5 K,当a,b,c的值分别变化0.1时,
通过上述敏感性分析,找出了影响定标方程不确定性的大项,即式(1)右端第4项
通过文献调研,发现TRMM(Wentz 等,2001)和SSMIS(Kunkee 等,2008;Wessel 等,2008)均存在反射镜的发射率异常增大现象,且估计的TRMM各通道发射率在0.02—0.04,SSMIS 50 GHz附近通道的发射率约为0.025。Skou(1997)指出:当反射镜的反射率非常接近于1时,反射率很难准确测量,且卫星发射后受空间环境影响,在巨大的昼夜温差下,外表涂层有可能产生裂纹,使里面的物质暴露出来,引起发射率异常增大。经与仪器方讨论认为
4 MWRI升降轨偏差订正
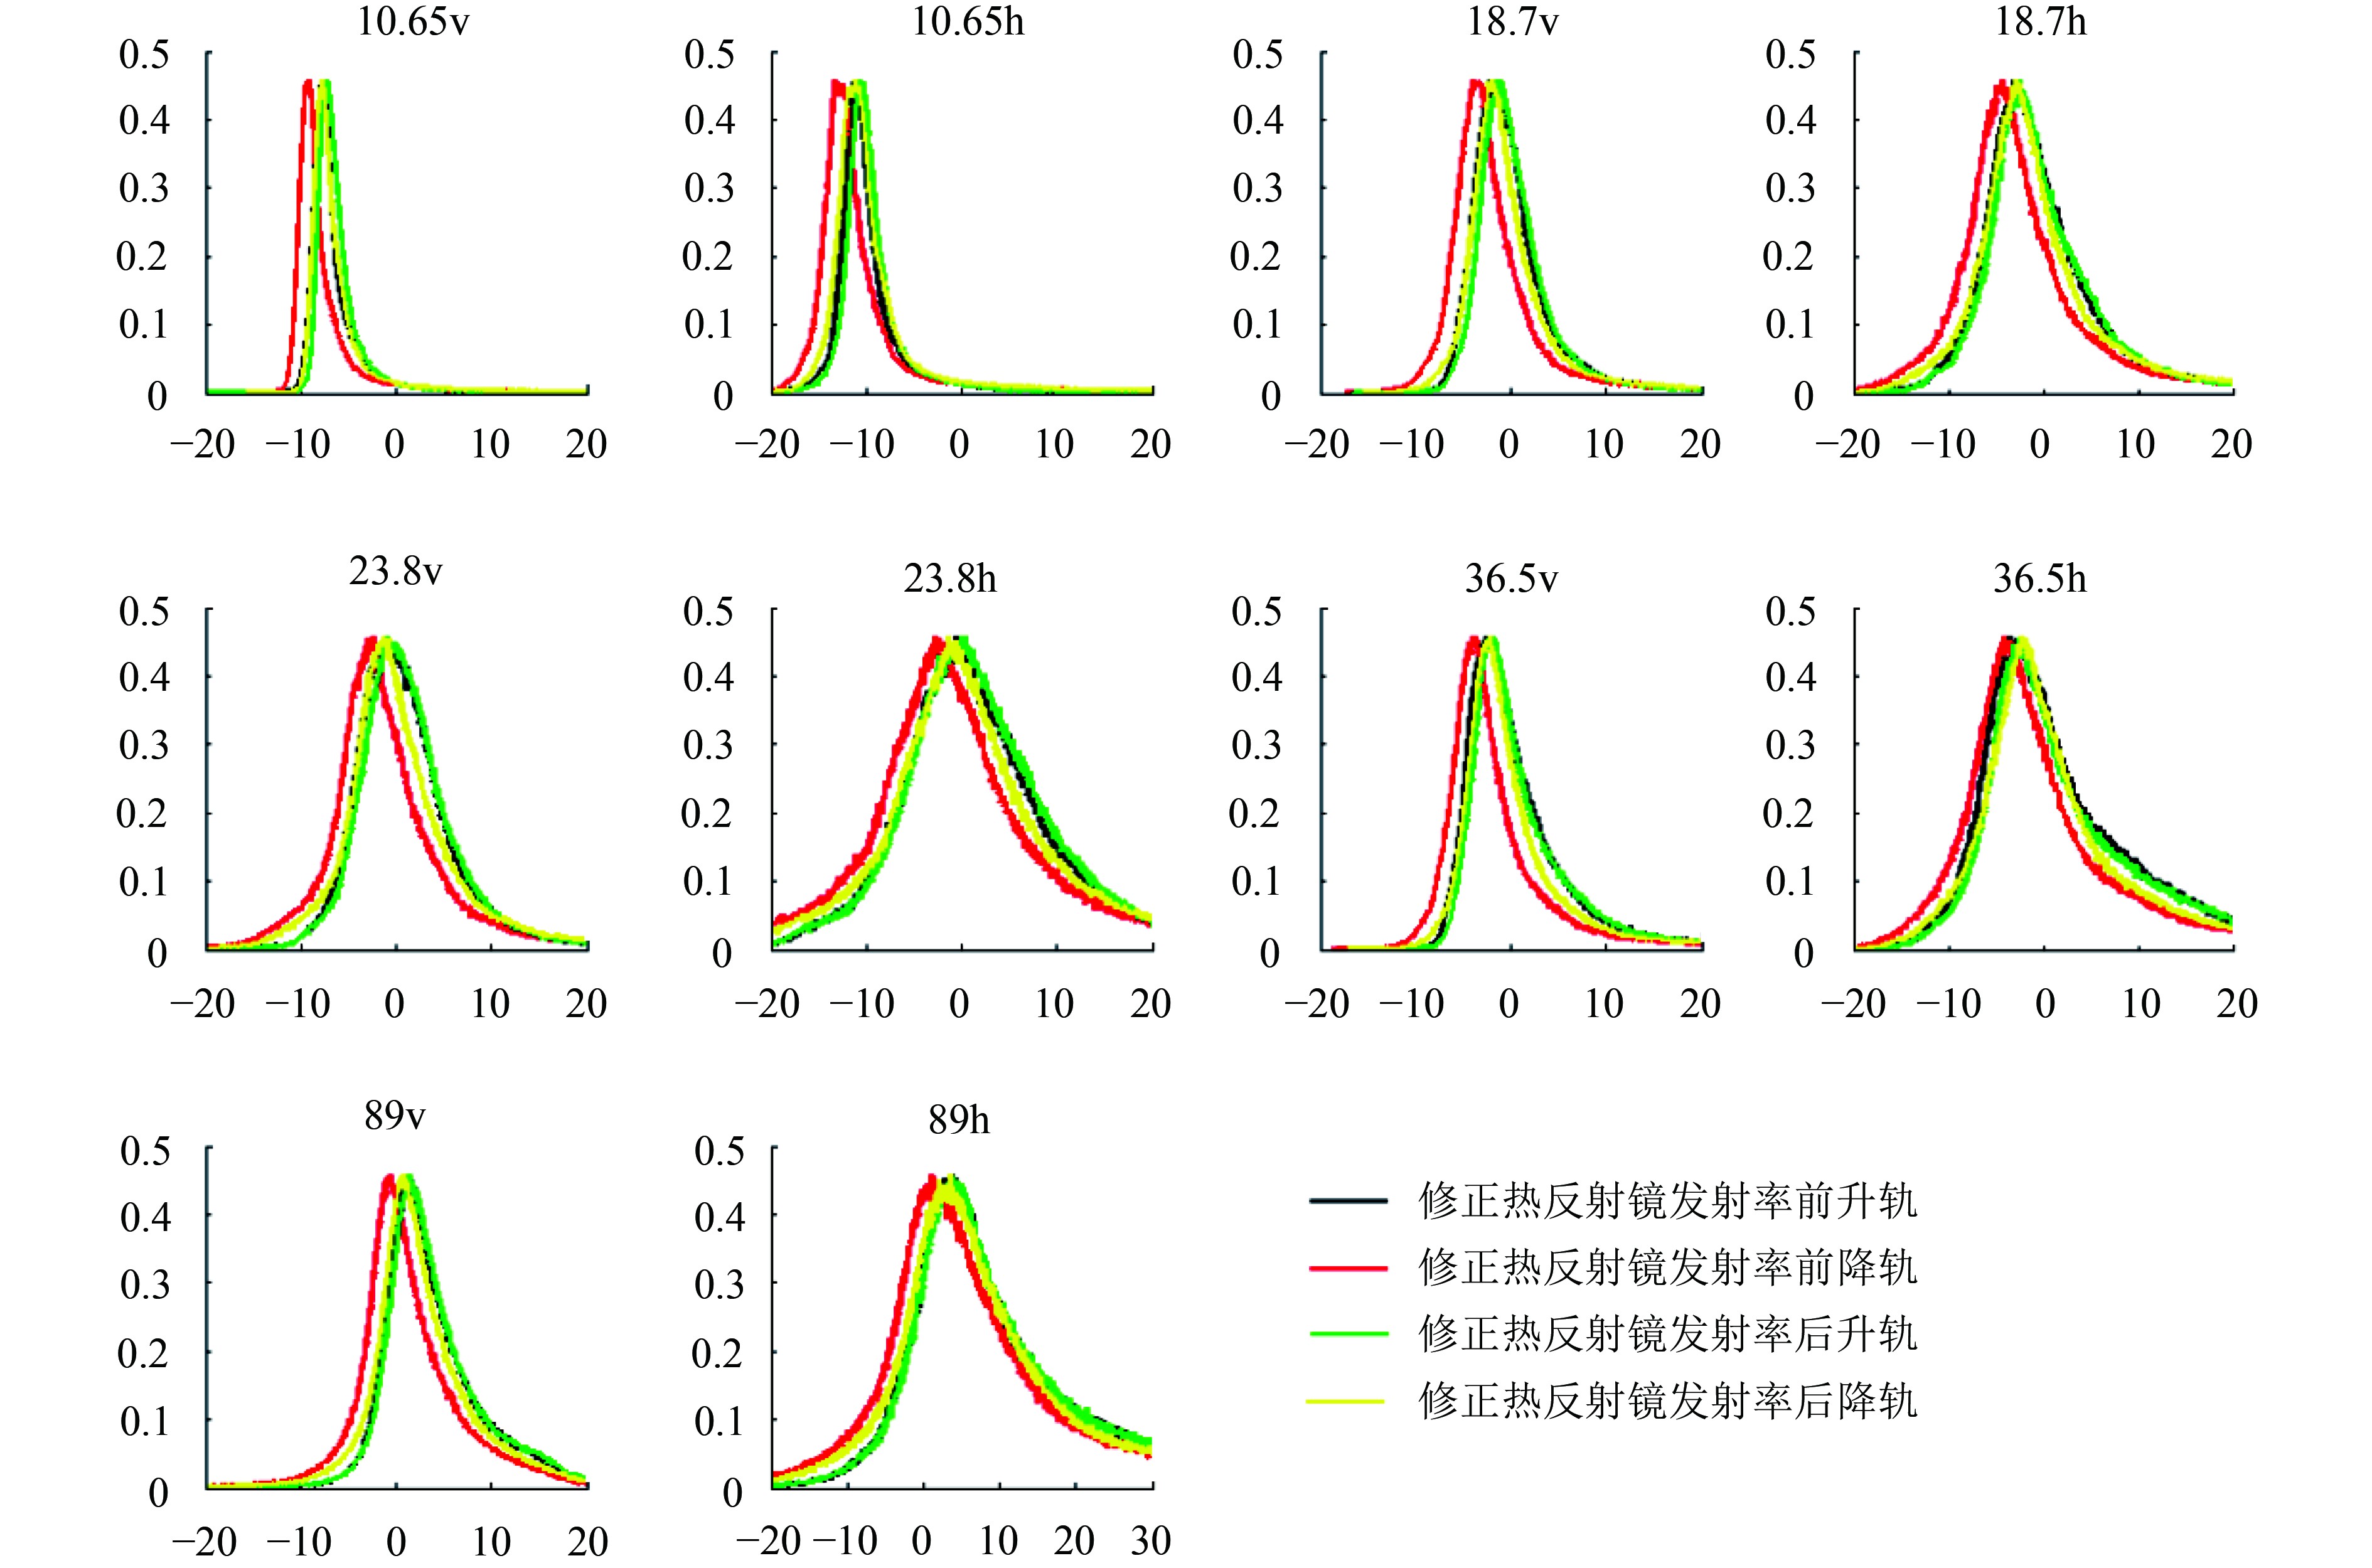
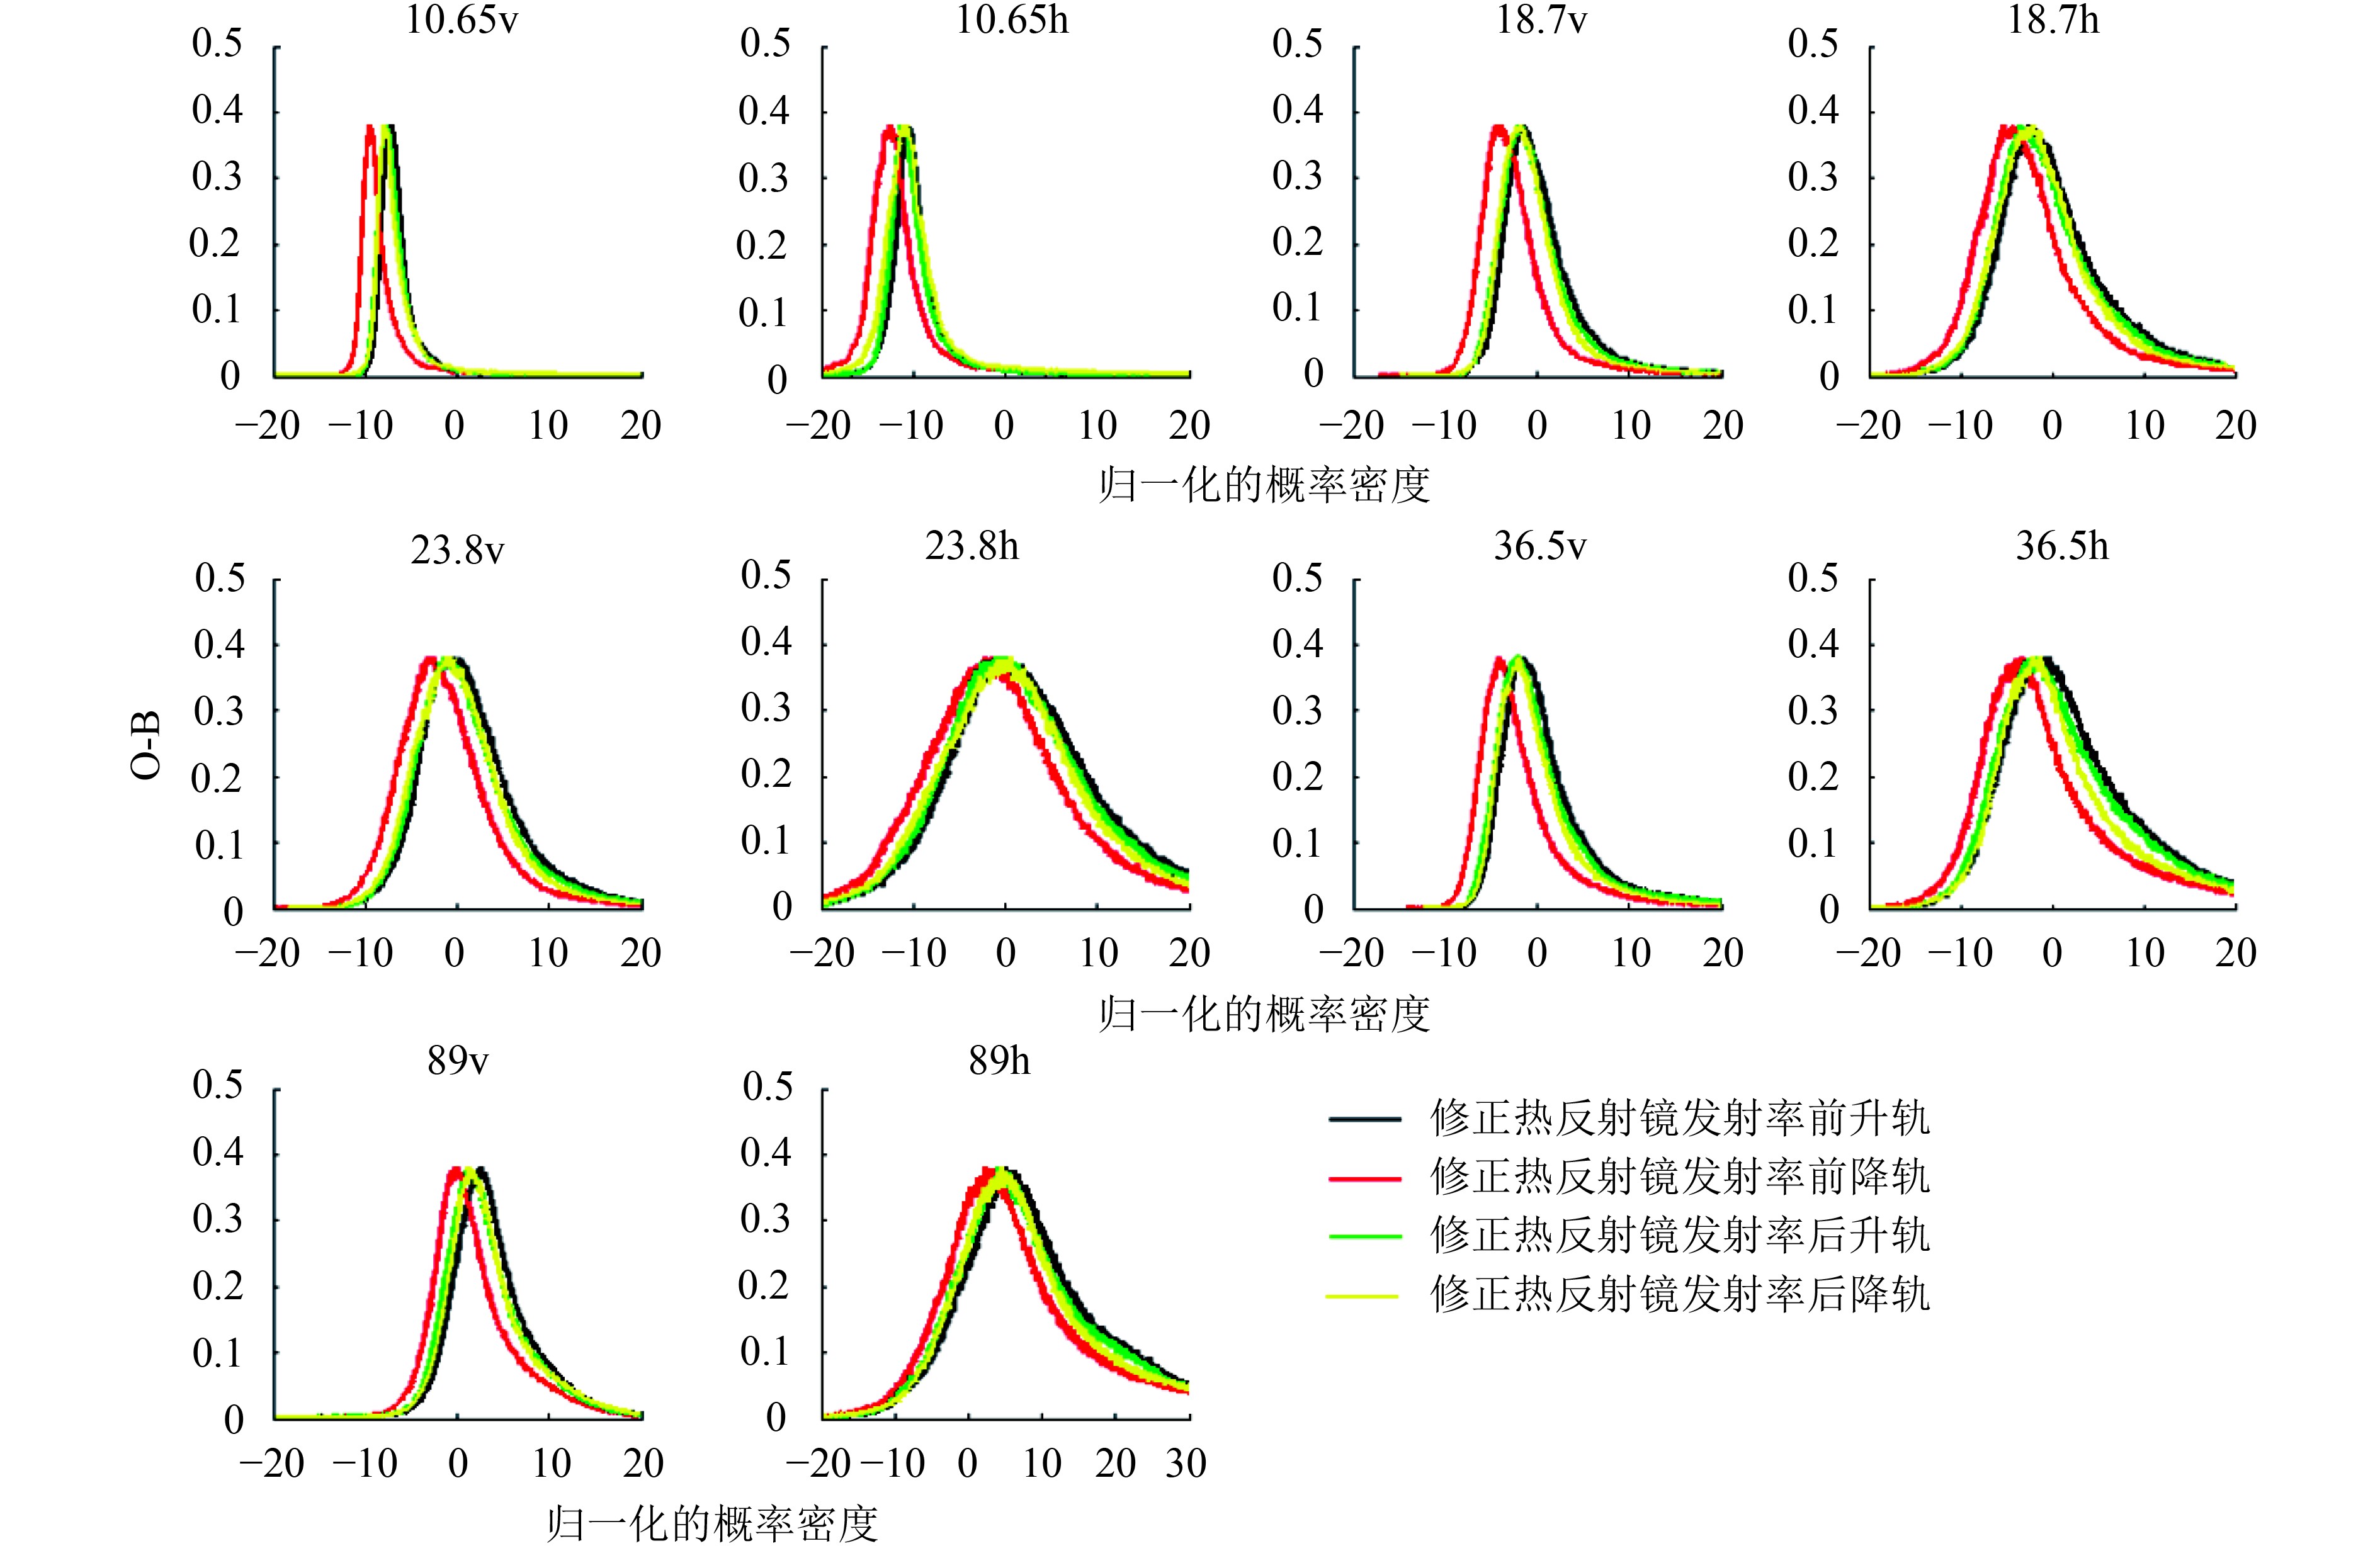
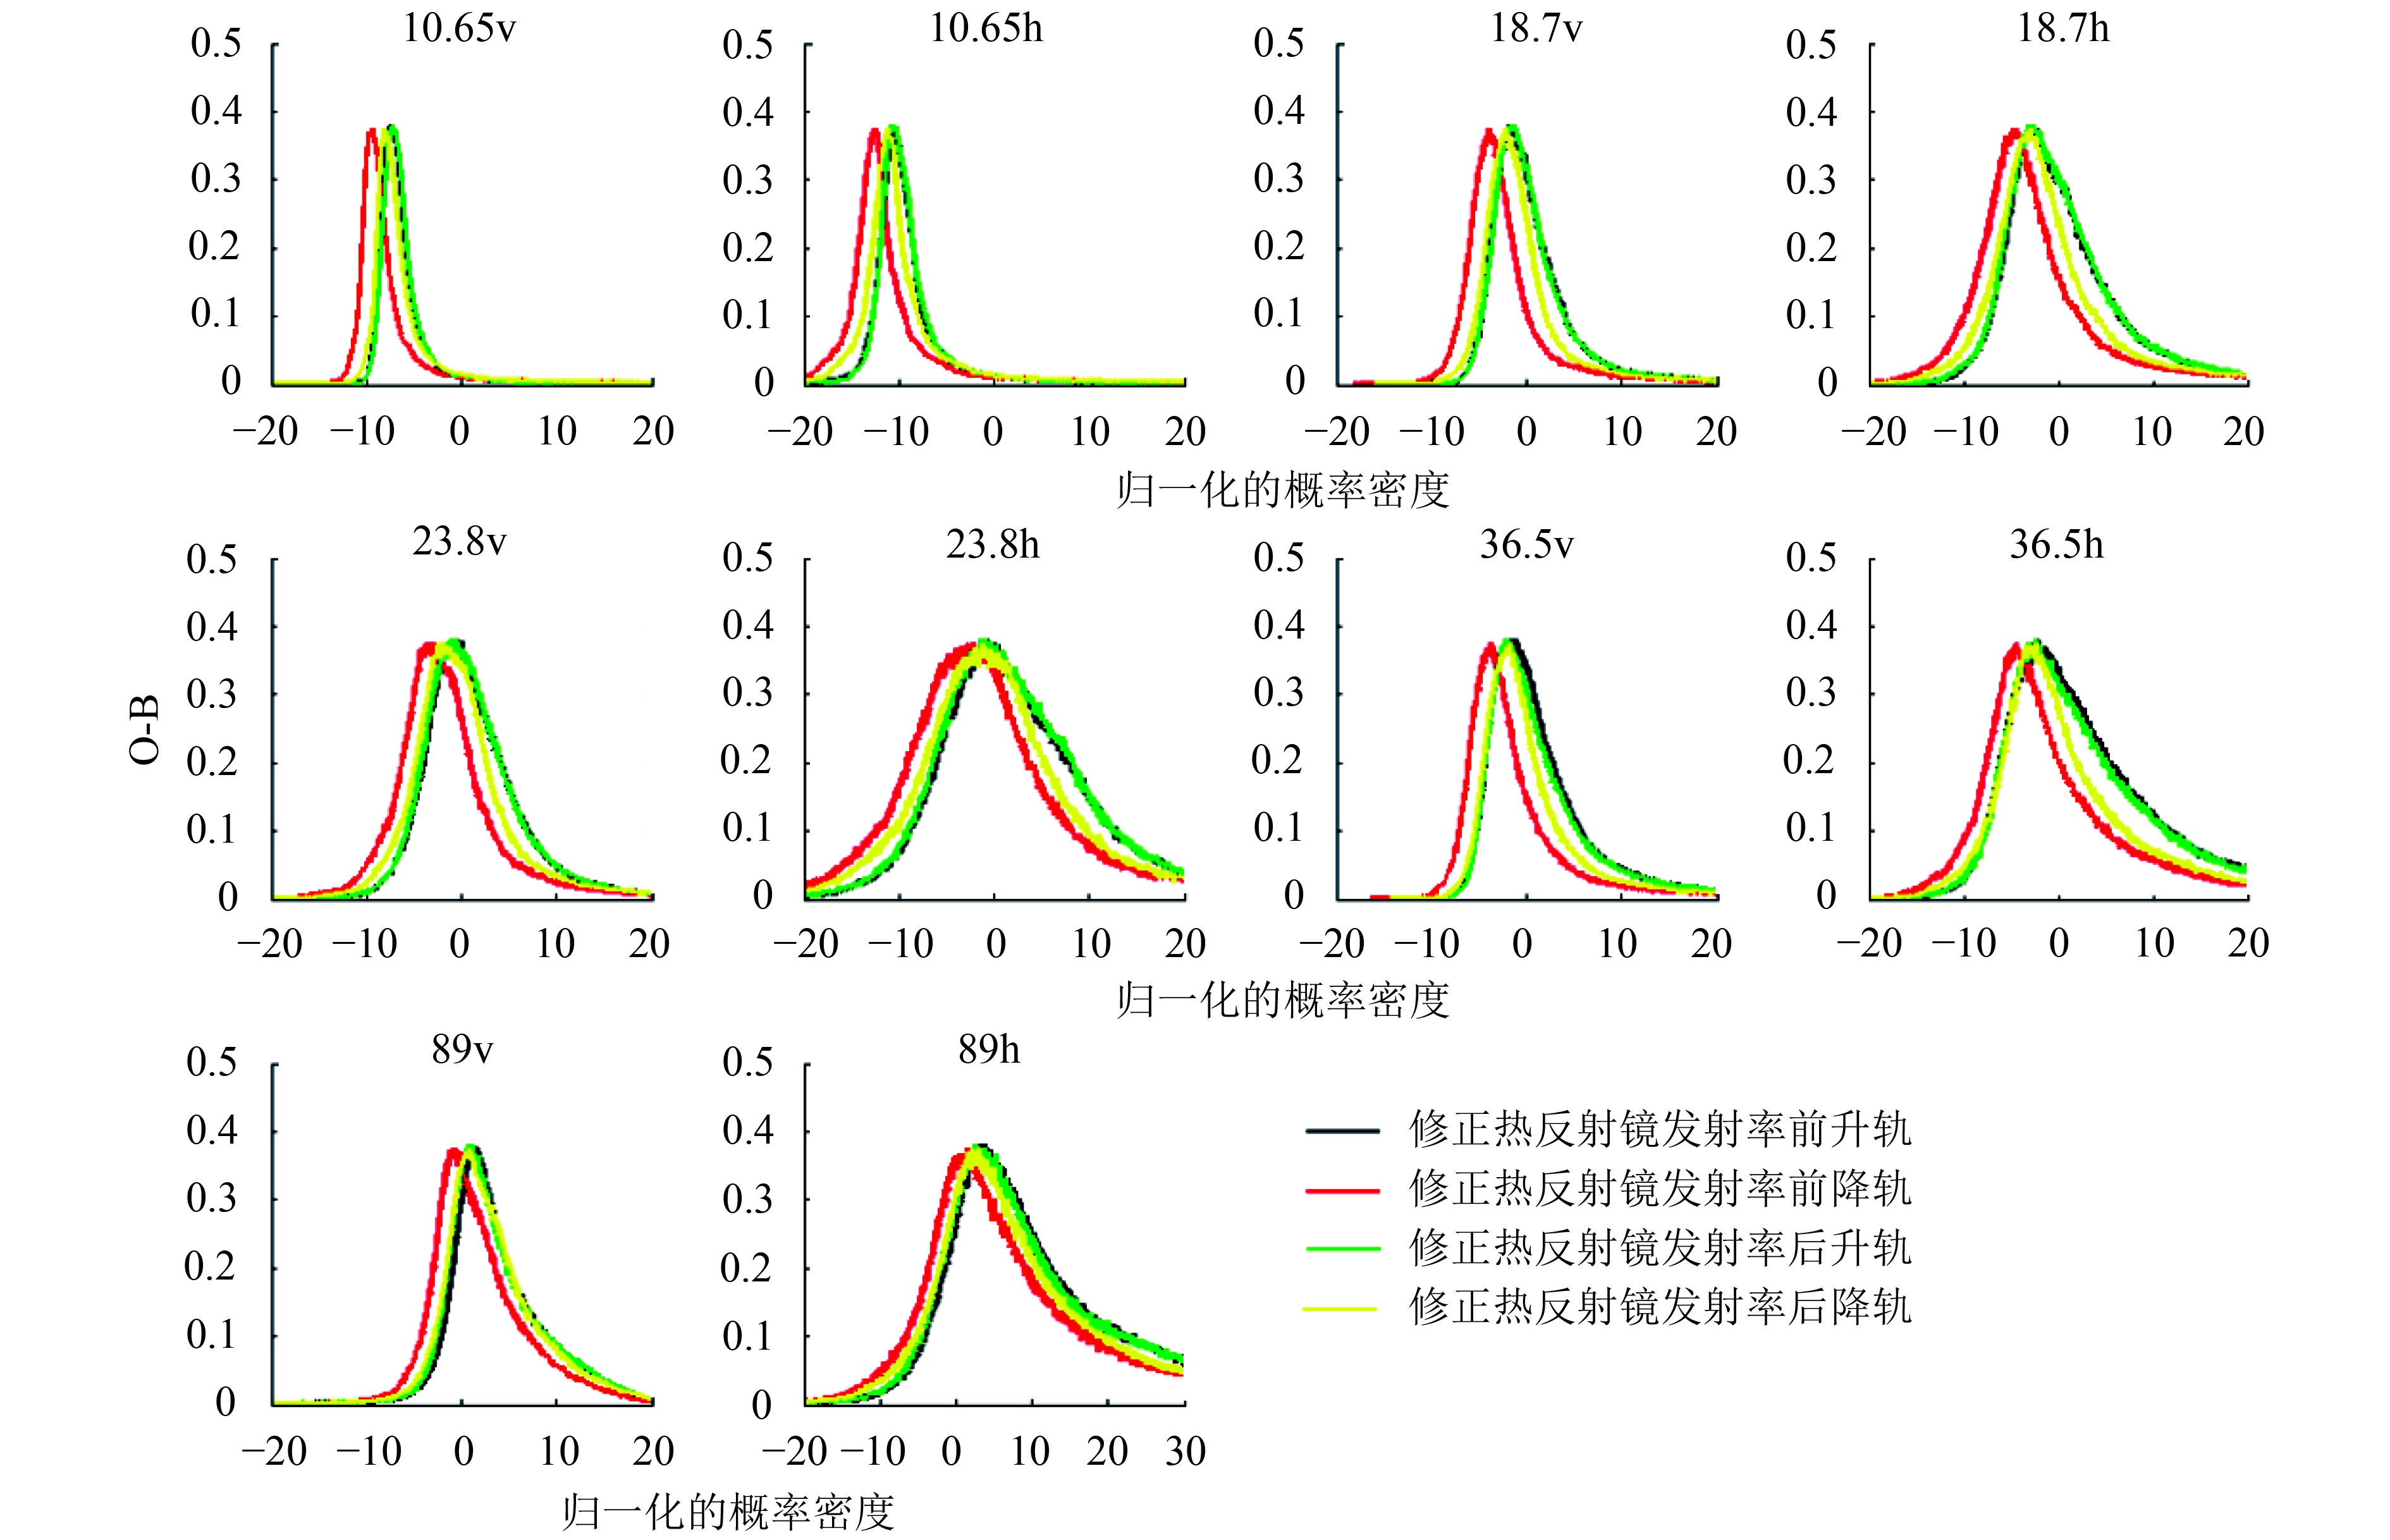
参考TRMM和SSMI估计的发射率结果,利用2017年8月一个月的数据,在0.01—0.095不断调整MWRI的热反射镜发射率,使升轨O-B与降轨O-B的概率分布逐渐重合,最终确定的各通道热反射镜发射率如表3所示。
表 3 各通道热反射镜发射率
Table 3 The emissivity of the hot load reflector
| 通道 | ||||||||||
| 10.6 v | 10.6 h | 18.7 v | 18.7 h | 23.8 v | 23.8 h | 36.5 v | 36.5 h | 89 v | 89 h | |
| 发射率 | 0.04 | 0.085 | 0.05 | 0.07 | 0.04 | 0.055 | 0.045 | 0.06 | 0.035 | 0.04 |
选取2017年1月15日,4月15日,7月15日,10月15日作为典型冬、春、夏、秋样本,计算升轨O-B和降轨O-B的概率分布如图10—图13所示(横坐标为O-B, 纵坐标为归一化的概率密度),可以看出,调整热反射镜发射率前,升降轨概率分布出现分离,调整后,升降轨概率分布基本重合,升降轨差异明显减小,说明作者抓住了影响MWRI数据O-B升降轨差异的主要误差源。

5 结 论
本文针对影响MWRI数据业务同化应用中的 O-B 偏差存在升降轨差异的问题,分析了其主要原因,发现这种差异主要是热反射镜的发射率异常增大引起的。通过不断调整发射率,使升轨O-B与降轨O-B的概率分布逐渐重合,初步估算出了热反射镜发射率。从本文的敏感性分析及MWRI升降轨偏差的减小效果来看,抓住了影响MWRI数据O-B升降轨差异的主要误差源,为MWRI在数值天气预报模式中的业务同化应用奠定了基础。
影响O-B结果的因素很多,尽管它们不是MWRI O-B升降轨差异主要误差源,但会影响估算热反射镜在轨发射率的准确性。例如O-B结果会受到ERA5输入场精度、辐射传输模式精度、定标精度及云检测精度等的影响,其中辐射传输模式的精度主要取决于洋面发射率模型的精度,其会受到海水温度、海水盐度、海面风速和海面风向的影响,而定标精度会受到热定标源不确定性、冷定标源不确定性、非线性偏差、热反射镜背瓣影响不确定性和仪器灵敏度等的影响。因此,针对业务应用,后续将对样本进行更加严格的质量控制和筛选,剔除观测模拟偏差存在较大不确定的样本,估算出更精确的热反射镜在轨发射率。
参考文献(References)
-
Guo Y, Lu N M, Gu S Y, He J Y and Wang Z Z. 2014. Radiometric characteristics of FY-3B microwave humidity and temperature sounder. Journal of Applied Meteorological Science, 25 (4): 436–444. [DOI: 10.3969/j.issn.1001-7313.2014.04.006] ( 郭杨, 卢乃锰, 谷松岩, 何杰颖, 王振占. 2014. FY-3B微波湿温探测仪辐射测量特性. 应用气象学报, 25 (4): 436–444. [DOI: 10.3969/j.issn.1001-7313.2014.04.006] )
-
Huang D, Qiu Y B, Shi L J, Wu S L, Liu X S and Ruan Y J. 2017. Cross –calibration for passive microwave measurement of MWRI and AMSR-E. Science of Surveying and Mapping, 42 (1): 136–142. [DOI: 10.16251/j.cnki.1009-2307.2017.01.025] ( 黄端, 邱玉宝, 石利娟, 武胜利, 刘小生, 阮永俭. 2017. 两种星载微波辐射计被动亮温数据的交叉定标. 测绘科学, 42 (1): 136–142. [DOI: 10.16251/j.cnki.1009-2307.2017.01.025] )
-
Kunkee D B, Swadley S D, Poe G A, Hong Y and Werner M F. 2008. Special sensor microwave imager sounder (SSMIS) radiometric calibration anomalies—Part I: identification and characterization. IEEE Transactions on Geoscience and Remote Sensing, 46 (4): 1017–1033. [DOI: 10.1109/TGRS.2008.917213]
-
Liu G F, Wu S L, Chen W Y, Pan L and He J K. 2014. Calibration system and achievement of microwave radiation imager of FY-3 satellite. Journal of Microwaves, 30 (S1): 576–579. [DOI: 10.14183/j.cnki.1005-6122.2014.s1.164] ( 刘高峰, 武胜利, 陈卫英, 潘莉, 何嘉恺. 2014. FY-3卫星微波成像仪定标系统及实现. 微波学报, 30 (S1): 576–579. [DOI: 10.14183/j.cnki.1005-6122.2014.s1.164] )
-
Lu N M and Gu S Y. 2016. Review and prospect on the development of meteorological satellites. Journal of Remote Sensing, 20 (5): 832–841. [DOI: 10.11834/jrs.20166194] ( 卢乃锰, 谷松岩. 2016. 气象卫星发展回顾. 遥感学报, 20 (5): 832–841. [DOI: 10.11834/jrs.20166194] )
-
Lu Q F. 2011. Initial evaluation and assimilation of FY-3A atmospheric sounding data in the ECMWF system. Science China Earth Sciences, 41 (7): 890–894. [DOI: 10.1007/s11430-011-4243-9] ( 陆其峰. 2011. 风云三号A星大气探测资料数据在欧洲中期天气预报中心的初步评价与同化研究. 中国科学: 地球科学, 41 (7): 890–894. [DOI: 10.1007/s11430-011-4243-9] )
-
Lu Q F, Bell W, Bauer P, Bormann N and Peubey C. 2011. Characterizing the FY-3A microwave temperature sounder using the ECMWF model. Journal of Atmospheric and Oceanic Technology, 28 (11): 1373–1389. [DOI: 10.1175/JTECH-D-10-05008.1]
-
Lu Q F, Lawrence H, Bormann N, English S, Lean K, Atkinson N, Bell W and Carminati F. 2015. An Evaluation of FY-3C Satellite Data Quality at ECMWF and the Met Office. ECMWF Technical Memoranda 767. ECMWF
-
Saunders R, Matricardi M and Brunel P. 1999. An improved fast radiative transfer model for assimilation of satellite radiance observations. Quarterly Journal of the Royal Meteorological Society, 125 (556): 1407–1425. [DOI: 10.1002/qj.1999.49712555615]
-
Skou N. 1997. Measurement of small antenna reflector losses for radiometer calibration budget. IEEE Transactions on Geoscience and Remote Sensing, 35 (4): 967–971. [DOI: 10.1109/36.602538]
-
Tang S H, Qiu H and Ma G. 2016. Review on progress of the Fengyun meteorological satellite. Journal of Remote Sensing, 20 (5): 842–849. [DOI: 10.11834/jrs.20166232] ( 唐世浩, 邱红, 马刚. 2016. 风云气象卫星主要技术进展. 遥感学报, 20 (5): 842–849. [DOI: 10.11834/jrs.20166232] )
-
Wang G X, Jiang L M, Wu S L, Liu X J and Hao S R. 2017. Intercalibrating FY-3B and FY-3C/MWRI for synergistic implementing to snow depth retrieval algorithm. Remote Sensing Technology and Application, 32 (1): 49–56. ( 王功雪, 蒋玲梅, 武胜利, 刘晓敬, 郝诗睿. 2017. FY-3B与FY-3C/MWRI交叉定标及雪深算法应用. 遥感技术与应用, 32 (1): 49–56. )
-
Wentz F J, Ashcroft P and Gentemann C. 2001. Post-launch calibration of the TRMM microwave imager. IEEE Transactions on Geoscience and Remote Sensing, 39 (2): 415–422. [DOI: 10.1109/36.905249]
-
Wessel J, Farley R W, Fote A, Hong Y, Poe G A, Swadley S D, Thomas B and Boucher D J. 2008. Calibration and validation of DMSP SSMIS lower atmospheric sounding channels. IEEE Transactions on Geoscience and Remote Sensing, 46 (4): 946–961. [DOI: 10.1109/TGRS.2008.917132]
-
Yang H, Li X Q, You R and Wu S L. 2013. Environmental data records from FengYun-3B microwave radiation imager. Advances in Meteorological Science and Technology, 3 (4): 136–143. ( 杨虎, 李小青, 游然, 武胜利. 2013. 风云三号微波成像仪定标精度评价及业务产品介绍. 气象科技进展, 3 (4): 136–143. )
-
Yang H, Weng F Z, Lv L Q, Lu N M, Liu G F, Bai M, Qian Q Y, He J K and Xu H X. 2011. The FengYun-3 microwave radiation imager on-orbit verification. IEEE Transactions on Geoscience and Remote Sensing, 49 (11): 4552–4560. [DOI: 10.1109/TGRS.2011.2148200]
-
Zhang M, Wang S J, Qin D Y, Qiu H and Tang S H. 2018. The inversion and quality validation of FY-3C MWRI seasurface temperature. Journal of Remote Sensing, 22 (5): 713–722. [DOI: 10.11834/jrs.20187217] ( 张淼, 王素娟, 覃丹宇, 邱红, 唐世浩. 2018. FY-3C微波成像仪海面温度产品算法及精度检验. 遥感学报, 22 (5): 713–722. [DOI: 10.11834/jrs.20187217] )