
|
收稿日期: 2017-12-20; 预印本: 2019-01-17
基金项目: 国家自然科学基金(编号:41671360);中国科学院遥感与数字地球研究所培育方向项目
第一作者简介: 林红磊,1992年生,男,博士研究生,研究方向为高光谱遥感。E-mail:linhoml@163.com
通信作者简介: 张霞,1972年生,女,研究员,研究方向为光谱响应机理、图像处理与信息提取、深空探测。E-mail:zhangxia@radi.ac.cn
|
摘要
矿物的类型、丰度及其粒径分布对理解月球和行星表面曾经存在过怎样的地质演化过程具有重要的意义。本文提出基于辐射传输模型和稀疏分解模型反演矿物丰度及其粒径分布的方法,利用辐射传输模型计算各矿物端元不同粒径的单次散射反照率以构建解混光谱库,然后基于稀疏分解算法得到在每个可观测像元的端元最优丰度和粒径分布。利用实验室测量数据进行验证,表明本文方法具有较高的精度。最后根据玉兔号月球车的实地测量光谱数据,利用本文方法获得了其矿物的丰度及粒径分布,结果显示,辉石、橄榄石、斜长石、熔融玻璃和钛铁矿的丰度在4个观测点的平均丰度分别为28.1%、4.5%、39%、28%、0.4%,辉石的平均粒径为166.02 μm,橄榄石为8.34 μm,斜长石为196.31 μm,熔融玻璃为44.21 μm,一定程度上表明在这些观测点不同矿物对太空风化的响应不同。
关键词
辐射传输模型, 稀疏分解, 丰度, 粒径分布, 玉兔号, 月球
Abstract
A fundamental subject in planetary exploration and sciences is the determination of mineral abundance and size distribution from visible/near-infrared spectra. Such knowledge can help better understand what geologic processes have been active on the lunar and planetary surface. The imaging spectrometer carried by the Yutu rover of the Chang’E-3 mission measured the reflectance spectra of lunar soil at a height of approximately 1 m, providing a new insight for understanding lunar surface. A new method was proposed to retrieve mineral abundance and particle size distribution and apply the results to Yutu rover in situ measurement. A methodology combining Hapke radiative transfer model and sparse unmixing algorithm was proposed in this study to retrieve mineral abundance and particle size distribution. The imaginary part of the refractive index of each endmember was first calculated by solving the Hapke model. The single-scattering albedos of each endmember with different particle sizes were obtained based on the Hapke slab model, and then the endmember library was constructed. Finally, the single-scattering albedo of the mineral mixture, which was computed using Hapke bidirectional equation, was unmixed using sparse unmixing algorithm with the aid of the endmember library. Laboratory measurements collected from the Reflectance Experiment Laboratory were used to validate the methodology. Results showed that the methodology has good performance in retrieving the abundance and particle size from mineral mixtures. Finally, the methodology was applied to Yutu rover measurement. The values of average abundance of pyroxene, olivine, plagioclase, agglutinit, and ilmenite at four observation points were 28.1%, 4.5%, 39%, 28%, and 0.4%, respectively. The average particle sizes of pyroxene, olivine, plagioclase, and fused glass were 166.02, 8.34, 196.31, and 44.21 μm, respectively, possibly indicating the different response of each component to space weathering in this site.
Key words
radiative transfer model, sparse unmixing, abundance, particle size distribution, Yutu rover, lunar
1 引 言
了解星体表面矿物类型、丰度和粒径分布是行星探测和科学的基本目标之一,这有助于理解星体地质演化历史和空间环境(Clark 等,1990)。月球表面主要有橄榄石,单斜辉石,斜方辉石,斜长石和钛铁矿等,Lucey(2004) 利用Clementine光谱数据首次对全月表的矿物分布进行了识别,Shuai等(2013)利用嫦娥一号IIM(Interference Imaging Spectrometer)数据对月球表面的矿物进行了定量填图,但是轨道数据的空间分辨率受到限制,更精细的矿物组分、含量和颗粒大小等信息在研究月球的演化历史中有重要的意义。获取月表矿物的丰度能够揭示岩石类型和地球化学性质,分析物质起源和演化过程,估算月球的资源;了解粒径分布能够为模拟月壤提供参考,服务于月球着陆器和巡视器的设计和测试,还可以为研究月表的成熟度/风化程度提供证据,帮助理解月表的演化历史。阿波罗任务从月球采集到了月壤并返回地球,但是所有样品都是在地球上的实验室进行分析的(Pieters 等,2002;Taylor 等,2001a,2001b),嫦娥三号任务中的玉兔号月球车携带的成像光谱仪对月表土壤进行了实地光谱测量,实地采集到的月壤光谱为理解月球表面的物质成分、含量及粒径分布等提供了一个新的视角。
矿物的丰度和有效颗粒大小可以利用高光谱数据通过求解辐射传输模型求得,主要包括Hapke模型(Hapke,1981)和Shkuratov模型(Shkuratov 等,1999)。例如,在卫星尺度上,Lucey(2004)基于Clementine UV/VIS 光谱数据利用Hapke 辐射传输模型构建查找表获得了斜长石、单斜辉石、斜方辉石、橄榄石在全月表的分布;Yan等(2010)利用Hapke模型将Clementine和端元数据转化成单次散射反照率,基于线性解混模型对斜长石、单斜辉石、钛铁矿、斜方辉石、橄榄石等5类矿物等进行了丰度填图;Shuai等(2013)基于IIM高光谱遥感数据在考虑太空风化的基础上,利用Hapke模型和多端元解混模型得到了全月表典型造岩矿物的丰度分布。Li和Li(2011)利用牛顿迭代法求解Hapke模型得到月壤样品中各端元的丰度和有效颗粒大小,但是这样只能得到一个有效的颗粒大小值,每个像元中各端元的粒径分布更能约束月球演化历史和环境。Zhang等(2015)根据Hapke模型利用在750—1550 nm波段范围去除连续统后的玉兔号测量光谱,在假定矿物颗粒大小已知的情况下(设定矿物粒径为17 μm)进行了矿物的丰度反演;Ling等(2015) 利用修正的高斯模型(MGM)估算了玉兔号月球车行进路线中的矿物丰度。然而,利用高光谱数据同时得到月壤每个端元的丰度和粒径分布的研究十分有限。
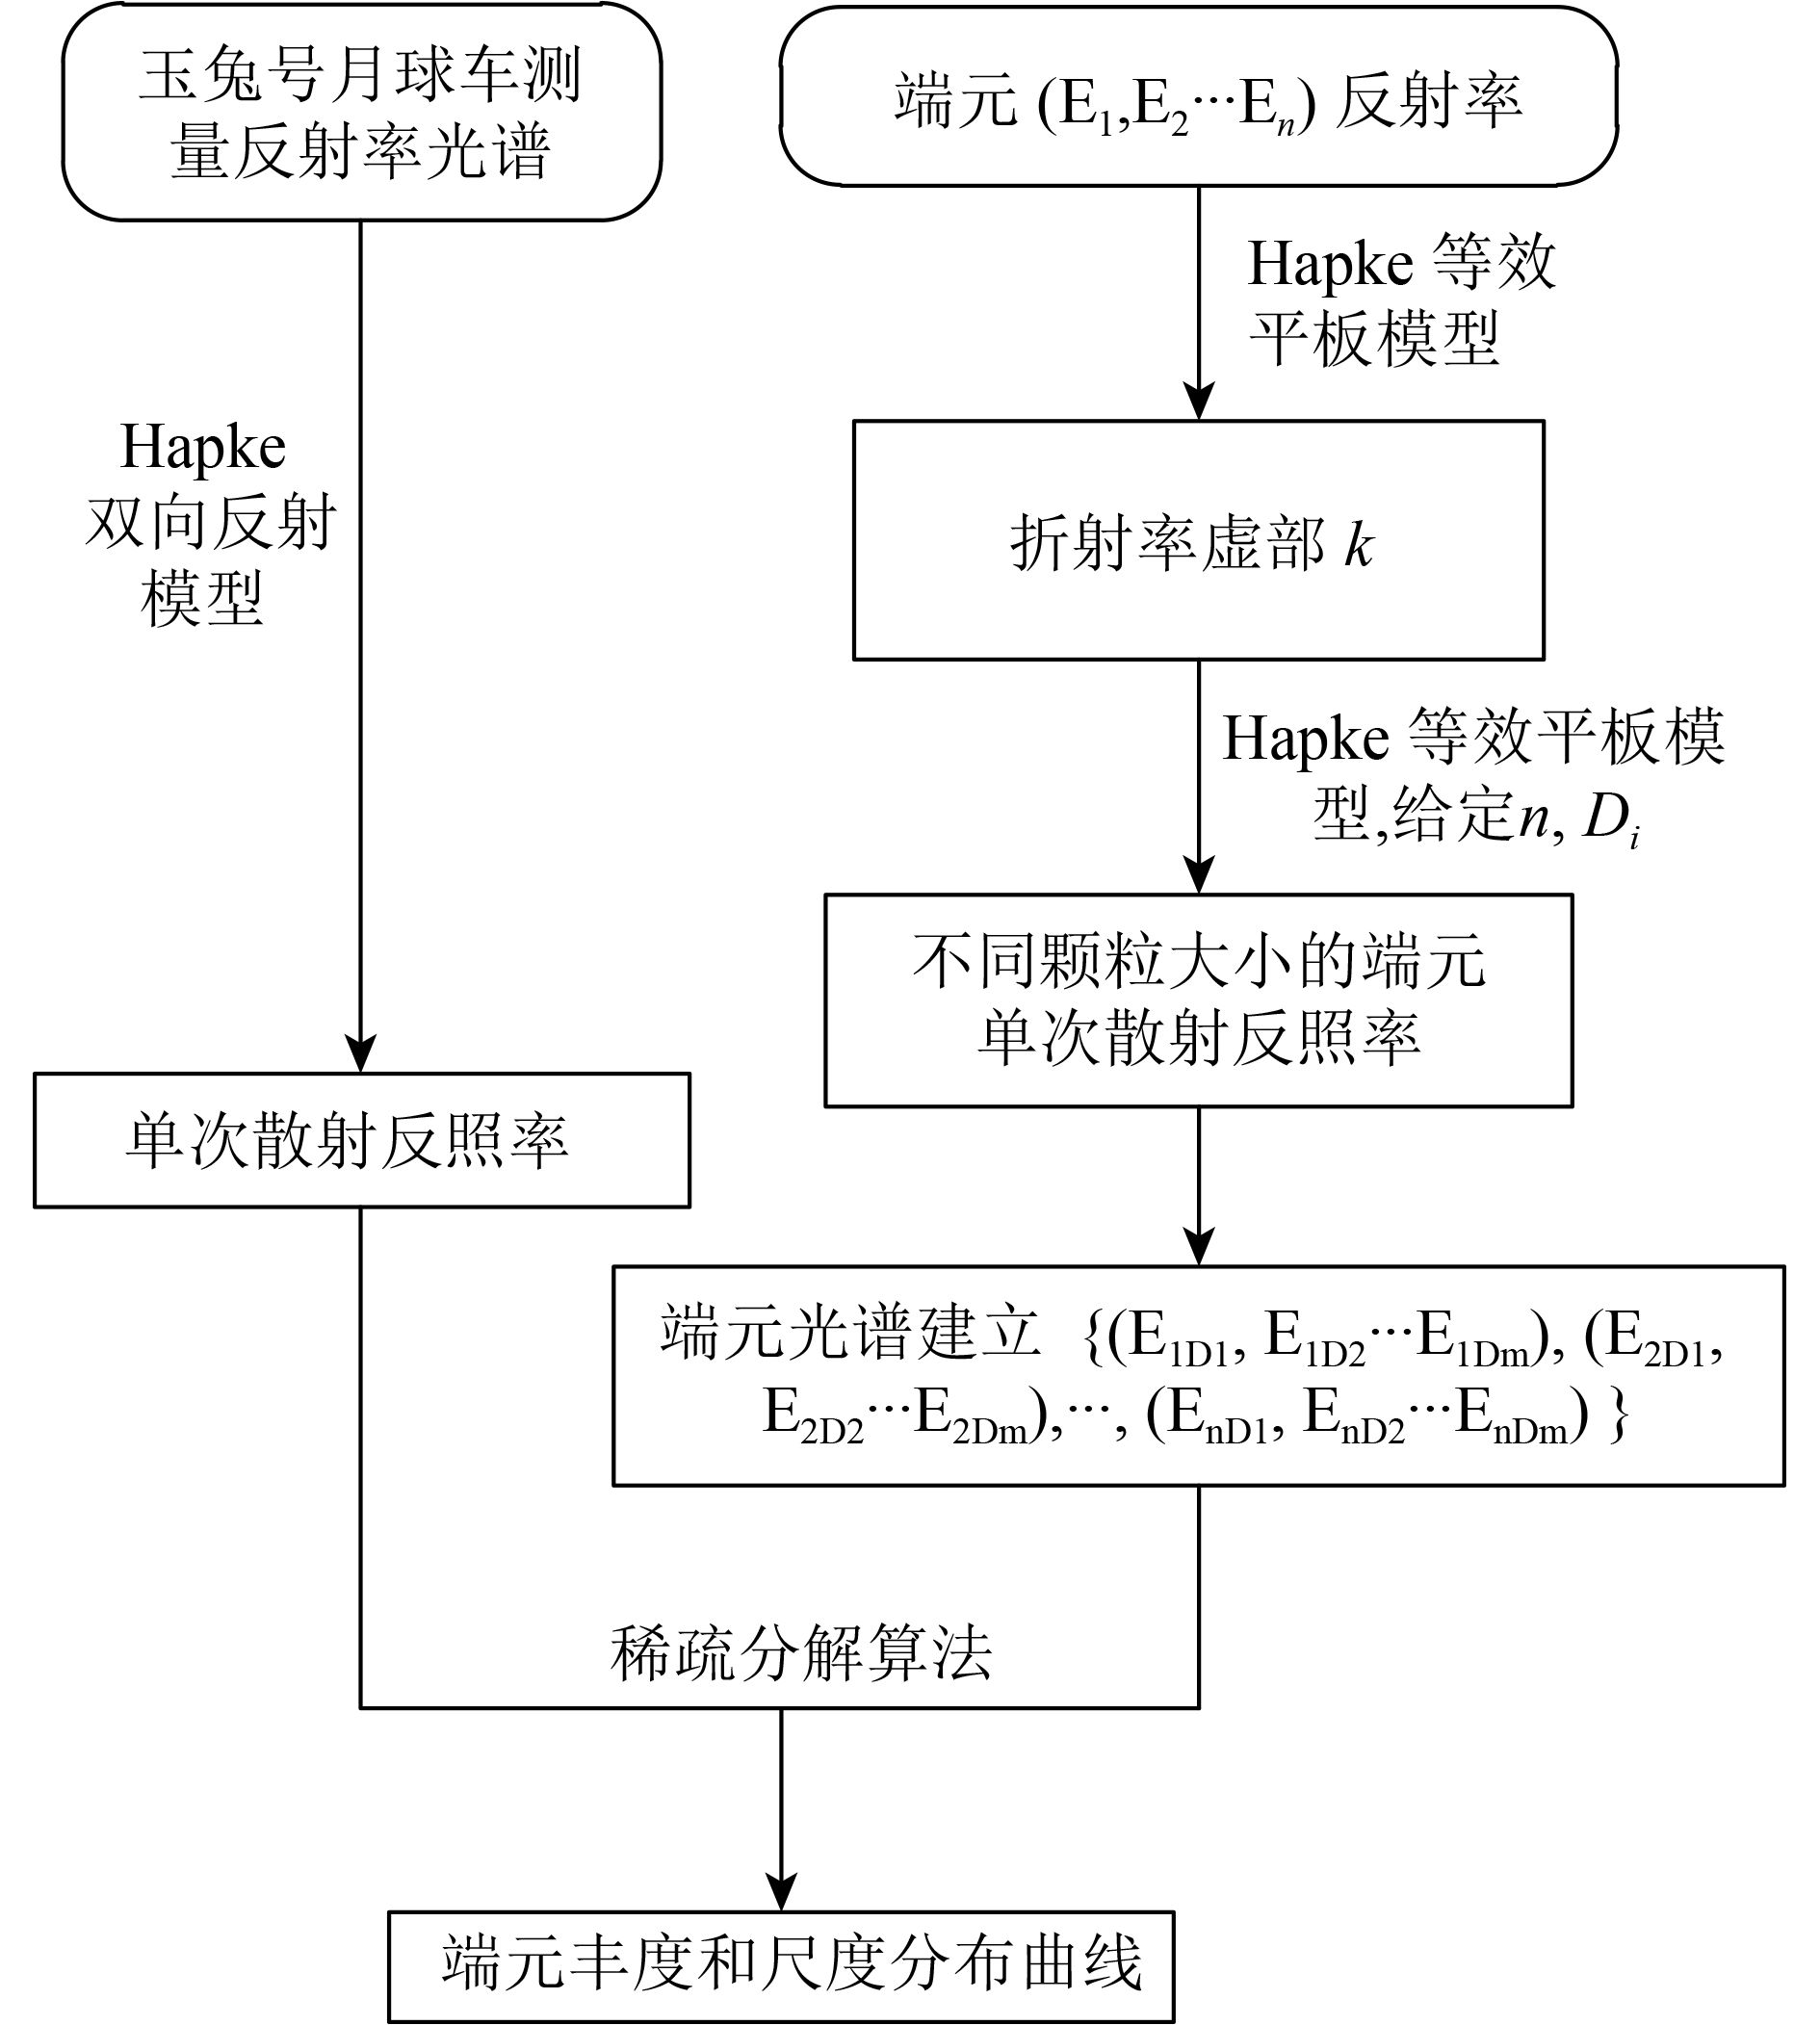
本文首先提出联合辐射传输模型和稀疏光谱分解算法的方法来获得每个可观测像元上矿物丰度和粒径分布曲线,然后利用实验室测量数据验证此方法的有效性,最后得到玉兔号月球车着陆区域的矿物类型、丰度及粒径分布曲线。
2 数据及预处理
2.1 玉兔号测量数据
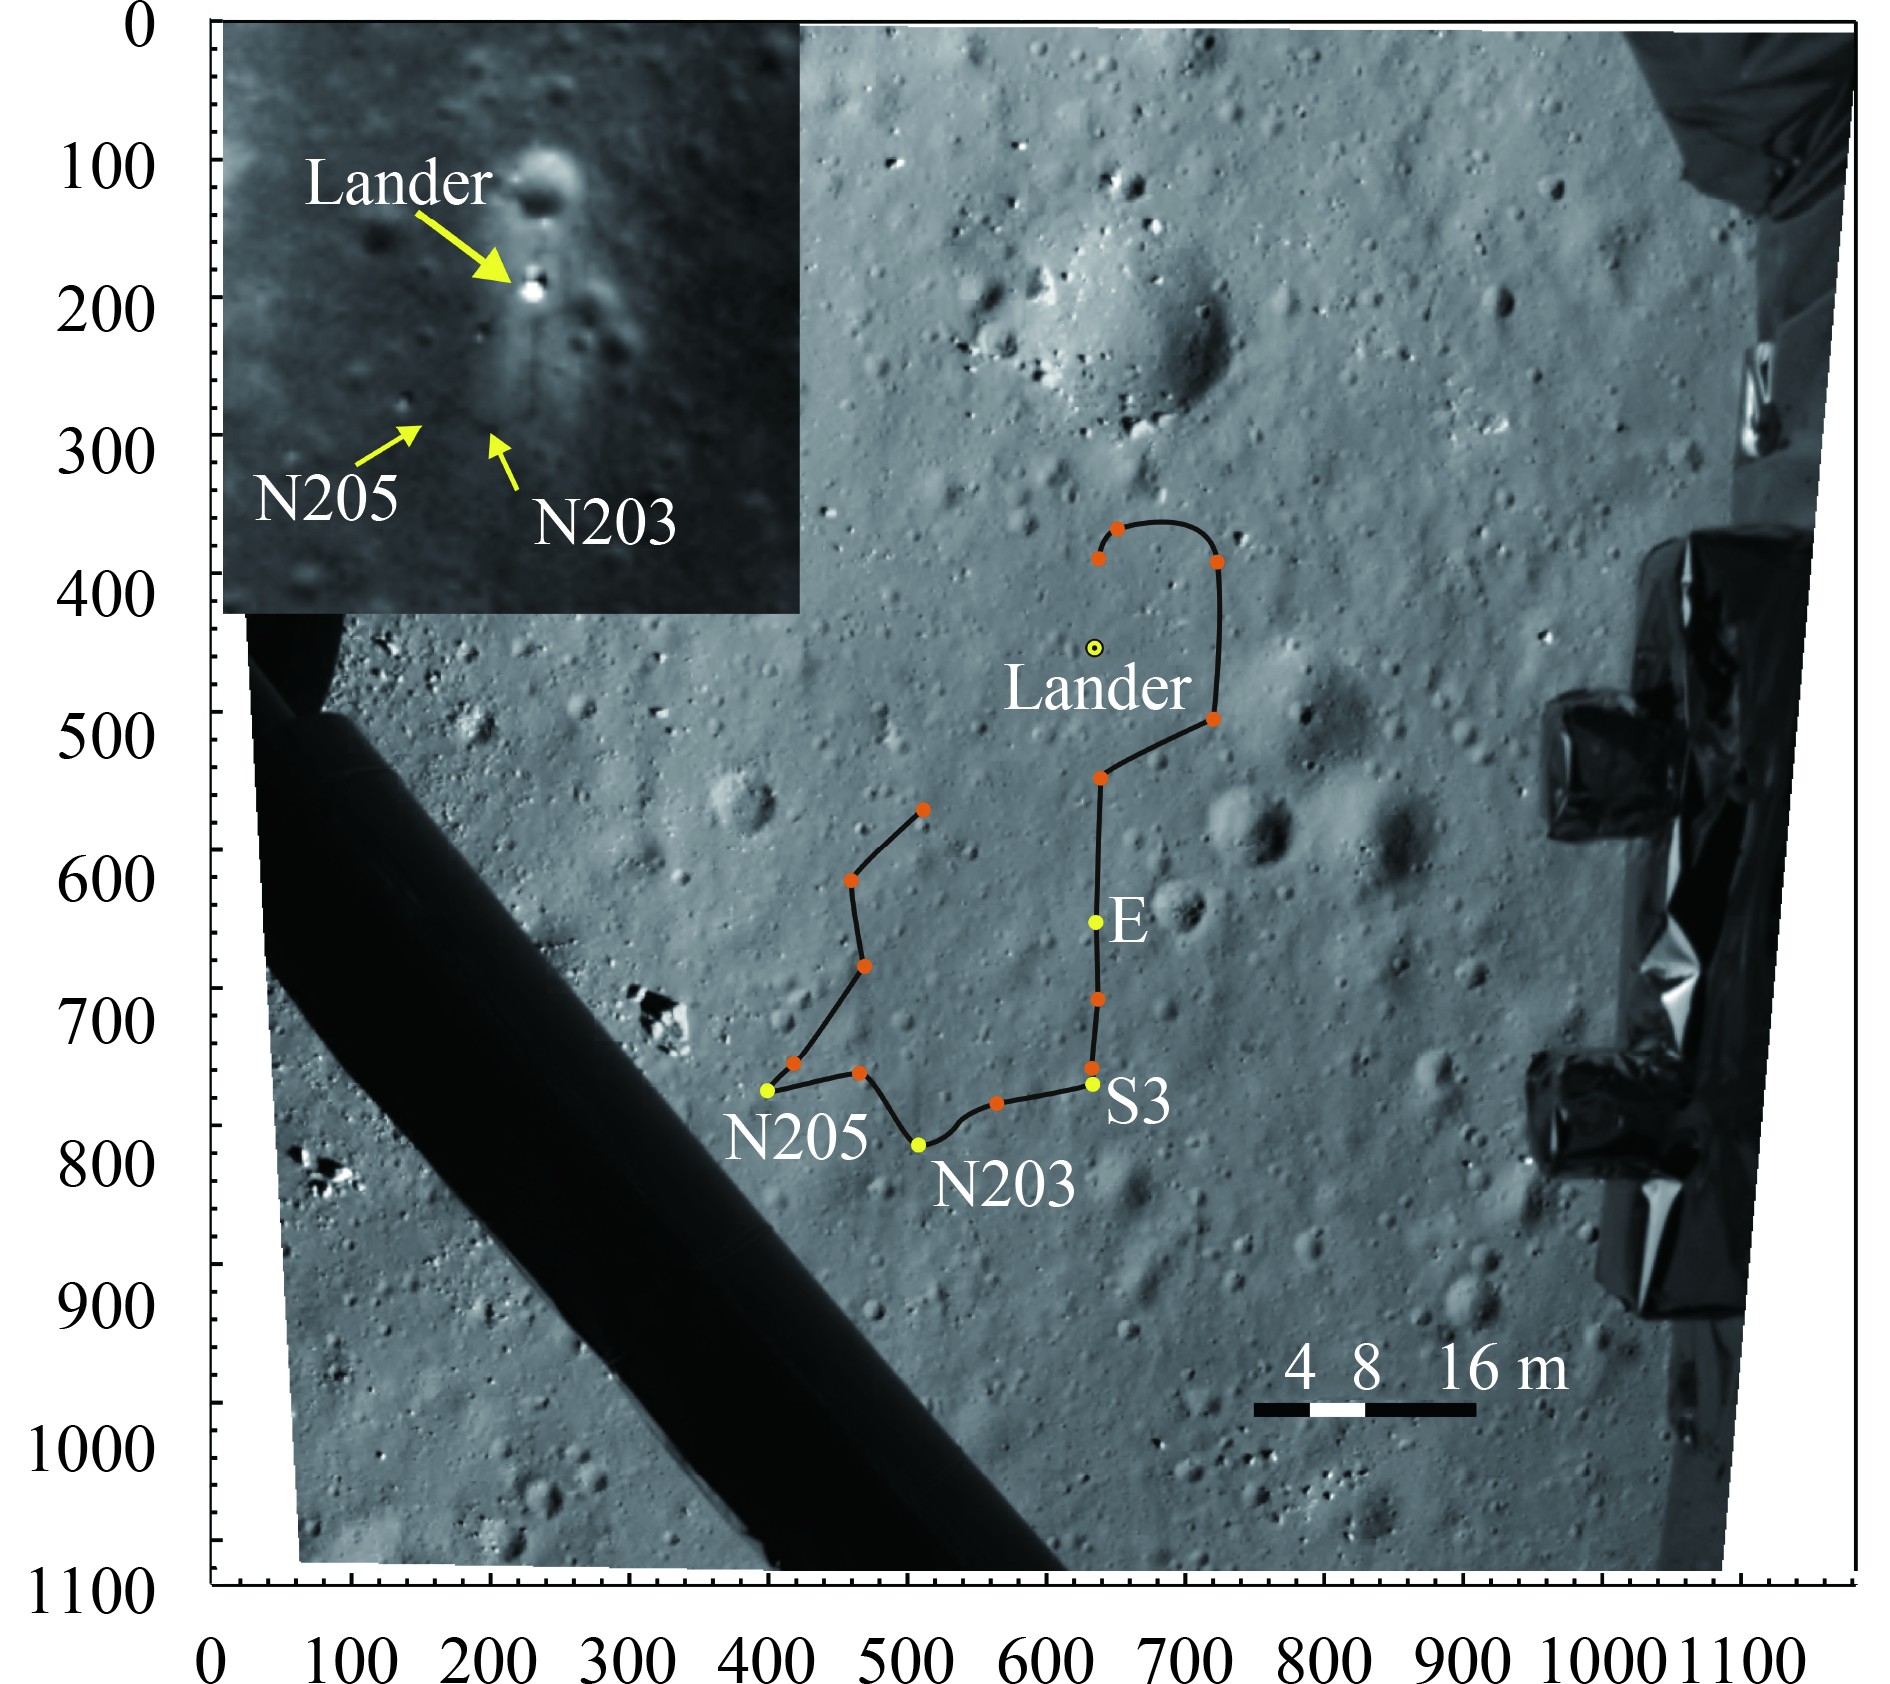
嫦娥三号着陆点在雨海盆地(Imbrium)的北部虹湾地区,经纬度为340.49°E,44.12°N(Xiao 等,2015)。玉兔号携带的成像光谱仪在高度约为1 m处测量月壤获得4条光谱(图1),分为可见光—近红外(450—950 nm)和短波红外(900—2400 nm)两个部分,可见光—近红外谱段的光谱分辨率为2—7 nm,短波红外为3—12 nm(He 等,2014),本文所用测量光谱被校正到入射角30°出射角0°的反射率(Zhang 等,2015),并利用小波变换进行了光谱平滑(图2)。为避免月表热效应对反射率的影响,本研究只对0.45—1.8 μm的数据进行分析(Combe 等,2011;Zhang等,2015)。


2.2 实验室测量光谱数据
本文所用实验室测量光谱数据主要包括两个部分:
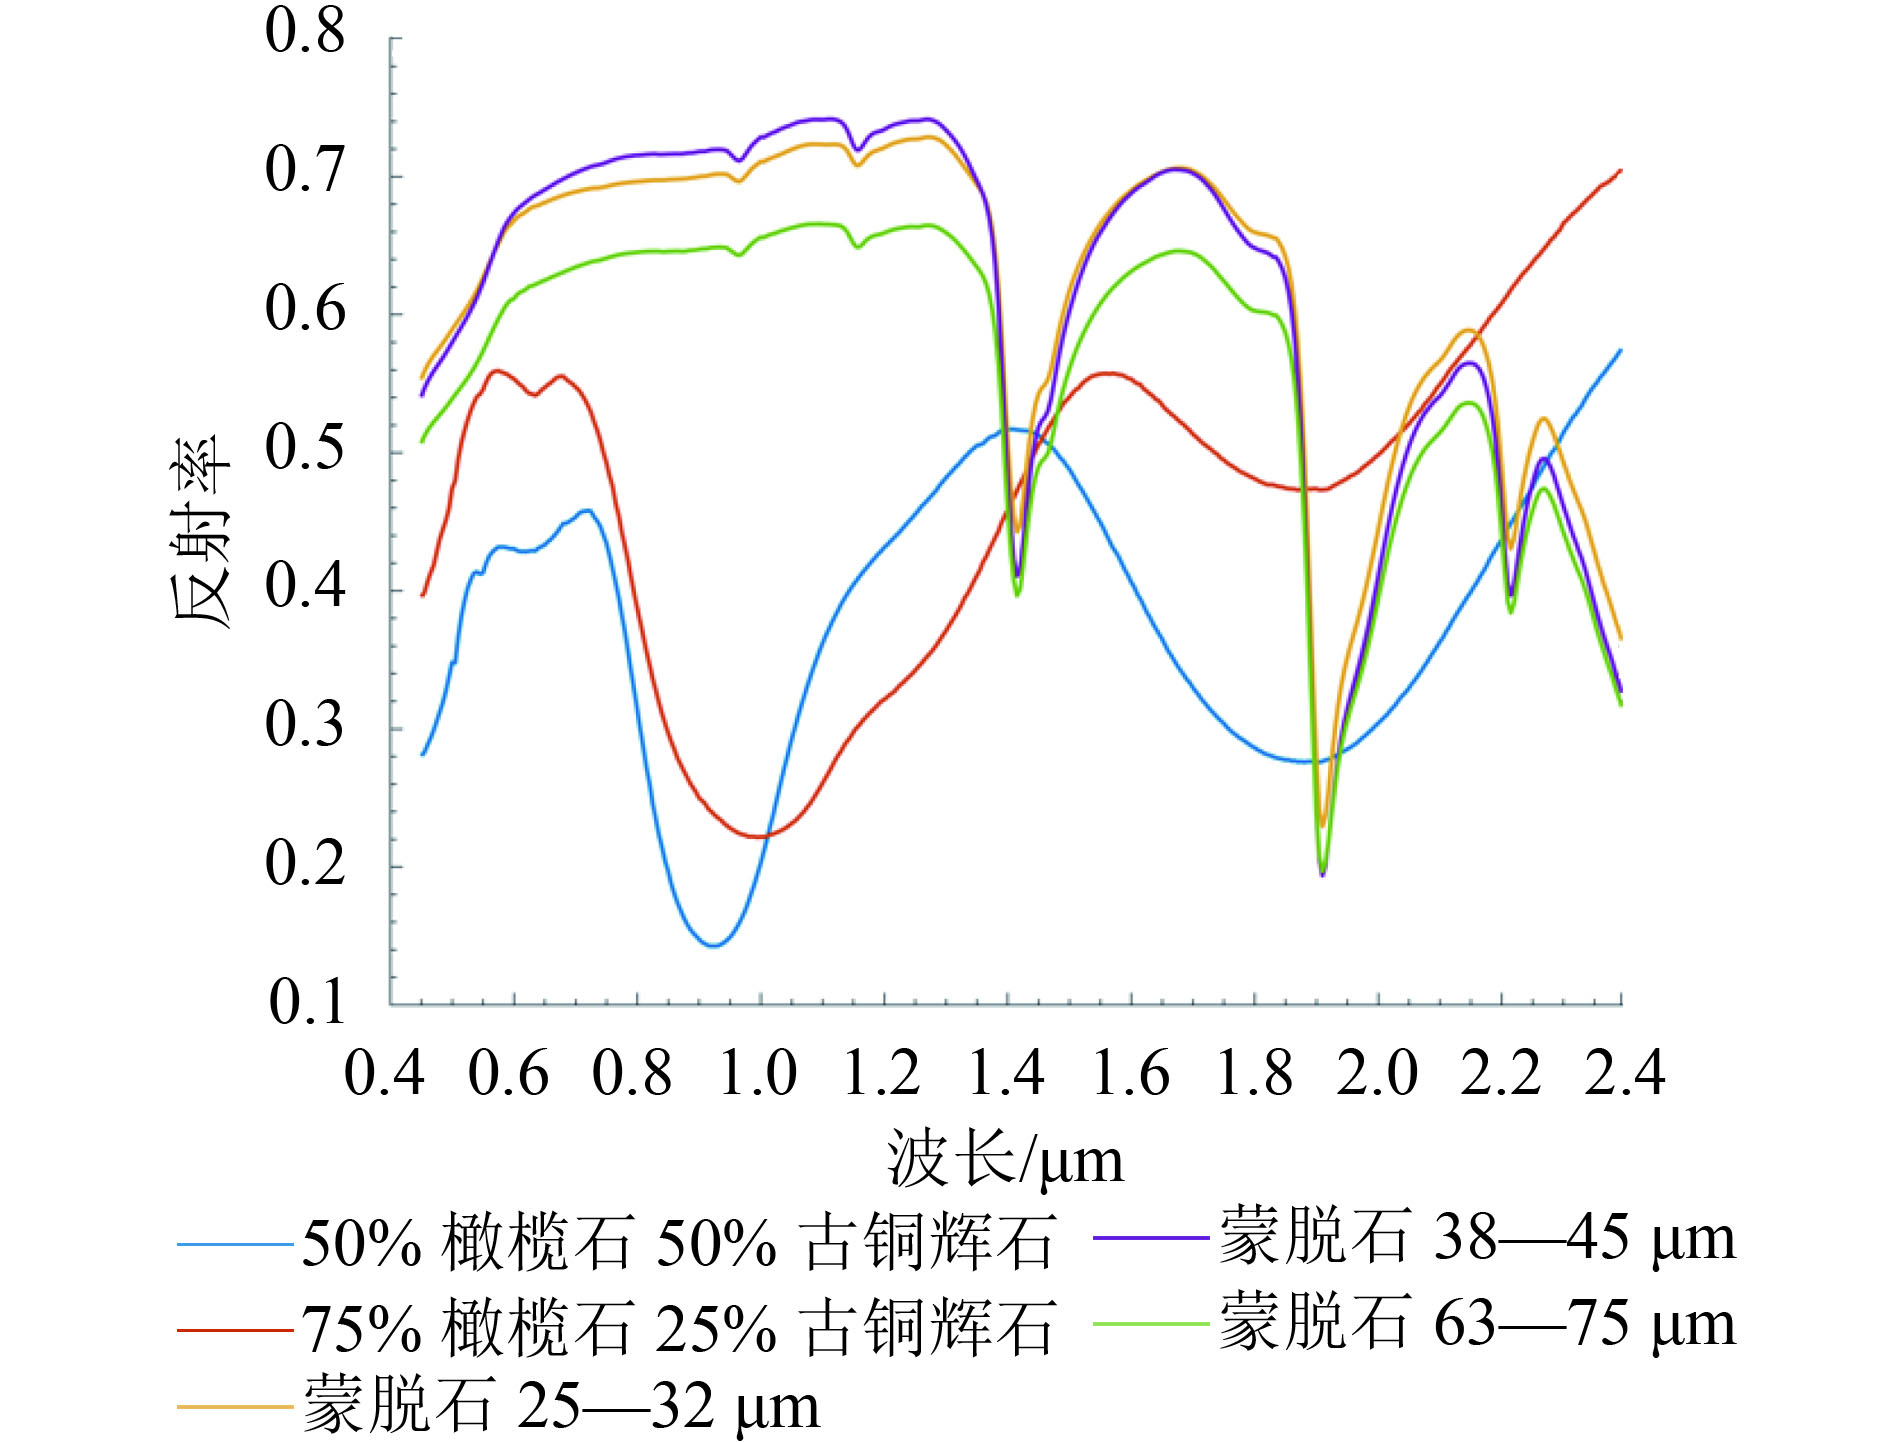
(1)用于方法验证的橄榄石和古铜辉石混合光谱以及蒙脱石光谱(图3)。这些光谱数据从RELAB(Reflectance Experiment Laboratory)光谱数据库中获得(http://www.planetary.brown.edu/relab/,2017)。由于缺乏已知矿物颗粒分布的造岩矿物数据,因此本研究利用可获得的已知尺寸分布的蒙脱石光谱进行粒径分布反演的验证;橄榄石和古铜辉石的混合物光谱(XT-CMP-31和XT-CMP-32)是在较好的控制条件下测量的,并且经过应用分析表明此样本具有较高的可靠性(Mustard和Pieters,1989)。
(2)用于玉兔号测量数据分析的端元光谱数据。月表的矿物主要有橄榄石、辉石、斜长石和钛铁矿等(Papike 等,1991),Zhang 等(2015)对玉兔号月球车着陆区域的矿物分析表明辉石、橄榄石和斜长石的存在,Ling等(2015)对玉兔号测量数据分析结果表明还有钛铁矿的存在,Wu和Hapke(2018)认为玉兔号测量光谱特征较弱可能是太空风化影响和熔融玻璃的存在导致的。基于此,本研究利用从RELAB(Reflectance Experiment Laboratory)收集的橄榄石,单斜辉石,斜方辉石,斜长石,钛铁矿和熔融玻璃的光谱作为初始端元(Li和Li,2011;Shuai 等,2013),这些矿物光谱均为月壤样品的实验室测量光谱(图4)。表1为所采用矿物的编号、粒径和折射率实部(Bell 等,1976;Egan和Hilgeman,1975;Lucey,1998)。

表 1 本研究所用纯净矿物信息
Table 1 Pure minerals used in this study
| 矿物 | 样本编号 | 粒径/μm | 折射率实部n |
| 单斜辉石 | LS-CMP-009 | 0—250 | 1.73 |
| 斜方辉石 | LS-CMP-012 | 0—250 | 1.77 |
| 橄榄石 | LR-CMP-014 | 0—45 | 1.83 |
| 斜长石 | LS-CMP-086 | 0—20 | 1.56 |
| 熔融玻璃 | LU-CMP-007-1 | 100—1000 | 1.49 |
| 钛铁矿 | MR-MSR-006 | 0—20 | 2.13 |
3 方法
本文提出联合辐射传输模型和稀疏光谱分解模型利用玉兔号测量光谱数据反演矿物丰度和粒径分布的方法(图5)。首先利用Hapke辐射传输模型推导出端元的光学常数,然后计算出不同粒径的矿物单次散射反照率,构建解混光谱库,最后利用稀疏分解算法反演矿物丰度及其粒径分布。
矿物在反射率空间的混合具有很强的非线性特征,而各组分的单次散射反照率ωi可线性相加获得混合物的单次散射反照率ωmix(Hapke,1981)
| ${\omega _{\rm{mix}}} = \sum\limits_{i = 1}^K {{F_i}{\omega _i}} $ | (1) |
3.1 混合物单次散射反照率计算
Hapke等(1981)推导出了反射率与单次散射反照率之间的经验关系式
| $r = \frac{\omega }{{4({\mu _0} + \mu)}}\left( {(1 + B(g))P(g) + H({\mu _0})H(\mu){\rm{ - }}1} \right)$ | (2) |
式中,r是矿物反射率,μ0和μ分别是入射角和出射角的余弦值,B(g)表示在相位角g处的后向散射,P(g)为在相位角g处的相函数,H(μ0)和H(μ)为多重散射函数(Hapke,2012)
| $H(x) = {\left( {1 -(1 - \gamma)x\left({r_0} +\left(1 - \frac{{{r_0}}}{2} - {r_0}x\right)\frac{{\ln(1 + x)}}{x}\right)} \right)^{ - 1}}$ | (3) |
式中,
| $B(g) = 1/(1 +(1/h)\tan(g/2)),\;\;h = - \frac{3}{8}\ln(1 - \varphi)$ | (4) |
式中,
相函数P(g)采用勒让德多项式
| $P(g) = 1 + b{P_1}(g) + c{P_2}(g)$ | (5) |
| ${P_1}(g) = \cos(g),{P_2}(g) = \frac{3}{2}{\cos ^2}(g) - \frac{1}{2}$ | (6) |
式中,b和c分别设置为−0.4和0.25(Lucey,1998;Mustard和Pieters,1989)。
3.2 端元光谱库构建
端元矿物的单次散射反照率取决于颗粒大小和光学常数(折射率实部n和虚部k)。折射率实部在可见光—短波红外的变化不大(Roush,2003),因此本文将n在所有波段视为一个常数(表1),折射率虚部k可由Hapke辐射传输模型求出(图4),在k的求解过程中,各矿物多采用的粒径为表1中各端元粒径范围的均值(Li和Milliken,2015)。
因此,给定粒径D,该粒径的矿物单次散射反照率可根据Hapke模型求得
| $\omega = {S_e} +(1 - {S_e})\frac{{(1 - {S_i})}}{{1 - {S_i}\varTheta }}\varTheta $ | (7) |
式中,Se为表面反射
| ${S_e} \approx \frac{{{{(n - 1)}^2} + {k^2}}}{{{{(n + 1)}^2} + {k^2}}} + 0.05$ | (8) |
Si为内部反射
| ${S_i} \approx 1 - \frac{4}{{n{{(n + 1)}^2}}}$ | (9) |
Θ为内部传输系数
| $\varTheta = \exp(- \alpha \left\langle D \right\rangle)$ | (10) |
式中,

月表太空风化的影响会增加SMFe(Submicroscopic metallic Fe)和熔融玻璃的含量,降低物质的粒径(Li和Li,2011)。可通过改变加入SMFe的宿主矿物的吸收系数考虑太空风化的影响(Hapke,2001)
| $\alpha = \frac{{4{\text{π}} nk}}{{\textit{λ}}} + \frac{{36{\text{π}}{\textit{z}}{M_{{\rm Fe}}}\rho }}{{{\textit{λ}} {\rho _{{\rm Fe}}}}}$ | (11) |
| ${\textit{z}} = \frac{{{n^3}{n_{{\rm Fe}}}{k_{{\rm Fe}}}}}{{{{({n_{{\rm Fe}}}^2 - {k_{{\rm Fe}}}^2 + 2{n^2})}^2} + 4{n_{{\rm Fe}}}^2{k_{{\rm Fe}}}^2}}$ | (12) |
式中,nFe、kFe、ρFe分别为SMFe的折射率实部、折射率虚部和密度,MFe为SMFe的质量分数,ρ为矿物密度。
每个粒径的矿物都被视为是一个端元,由于月球表面的矿物粒径一般小于200 μm(Taylor 等,2001a),因此本文设定5—200 μm间隔为5 μm的粒径计算每个矿物的单次散射反照率,构成解混端元光谱库。
3.3 稀疏光谱分解模型
稀疏光谱分解模型旨在从一个大的端元光谱库中找出最优的组合来最好的模拟测量光谱(Iordache 等,2011)。由于混合物中的端元个数相对于端元光谱来说是稀疏的,因此在经典线性解混模型上可加入稀疏约束,表达式为
| $\mathop {\min }\limits_x {\left\| x \right\|_0}$ | (13) |
约束条件:
可以将式(13)转化成最优化的形式
| $\min \frac{1}{2}\left\| {Mx{\rm{ - }}y} \right\|_2^2 + {\textit{λ}} {\left\| x \right\|_1} + {l_{R_ + ^n}}(x)$ | (14) |
式中,M为端元光谱库,x是丰度,y为测量光谱,λ为正则化参数,
4 结果分析
4.1 实验室测量数据验证
本文首先利用实验室测量光谱数据来验证方法的有效性,包括两个方面:(1)利用已知粒径分布的纯净蒙脱石光谱验证尺度分布反演结果(Robertson 等,2016);(2)利用已知比例混合的古铜辉石和橄榄石来验证丰度反演结果(Mustard和Pieters,1989)。
(1)粒径分布反演验证。3种不同粒径(25—32 μm,38—45 μm和63—75 μm)的蒙脱石样品用来验证本文方法,图7为反演的粒径分布曲线以及真实的颗粒大小统计。

反演的粒径分布曲线与真实的颗粒大小统计一致。对于25—32 μm蒙脱石样品,本文模拟的平均粒径为31.20 μm,实际统计为31 μm;对于38—45 μm蒙脱石样品,本文模拟的平均粒径为43.84 μm,实际统计为38 μm;对于63—75 μm蒙脱石样品,本文模拟的平均粒径为60.40 μm,实际统计为62 μm。
(2)丰度反演验证。已知丰度比例的颗粒大小在45—75 μm古铜辉石和橄榄石混合物(RELAB ID:XT-CMP-31和XT-CMP-32)用来验证本文丰度反演方法的准确性。图8为模拟的丰度结果及粒径分布曲线。实验室矿物丰度反演精度显示(表2),各矿物的平均丰度反演误差为5.16%,表明本文方法具有较高的反演精度。由于没有真实的粒径分布数据,无法直接验证粒径分布曲线反演结果,但本文反演出的粒径大部分落在45—75 μm(图8)。

表 2 实验室矿物丰度反演精度
Table 2 The accuracy of minerals abundances retrieval
| 矿物 | 样本 | 真实丰度/% | 反演丰度/% | 误差/% |
| 古铜辉石 | XT-CMP-31 | 50.92 | 57.56 | 6.64 |
| XT-CMP-32 | 25.70 | 22.01 | 3.69 | |
| 橄榄石 | XT-CMP-31 | 49.08 | 42.44 | 6.64 |
| XT-CMP-32 | 74.30 | 77.99 | 3.69 |
4.2 玉兔号测量光谱数据分析
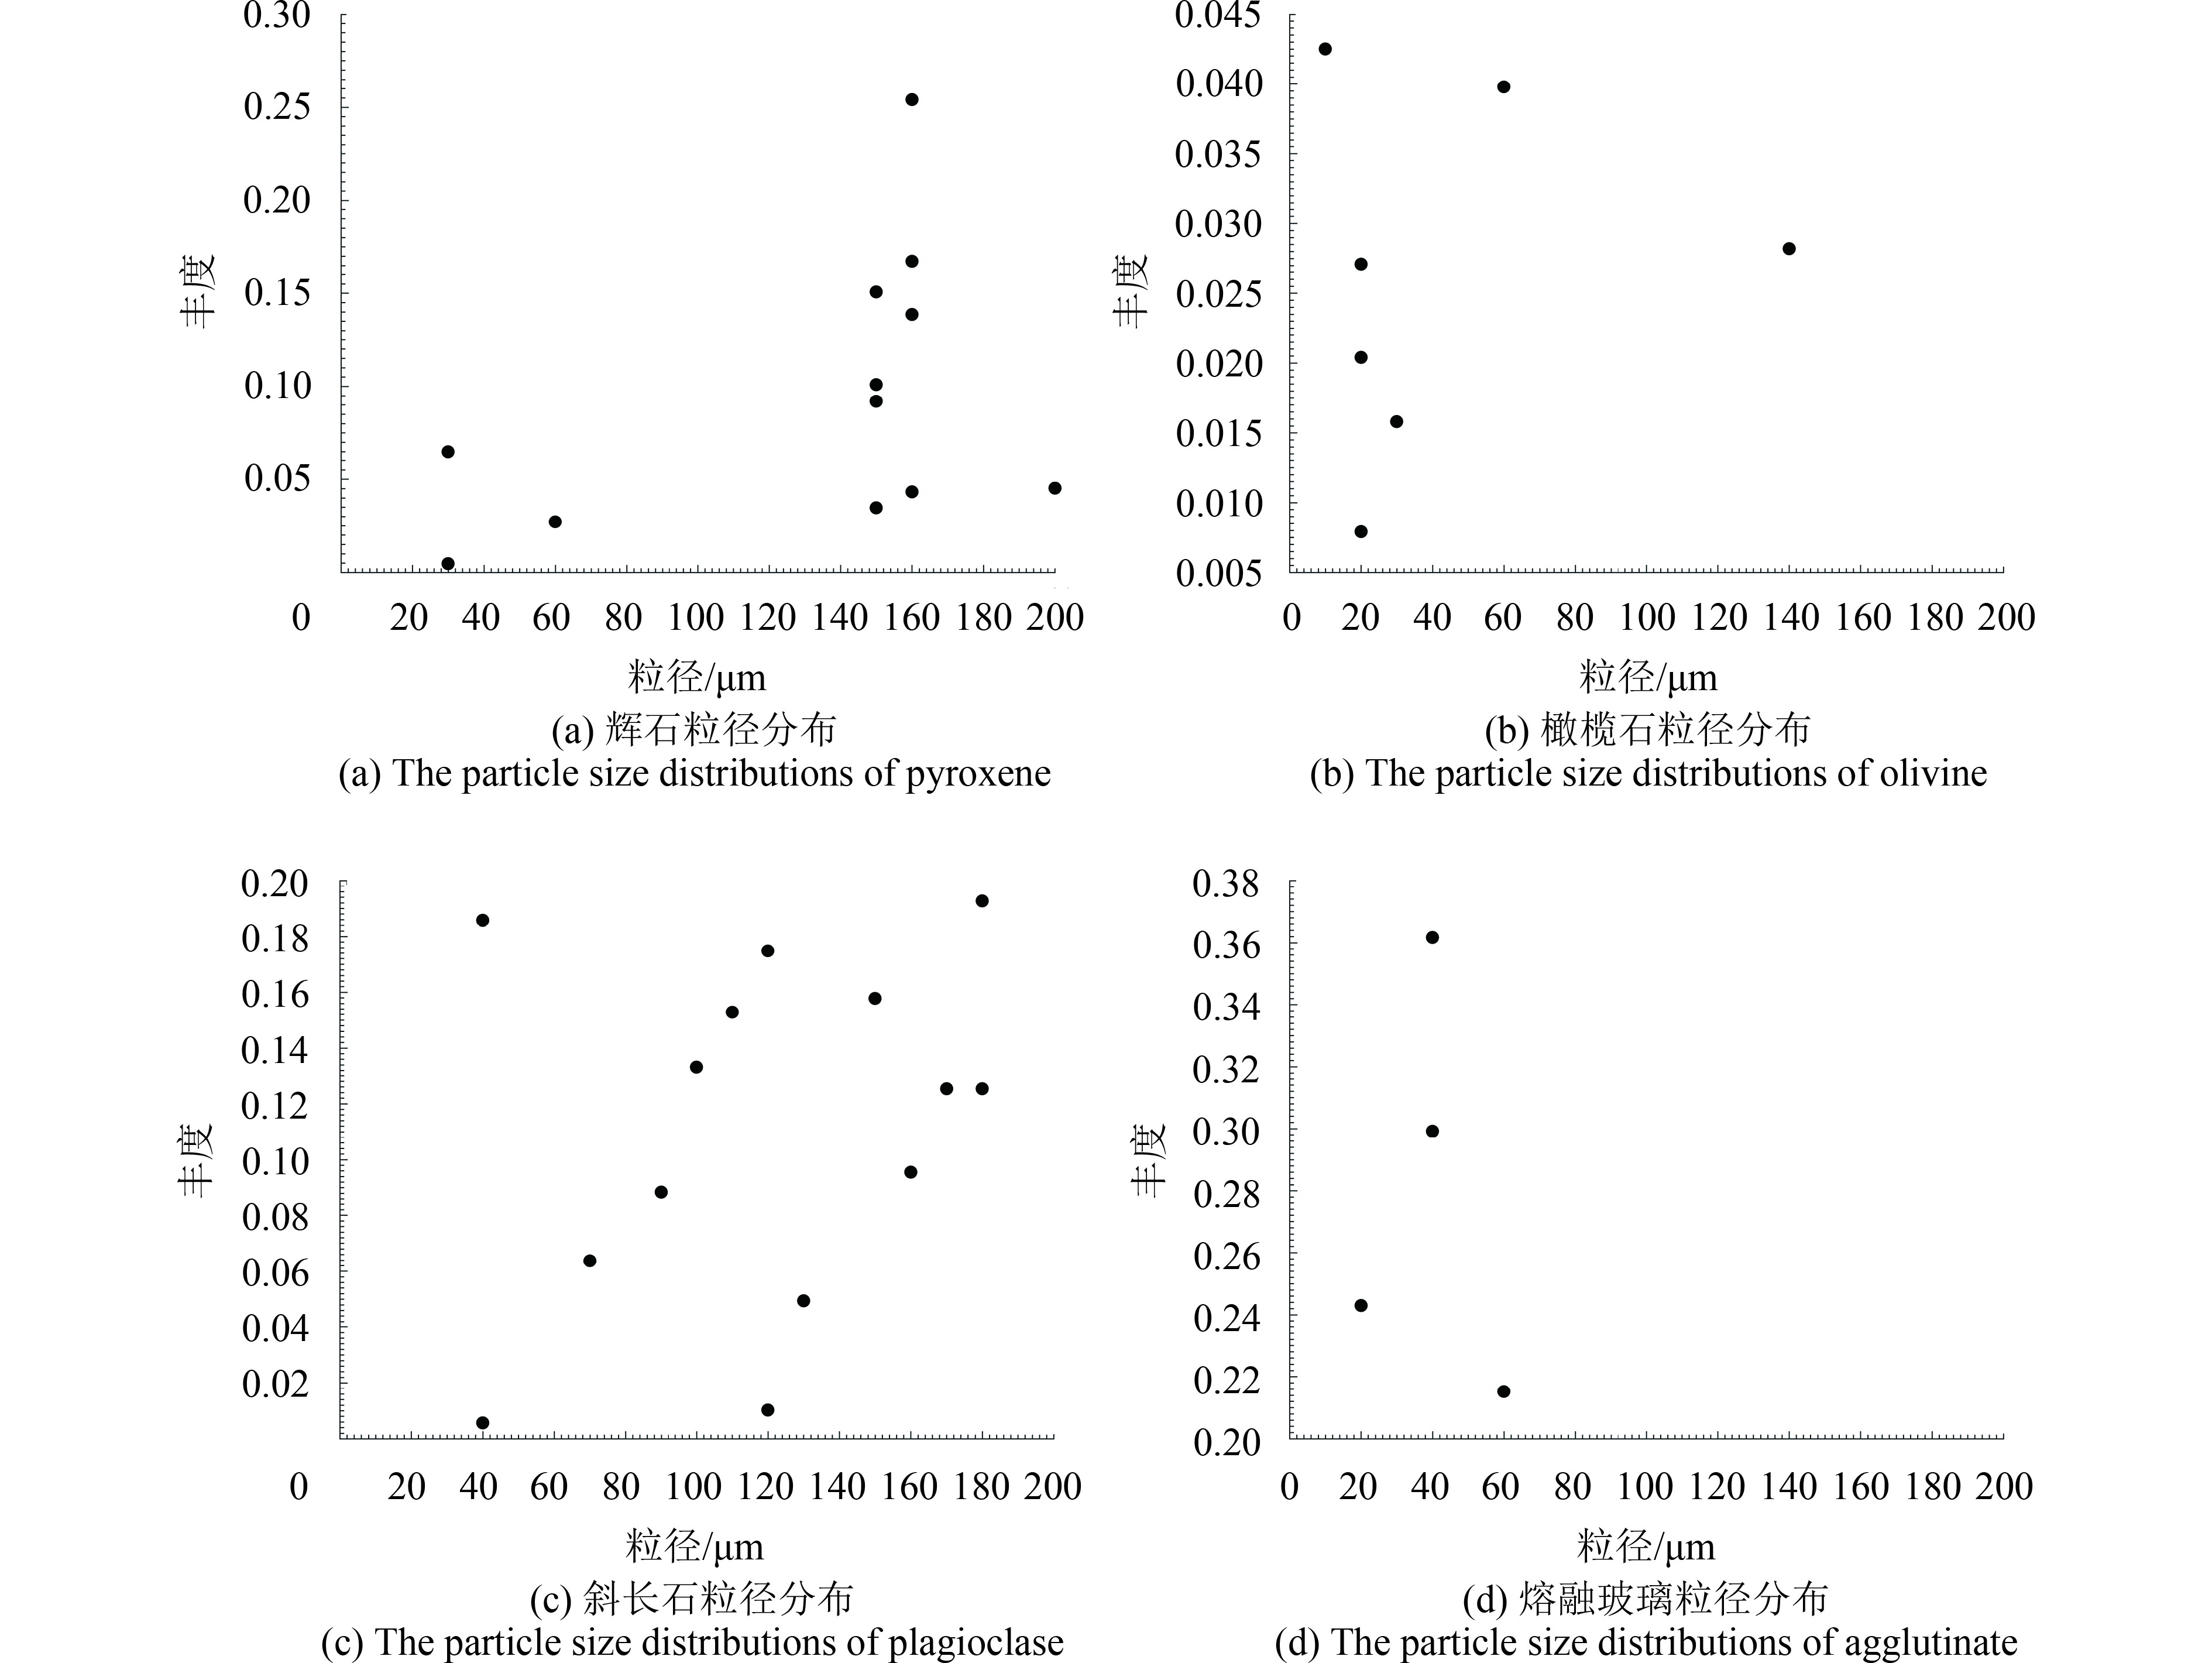
从玉兔号实地测量光谱数据的反演结果可以看出(图9),测量光谱和模拟的光谱能够很好的拟合,表3为玉兔号月球车4个观测点的矿物丰度。辉石、橄榄石、斜长石、熔融玻璃和钛铁矿的丰度在4个观测点的平均丰度分别为28.1%、4.5%、39%、28%、0.4%。从各矿物的粒径分布看,在玉兔号着陆区域辉石的平均粒径为166.02 μm,其中橄榄石为8.34 μm,斜长石为196.31 μm,熔融玻璃为44.21 μm,一定程度上表明它们对太空风化的响应存在差异(图10)。
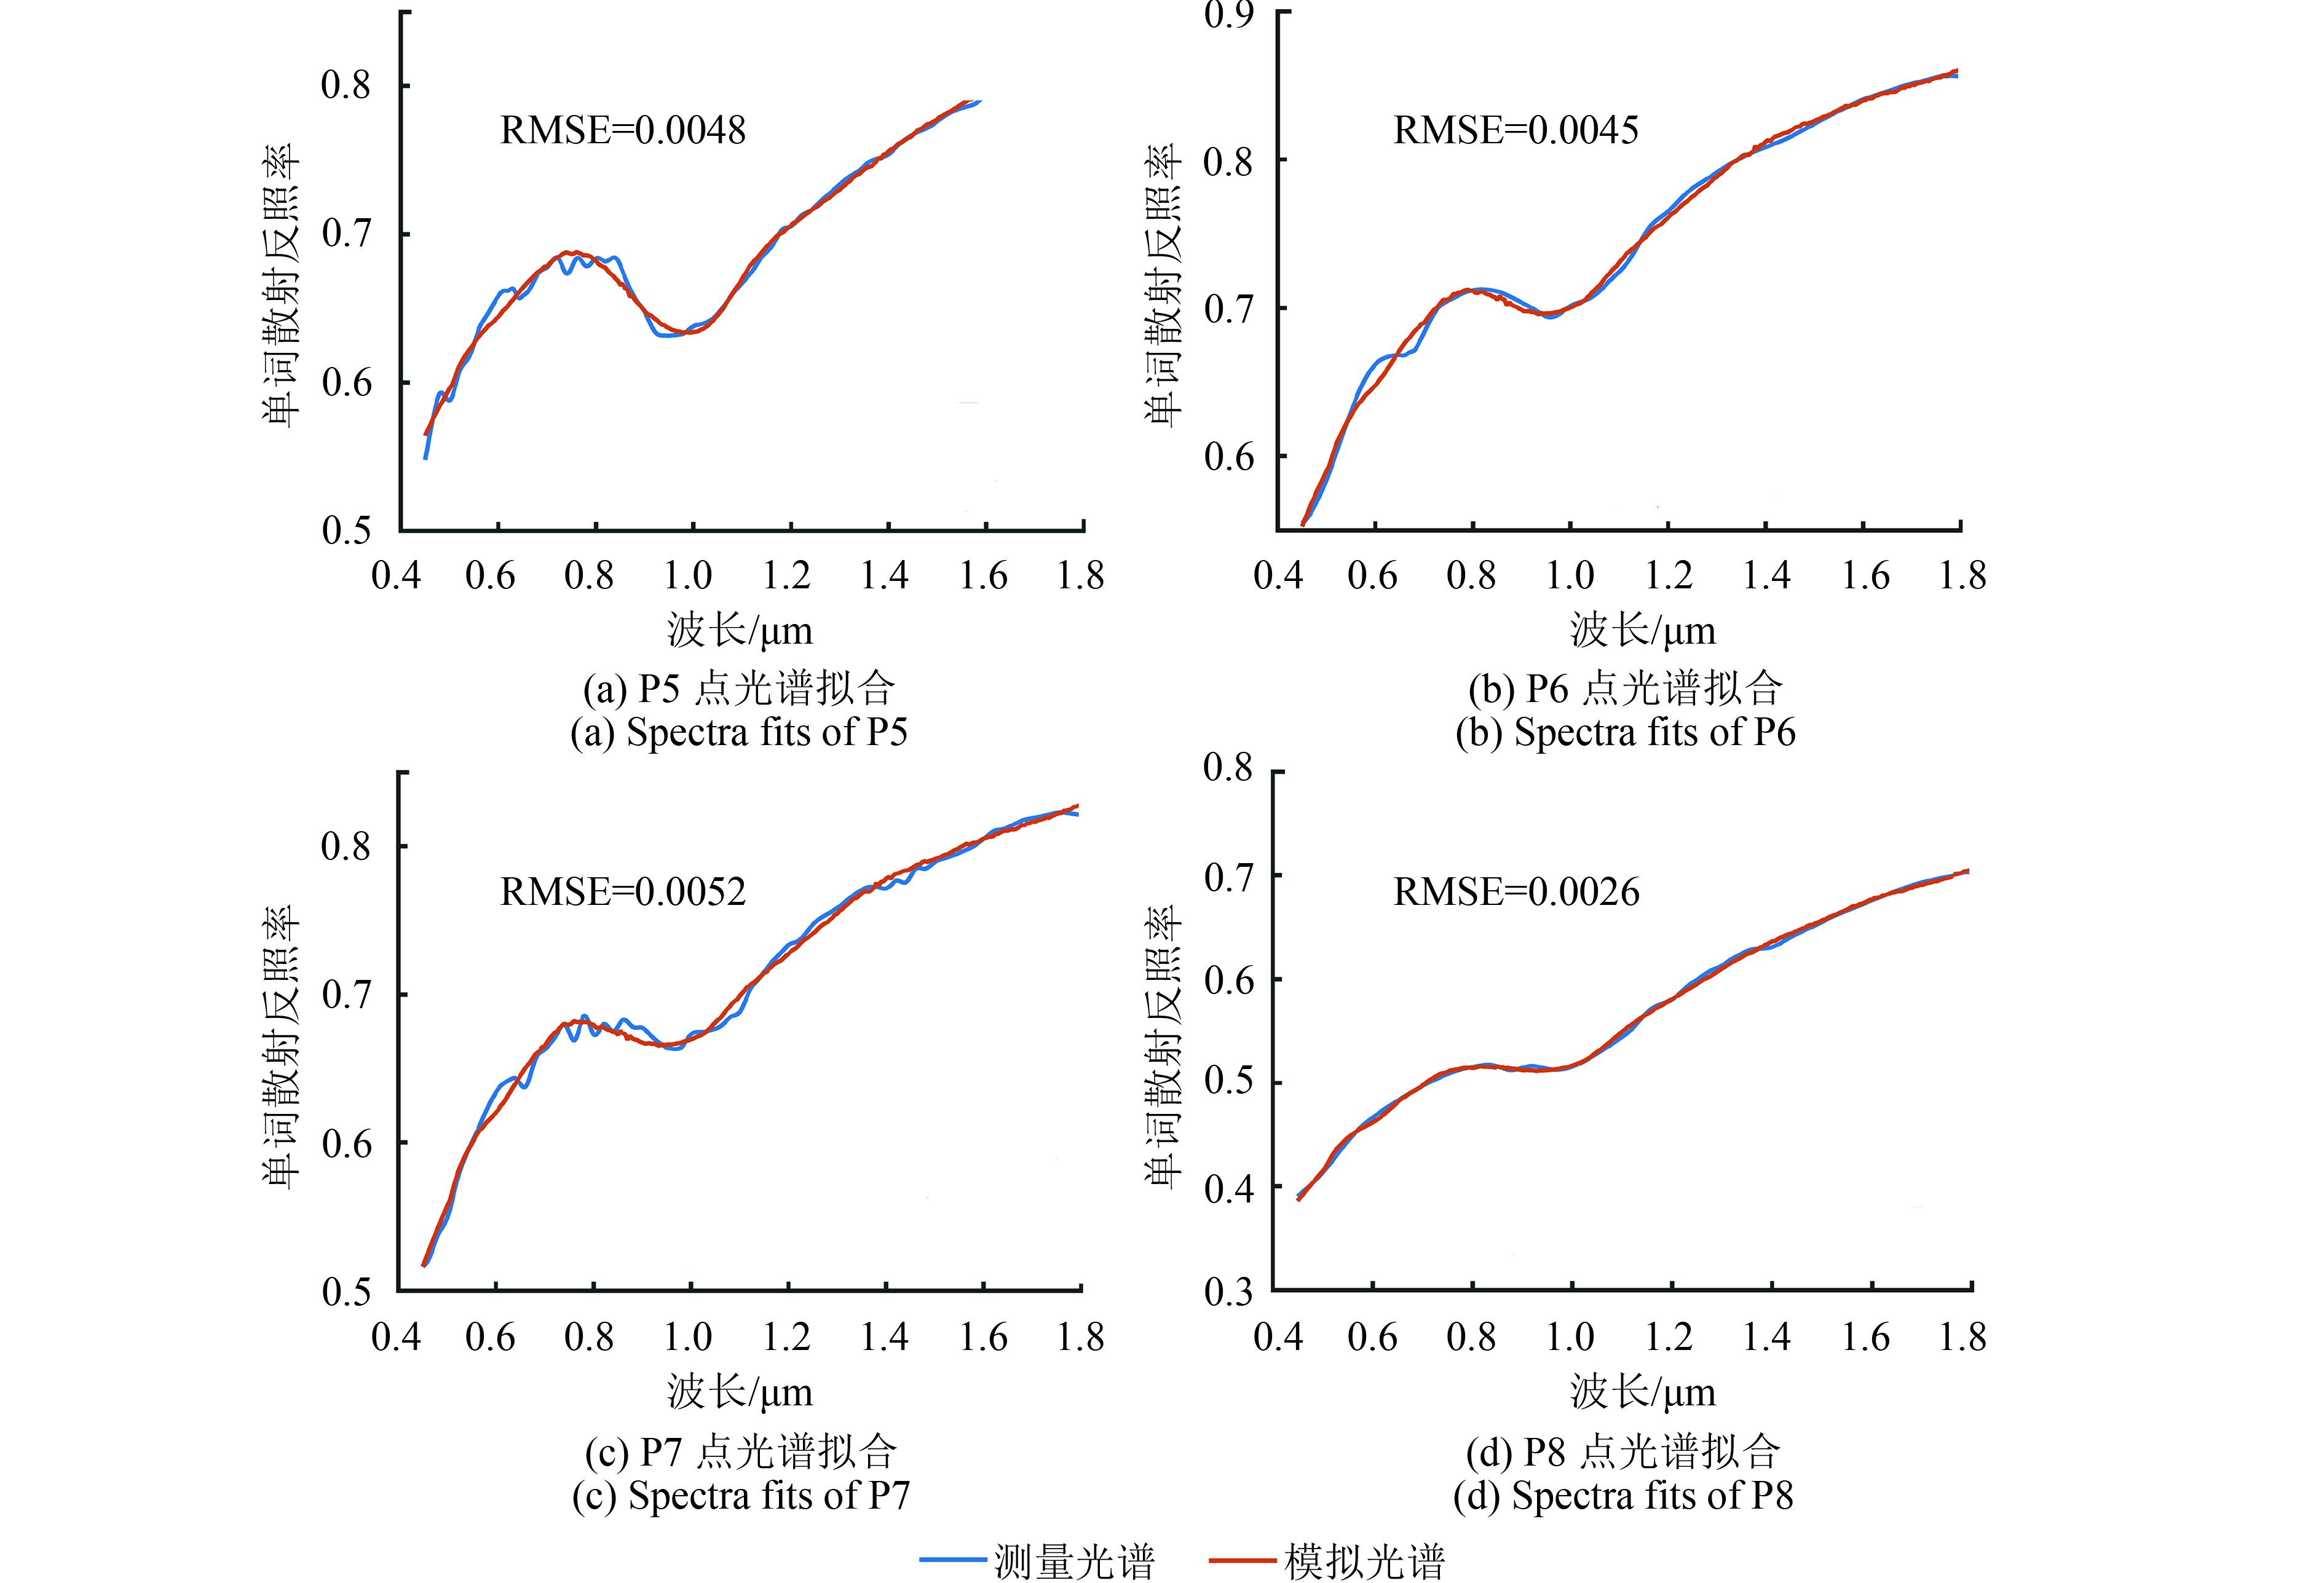
表 3 玉兔号观测点矿物丰度反演结果
Table 3 the results of minerals abundance of Yutu measurements
| P5 | P6 | P7 | P8 | |
| 辉石 | 20 | 33.9 | 31.8 | 26.7 |
| 橄榄石 | 7.1 | 2.0 | 2.7 | 6.3 |
| 斜长石 | 48.6 | 34.2 | 27.8 | 45.4 |
| 熔融玻璃 | 24.3 | 29.9 | 36.2 | 21.5 |
| 钛铁矿 | 0 | 0 | 1.5 | 0 |
从本研究与其他相关研究(Zhang 等,2015;Ling 等,2015)的对比看(表4),在丰度值上有较大的差别,主要原因为:(1)本研究将熔融玻璃作为了一个端元,因为在月球表面熔融玻璃的含量相对较高,LSCC(Lunar Soil Characterization Consortium)月海样品的成分分析结果中,熔融玻璃的含量为52.84±7.79 %,最高可达70.27%(Pieters 等,2000)。(2) 本研究用的是反射率光谱,Zhang 等(2015) 在反演矿物含量时采用的是去完连续统后的光谱,因此在一定程度上弱化了反照率差异造成的影响,其只分析了橄榄石、单斜辉石、斜方辉石及斜长石的相对含量;Ling等(2015)对特征位置利用MGM方法进行了半定量的分析。(3)本研究将矿物颗粒大小也作为了自由变量,同时考虑了太空风化的影响。
表 4 与相关研究结果对比
Table 4 Comparison with related study
| P6-C1 | P6-C2 | P6 | P8-C1 | P8-C2 | P8 | |
| 辉石 | 63±5 | 49 | 33.9 | 53 | 31 | 26.7 |
| 橄榄石 | 15±1 | 10 | 2.0 | 23 | 30 | 6.3 |
| 斜长石 | 17±6 | 33 | 34.2 | 19 | 32 | 45.4 |
| 熔融玻璃 | — | — | 29.9 | — | — | 21.5 |
| 钛铁矿 | — | 7 | 0 | — | 6 | 0 |
| 注:P6-C1和P8-C1结果参考Zhang等(2015),P6-C2和P8-C2结果参考Ling等(2015),丰度为体积比(vol%)。 | ||||||
5 结 论
嫦娥三号任务中玉兔号携带的成像光谱仪获取了非常有价值的月壤实地测量光谱数据,从数据中得到矿物的类型、含量以及粒径分布对于进一步的理解月球演化历史有极其重要的意义。本文提出联合辐射传输模型和稀疏光谱分解算法进行矿物丰度及粒径分布反演的方法,并成功用于了玉兔号测量光谱数据的信息提取。首先利用辐射传输模型计算出玉兔号测量光谱和不同颗粒大小矿物端元的单次散射反照率,然后基于稀疏光谱分解算法反演出各矿物端元的丰度及其粒径分布曲线。
通过对实验室测量光谱的分析表明,本文方法可以很好地反演出混合物中的矿物丰度以及各端元的粒径分布。着陆点是年龄为3.5—2.0 Ga的月海玄武岩单元(Zhang 等,2015),Apollo采集的月海样本分析(Heiken 等,1991)显示具有大量的玻璃,16.3 % 的斜长石和18.6%的辉石及少量的橄榄石(~3.4 %)。本文玉兔号测量数据结果表明,着陆点附近主要的物质为斜长石、辉石、熔融玻璃和橄榄石,它们在4个观测点的平均丰度分别为39 %、28.1 %、28 %、4.5 %,与Apollo样品分析结果的相对含量比较一致。辉石平均粒径为166.02 μm,橄榄石为8.34 μm,斜长石为196.31 μm,熔融玻璃为44.21 μm,一定程度上表明了各矿物所受太空风化的程度不同(Pieter 等,1993)。另外,本文方法在利用月球轨道高光谱遥感数据进行矿物识别和定量反演研究中具有很大的应用价值。
参考文献(References)
-
Bell P M, Mao H K and Weeks R A. 1976. Optical spectra and electron paramagnetic resonance of lunar and synthetic glasses: a study of the effects of controlled atmosphere, composition, and temperature//Proceedings of the 7th Lunar Science Conference. New York: Pergamon Press
-
Bioucas-Dias J M and Figueiredo M A T. 2010. Alternating direction algorithms for constrained sparse regression: application to hyperspectral unmixing//Proceedings of the 2010 2nd Workshop on Hyperspectral Image and Signal Processing: Evolution in Remote Sensing. Reykjavik, Iceland: IEEE [DOI: 10.1109/WHISPERS.2010.5594963]
-
Clark R N, King T V V, Klejwa M, Swayze G A and Vergo N. 1990. High spectral resolution reflectance spectroscopy of minerals. Journal of Geophysical Research, 95 (B8): 12653–12680. [DOI: 10.1029/JB095iB08p12653]
-
Combe J P, McCord T B, Hayne P O and Paige D A. 2011. Mapping of lunar volatiles with moon mineralogy mapper spectra: a challenge due to thermal emission//Proceedings of EPSC-DPS Joint Meeting 2011. Nantes, France: COPERNICUS
-
Egan W G and Hilgeman T. 1975. The interstellar medium: UV complex index of refraction of several candidate materials. The Astronomical Journal, 80 (8): 587–594. [DOI: 10.1086/111782]
-
Gabay D and Mercier B. 1976. A dual algorithm for the solution of nonlinear variational problems via finite element approximation. Computers and Mathematics with Applications, 2 (1): 17–40. [DOI: 10.1016/0898-1221(76)90003-1]
-
Hapke B. 1981. Bidirectional reflectance spectroscopy: 1. theory. Journal of Geophysical Research, 86 (B4): 3039–3054. [DOI: 10.1029/Jb086ib04p03039]
-
Hapke B. 2001. Space weathering from Mercury to the asteroid belt. Journal of Geophysical Research, 106 (E5): 10039–10073. [DOI: 10.1029/2000je001338]
-
Hapke B. 2012. Theory of Reflectance and Emittance Spectroscopy. 2nd ed. New York: Cambridge University Press
-
He Z P, Wang B Y, Lv G, Li C L, Yuan L Y, Xu R, Chen K and Wang J Y. 2014. Visible and near-infrared imaging spectrometer and its preliminary results from the Chang’E 3 project. Review of Scientific Instruments, 85 (8): 083104 [DOI: 10.1063/1.4891865]
-
Heiken G H, Vaniman D T and French B M. 1991. Lunar Sourcebook: a User’s Guide to the Moon. Cambridge: Cambridge University Press
-
Iordache M D, Bioucas-Dias J M and Plaza A. 2011. Sparse unmixing of hyperspectral data. IEEE Transactions on Geoscience and Remote Sensing, 49 (6): 2014–2039. [DOI: 10.1109/Tgrs.2010.2098413]
-
Li S and Li L. 2011. Radiative transfer modeling for quantifying lunar surface minerals, particle size, and submicroscopic metallic Fe. Journal of Geophysical Research, 116 (E9): E09001 [DOI: 10.1029/2011je003837]
-
Li S and Milliken R E. 2015. Estimating the modal mineralogy of eucrite and diogenite meteorites using visible–near infrared reflectance spectroscopy. Meteoritics and Planetary Science, 50 (11): 1821–1850. [DOI: 10.1111/maps.12513]
-
Ling Z C, Jolliff B L, Wang A L, Li C L, Liu J Z, Zhang J, Li B, Sun L Z, Chen J, Xiao L, Liu J J, Ren X, Peng W X, Wang H Y, Cui X Z, He Z P and Wang J Y. 2015. Correlated compositional and mineralogical investigations at the Chang’e-3 landing site. Nature Communications, 6 : 8880 [DOI: 10.1038/ncomms9880]
-
Lucey P G. 1998. Model near‐infrared optical constants of olivine and pyroxene as a function of iron content. Journal of Geophysical Research, 103 (E1): 1703–1713. [DOI: 10.1029/97je03145]
-
Lucey P G. 2004. Mineral maps of the moon. Geophysical Research Letters, 31 (8): L08701 [DOI: 10.1029/2003gl019406]
-
Mustard J F and Pieters C M. 1989. Photometric phase functions of common geologic minerals and applications to quantitative analysis of mineral mixture reflectance spectra. Journal of Geophysical Research, 94 (B10): 13619–13634. [DOI: 10.1029/Jb094ib10p13619]
-
Papike J, Taylor L A and Simon S. 1991. Lunar minerals//Heiken G H, Vaniman D T and French B M, eds. Lunar Sourcebook. New York: Cambridge University Press
-
Pieter C M, Fischer E M and Basu O R A. 1993. Optical effects of space weathering: the role of the finest fraction. Journal of Geophysical Research, 98 (E11): 20817–20824. [DOI: 10.1029/93je02467]
-
Pieters C M, Stankevich D G, Shkuratov Y G and Taylor L A. 2002. Statistical analysis of the links among lunar mare soil mineralogy, chemistry, and reflectance spectra. Icarus, 155 (2): 285–298. [DOI: 10.1006/icar.2001.6749]
-
Pieters C M, Taylor L A, Noble S K, Keller L P, Hapke B, Morris R V, Allen C C, McKay D S and Wentworth S. 2000. Space weathering on airless bodies: resolving a mystery with lunar samples. Meteoritics and Planetary Science, 35 (5): 1101–1107. [DOI: 10.1111/j.1945-5100.2000.tb01496.x]
-
Robertson K M, Milliken R E and Li S. 2016. Estimating mineral abundances of clay and gypsum mixtures using radiative transfer models applied to visible-near infrared reflectance spectra. Icarus, 277 : 171–186. [DOI: 10.1016/j.icarus.2016.04.034]
-
Roush T L. 2003. Estimated optical constants of the Tagish Lake meteorite. Meteoritics and Planetary Science, 38 (3): 419–426. [DOI: 10.1111/j.1945-5100.2003.tb00277.x]
-
Shkuratov Y, Starukhina L, Hoffmann H and Arnold G. 1999. A model of spectral albedo of particulate surfaces: implications for optical properties of the moon. Icarus, 137 (2): 235–246. [DOI: 10.1006/icar.1998.6035]
-
Shuai T, Zhang X, Zhang L F and Wang J N. 2013. Mapping global lunar abundance of plagioclase, clinopyroxene and olivine with Interference Imaging Spectrometer hyperspectral data considering space weathering effect. Icarus, 222 (1): 401–410. [DOI: 10.1016/j.icarus.2012.11.027]
-
Taylor L A, Pieters C, Keller L P, Morris R V, McKAY D S, Patchen A and Wentworth S. 2001a. The effects of space weathering on Apollo 17 mare soils: petrographie and chemical characterization. Meteoritics and Planetary Science, 36 (2): 285–299. [DOI: 10.1111/j.1945-5100.2001.tb01871.x]
-
Taylor L A, Pieters C M, Keller L P, Morris R V and McKay D S. 2001b. Lunar mare soils: space weathering and the major effects of surface‐correlated nanophase Fe. Journal of Geophysical Research, 106 (E11): 27985–27999. [DOI: 10.1029/2000je001402]
-
Wu Y Z and Hapke B. 2018. Spectroscopic observations of the Moon at the lunar surface. Earth and Planetary Science Letters, 484 : 145–153. [DOI: 10.1016/j.jpgl.2017.12.003]
-
Xiao L, Zhu P M, Fang G Y, Xiao Z Y, Zou Y L, Zhao J N, Zhao N, Yuan Y F, Qiao L, Zhang X P, Zhang H, Wang J, Huang J, Huang Q, He Q, Zhou B, Ji Y C, Zhang Q Y, Shen S X, Li Y X and Gao Y Z. 2015. A young multilayered terrane of the northern Mare Imbrium revealed by Chang’E-3 mission. Science, 347 (6227): 1226–1229. [DOI: 10.1126/science.1259866]
-
Yan B K, Wang R S, Gan F P and Wang Z C. 2010. Minerals mapping of the lunar surface with Clementine UVVIS/NIR data based on spectra unmixing method and Hapke model. Icarus, 208 (1): 11–19. [DOI: 10.1016/j.icarus.2010.01.030]
-
Zhang H, Yang Y Z, Yuan Y, Jin W D, Lucey P G, Zhu M H, Kaydash V G, Shkuratov Y G, Di K C, Wan W H, Xu B, Xiao L, Wang Z W and Xue B. 2015. In situ optical measurements of Chang'E‐3 landing site in Mare Imbrium: 1. mineral abundances inferred from spectral reflectance. Geophysical Research Letters, 42 (17): 6945–6950. [DOI: 10.1002/2015gl065273]
-
Zhang J H, Yang W, Hu S, Lin Y T, Fang G Y, Li C L, Peng W X, Zhu S Y, He Z P, Zhou B, Lin H Y, Yang J F, Liu E H, Xu Y C, Wang J Y, Yao Z X, Zou Y L, Yan J and Ouyang Z Y. 2015. Volcanic history of the Imbrium basin: a close-up view from the lunar rover Yutu. Proceedings of the National Academy of Sciences of the United States of America, 112 (17): 5342–5347. [DOI: 10.1073/pnas.1503082112]