
|
收稿日期: 2019-03-05; 预印本: 2019-05-30
基金项目: 湖南省自然科学基金(编号:2018JJ3348);湖南省大学生研究性学习和创新性实验计划项目(编号:201710542032);国家自然科学基金(编号:41830108);中国国家留学基金(编号:201806725009);湖南省教育厅科学研究项目(编号:17C0952)
第一作者简介: 胡顺石,1984年生,男,讲师,研究方向为资源环境遥感与灾害遥感、遥感大数据应用。E-mail:hufrank@163.com
通信作者简介: 孙雪剑,1987年生,男,助理研究员,研究方向为高光谱数据融合。E-mail:sunxj@radi.ac.cn
|
摘要
植被指数是地球陆表植被覆盖度和植被活力的指示因子,对环境监测、植被理化参量估算等应用研究有重要的意义。基于植被的反射光谱特征,通过遥感数据波段的组合,可以计算得到遥感植被指数。传统的植被指数如NDVI、EVI等仅利用有限波段信息的线性或非线性组合构建而成,没有充分利用遥感传感器所提供的多波段遥感信息,通用归一化植被指数UNVI(Universal Normalized Vegetation Index)充分利用了遥感传感器提供的多波段植被光谱信息,因此在反演植被叶绿素、生物量等植被理化参量上较其他传统植被指数更具优势。为方便UNVI指数的计算,本文基于IDL语言开发了UNVI软件插件,可直接作为ENVI商业遥感软件进行调用,并可满足多个传感器的UNVI计算需求。为了验证UNVI的应用效果,以植被总初级生产力GPP(Gross Primary Productivity)估算为例,比较了不同植被指数估算GPP的效果,结果表明:基于UNVI估算的GPP与通量站点获得的GPP具有较高的相关性(相关系数R2为0.79),验证了UNVI在GPP估算方面的优势。本文提供的UNVI软件插件可为遥感研究和应用人员提供便捷的计算工具。
关键词
Landsat, MODIS, 植被指数, UNVI, IDL语言, GPP
Abstract
The Universal Normalized Vegetation Index (UNVI) is an improved Vegetation Index (VI) based on the Universal Pattern Decomposition Method (UPDM). However, UPDM-based UNVI involves the calculation of a complex coefficient matrix, which is inconvenient for users. We reformulated the computation of the coefficients of the UPDM without changing its main mathematical formulation to generalize the UNVI in a user friendly manner. We derived new matrices and developed a UNVI software using IDL to facilitate the convenient calculation of the UNVI based on data from MODIS and Lands at TM, ETM, and OLI satellite sensors. Vegetation information derived from satellite data is highly significant to the operational monitoring of the Earth’s land cover. VIs are determined traditionally by calculating directly the algebraic combinations of the reflectance at different bands, that is, from the visible to the SWIR spectral range. These VIs (e.g., NDVI and EVI) were calculated by limited reflectance bands and might cause loss of information. All available data are considered as input variables in UPDM-based UNVI in the calculation of VIs. We provided the code and the coefficient matrices in this study to make UNVI usable for all users and multiple sensors. For the UPDM-based UNVI, the spectrum of each pixel is expressed as the linear sum of three fixed standard spectral patterns (i.e., water, vegetation, and soil), along with a supplementary one (i.e., yellow leaves), associated with particular objects found on land. The goal of UPDM is to transform the reflectance values of the n bands of a target pixel into three standard coefficients, along with a supplementary one, using standard spectral decomposition patterns. We derived the matrices to facilitate the convenient calculation of the UNVI based on data from the MODIS and Lands at TM, ETM, and OLI satellite sensors. We also provided the software and coefficient matrices of UNVI. We assessed the capabilities of the UNVI to evaluate the Gross Primary Production (GPP) of vegetation compared with the GPP data derived from the flux tower sites. The GPP estimated by UNVI used in this model was GPP∝PAR×VI×VI. The GPP estimated by UNVI has a higher correlation with the GPP obtained from the flux sites. The R2 between the GPP from the flux sites and that estimated by UNVI is above 0.79 for the mixed forest and deciduous broad-leaved forest vegetation types. This result is consistent with the strong correlation between UNVI and vegetation physicochemical parameters. Thus, UNVI could be applied in estimating vegetation GPP. In this study, we reformulated the computation of the coefficients of UPDM without changing its main mathematical formulation and provided the index, which was termed UNVI. We also derived new matrices to facilitate the convenient calculation of the UNVI based on data from MODIS and the Landsat-TM, ETM, and OLI satellite sensors. The UNVI could be obtained directly by multiplying the coefficient matrix M and the surface reflectance, which would result in a user friendly computation of UNVI. We developed a software using IDL to facilitate the calculation of the UNVI from different remote sensing images. We applied UNVI in the GPP estimation to introduce the operation of the UNVI software. The results show that the UNVI-based GPP estimation has a high correlation with the GPP obtained from the flux sites, with coefficient R2 above 0.79. Thus, UNVI can be used for vegetation monitoring. The UNVI software provides the important technical support for studies and applications for the remote sensing inversion of vegetation physicochemical parameters and estimation of vegetation GPP.
Key words
Landsat, MODIS, vegetation index, UNVI, IDL, GPP
1 引 言
植被是地球生态系统的重要组成部分,对调节气候、维持生态系统碳平衡等具有重要的作用。准确地获取植被生长状况对于研究气候变化和环境监测具有重要意义。相对于传统的植被监测方法,遥感技术能够快速无损地实现多尺度植被信息的快速探测。
植被指数是遥感领域普遍使用的一种增强植被信息的方法,通过植被指数能够实现快速、大范围的植被信息提取。传统的植被指数是根据植被光谱的反射与吸收特征,对不同反射率波段进行线性或非线性组合,得到能反应植被理化参数的指示因子(Baig 等,2014)。例如:NDVI(Normalized Difference Vegetation Index)(Tucker,1979),EVI(Enhanced Vegetation Index)(Huete 等,1997)等传统植被指数。为了方便利用遥感影像计算得到植被指数,部分遥感图像处理软件(例如:ENVI软件等)已有嵌入了针对不同传感器的植被指数模块,如NDVI,用户可以很方便地计算得到所需要的植被指数。由于传统的植被指数仅利用了部分反射率波段,并没有充分利用多光谱或高光谱数据所包含的反射率信息。为了更好地利用多光谱或高光谱数据中携带的地物光谱信息,提高基于不同传感器获得的植被指数的一致性,Zhang 等(2007a,2007b)基于通用光谱模式分解UPDM(Universal Pattern Decomposition Method)提出了通用归一化植被指数VIUPD(Vegetation Index Based on UPDM),该指数在植被叶绿素、生物量等植被理化参量反演以及植被干旱监测中较其他传统植被指数具有明显的优势(Jiao 等,2016;Shen 等,2008)。为了便于读者理解该指数并使计算过程优化,Zhang 等(2019)对VIUPD指数的计算过程进行了重新推导,并计算得到了针对不同传感器的系数矩阵,将该指数定义为UNVI(Universal Normalized Vegetation Index)。
为方便不同遥感影像的UNVI指数计算,本文基于UNVI指数算法原理,推导并计算了不同传感器的UNVI系数矩阵。同时,利用IDL语言开发了适用于多种传感器的UNVI软件插件,此软件插件可方便快速地计算基于不同传感器遥感影像的UNVI指数。为了比较UNVI与传统植被指数的差异,应用此软件插件对比分析了UNVI相较于其他传统植被指数(比如NDVI和EVI)在植被总初级生产力GPP(Gross Primary Productivity)估算方面的潜在优势,表明UNVI指数在植被遥感监测中具有广阔应用前景。
2 原理与方法
2.1 UNVI算法原理
植被指数UNVI(Universal Normalized Vegetation Index)是基于UPDM算法建立起来的(Zhang 等,2007b,2010),UPDM假设任何一种地物光谱可以由水、植被、土壤这3种样本的标准光谱线性组合表示,并可根据研究目的需要,增加附加模式光谱,使光谱分解精度更高 (Zhang 等,2007a,2007b)。
UPDM公式如下
| ${{R}}(i) \to (C_{\rm{w}} \cdot {{P}}_{\rm{w}}(i) + C_{\rm{v}} \cdot {{P}}_{\rm{v}}(i) + C_{\rm{s}} \cdot {{P}}_{\rm{s}}(i) + C_4 \cdot {{P}}_4(i))$ | (1) |
式中,
对式(1)进行数学变换,可得UPDM的系数矩阵计算公式
| $ {{C}}{\rm{ = (}}{{{P}}^{\rm{T}}}{{P}}{{\rm{)}}^{ - 1}}{{{P}}^{\rm{T}}}{{R}} $ | (2) |
式中,C为水体、植被、土壤、附加参数各样本对应的UPDM参数,P是UPDM的4种标准样本归一化反射率矩阵,可以利用地面光谱仪器测量的标准水体、植被、土壤的光谱反射率数据,在450—2500 nm连续区间上(不包括大气严重吸收的部分波段)进行归一化得到;R为原始卫星数据光谱反射率;
基于UPDM计算植被指数需要计算复杂矩阵P,为方便计算,本研究通过推导获得简化的矩阵M,M的计算公式如下
| $ {{{M}}_{\rm{k}}}(i) = \frac{{\int\limits_{{{\textit{λ}} _{\rm{s}}}(i)}^{{{\textit{λ}} _{\rm{e}}}(i)} {{{{P}}_{\rm{k}}}({\textit{λ}}){{{S}}_i}({\textit{λ}}){\rm{d}}{\textit{λ}} } }}{{\int\limits_{{{\textit{λ}} _{\rm{s}}}(i)}^{{{\textit{λ}} _{\rm{e}}}(i)} {{{{S}}_i}({\textit{λ}}){\rm{d}}{\textit{λ}} } }} $ | (3) |
式中,
| ${{C}}={{MR}}$ | (4) |
式中,
UNVI植被指数计算公式为
| $ {\rm{UNVI }} = ({C_{\rm{v}}} - a{C_{\rm{s}}} - {C_4})/\left({{C_{\rm{w}}} + {C_{\rm{v}}} + {C_{\rm{s}}}} \right) $ | (5) |
式中,
2.2 UNVI软件说明
为方便UNVI的计算,研究团队基于IDL语言开发了UNVI软件插件(下载地址:http://www.hrs-cas.com/uploads/userup/UNVI.rar[2019-03-05]),该插件适用于5.0及以上版本的ENVI软件。若在ENVI5系列操作界面使用该插件,需将.sav文件放置在ENVI安装路径下的extensions文件夹内,然后重启ENVI,在软件界面右侧Extensions目录下即可看到新添加的UNVI计算工具;若在ENVI classic界面下使用该插件,需要将.sav文件放置在ENVI安装路径下的save_add文件夹内,然后重启ENVI,在classic界面的Transform工具栏下即可以看见新添加的UNVI计算工具。本文发布的UNVI.sav插件可满足MODIS,Landsat TM,Landsat ETM+和Landsat OLI共4种传感器的UNVI计算需要。
为了方便使用者了解UNVI软件原理,方便使用者修改软件,以上下载网站还提供了UNVI指数的IDL源代码供用户下载。
3 UNVI软件使用
3.1 UNVI软件功能介绍
本研究根据MODIS,Landsat TM,ETM+和OLI传感器的光谱响应函数,计算出各个传感器相应的系数矩阵M。对于MODIS传感器,利用波段1—7计算UNVI;对于Landsat TM和ETM+传感器,利用波段1—5和波段7计算UNVI,波段6为热红外波段,不参与UNVI计算;对于Landsat OLI传感器,利用波段2—7计算UNVI,波段1为主要应用于海岸带观测的蓝波段,综合考虑其他传感器的波段设置,波段1没有参与UNVI计算。适用于MODIS,Landsat TM,ETM+和OLI传感器的UNVI系数矩阵M分别见表1—表4。
表 1 基于MODIS传感器的UNVI系数矩阵M
Table 1 The UNVI coefficient matrix M for MODIS
| 波段 | Band 1 | Band 2 | Band 3 | Band 4 | Band 5 | Band 6 | Band 7 |
| M(MODIS) | 0.03 | 0.0296 | 0.1728 | 0.1357 | –0.0294 | –0.0709 | –0.102 |
| –0.1547 | 0.3516 | –0.0076 | –0.005 | 0.199 | –0.0728 | –0.2518 | |
| 0.2566 | –0.2273 | –0.0912 | –0.0182 | –0.0067 | 0.3189 | 0.521 | |
| 0.2216 | 0.0055 | –0.1465 | 0.0572 | 0.0196 | –0.0564 | –0.1011 |
表 2 基于Landsat TM传感器的UNVI系数矩阵M
Table 2 The UNVI coefficient matrix M for Landsat TM
| 波段 | Band 1 | Band 2 | Band 3 | Band 4 | Band 5 | Band 7 |
| M(Landsat TM) | 0.2301 | 0.1169 | –0.0187 | 0.0168 | –0.0927 | –0.0895 |
| –0.0234 | –0.0294 | –0.1392 | 0.5033 | –0.0421 | –0.2364 | |
| –0.1406 | 0.0256 | 0.2809 | –0.2413 | 0.3618 | 0.4985 | |
| –0.1467 | 0.0697 | 0.2196 | 0.0184 | –0.0433 | –0.1216 |
表 3 基于Landsat ETM+传感器的UNVI系数矩阵M
Table 3 The UNVI coefficient matrix M forLandsat ETM+
| 波段 | Band 1 | Band 2 | Band 3 | Band 4 | Band 5 | Band 7 |
| M(Landsat ETM+) | 0.2168 | 0.1242 | –0.0109 | 0.0149 | –0.0915 | –0.0911 |
| –0.0265 | –0.0203 | –0.1453 | 0.5002 | –0.0431 | –0.2329 | |
| –0.1311 | 0.0099 | 0.2855 | –0.2345 | 0.3618 | 0.4952 | |
| –0.1427 | 0.0631 | 0.2189 | 0.0193 | –0.0432 | –0.1196 |
表 4 基于Landsat OLI传感器的UNVI系数矩阵M
Table 4 The UNVI coefficient matrix M for Landsat OLI
| 波段 | Band 2 | Band 3 | Band 4 | Band 5 | Band 6 | Band 7 |
| M(Landsat OLI) | 0.2025 | 0.1314 | –0.0004 | 0.0140 | –0.0891 | –0.0957 |
| –0.0317 | –0.0080 | –0.1400 | 0.4976 | –0.0453 | –0.2312 | |
| –0.1145 | –0.0109 | 0.2724 | –0.2384 | 0.3616 | 0.5062 | |
| –0.1458 | 0.0587 | 0.2269 | 0.0219 | –0.0491 | –0.1151 |
3.2 UNVI插件操作流程
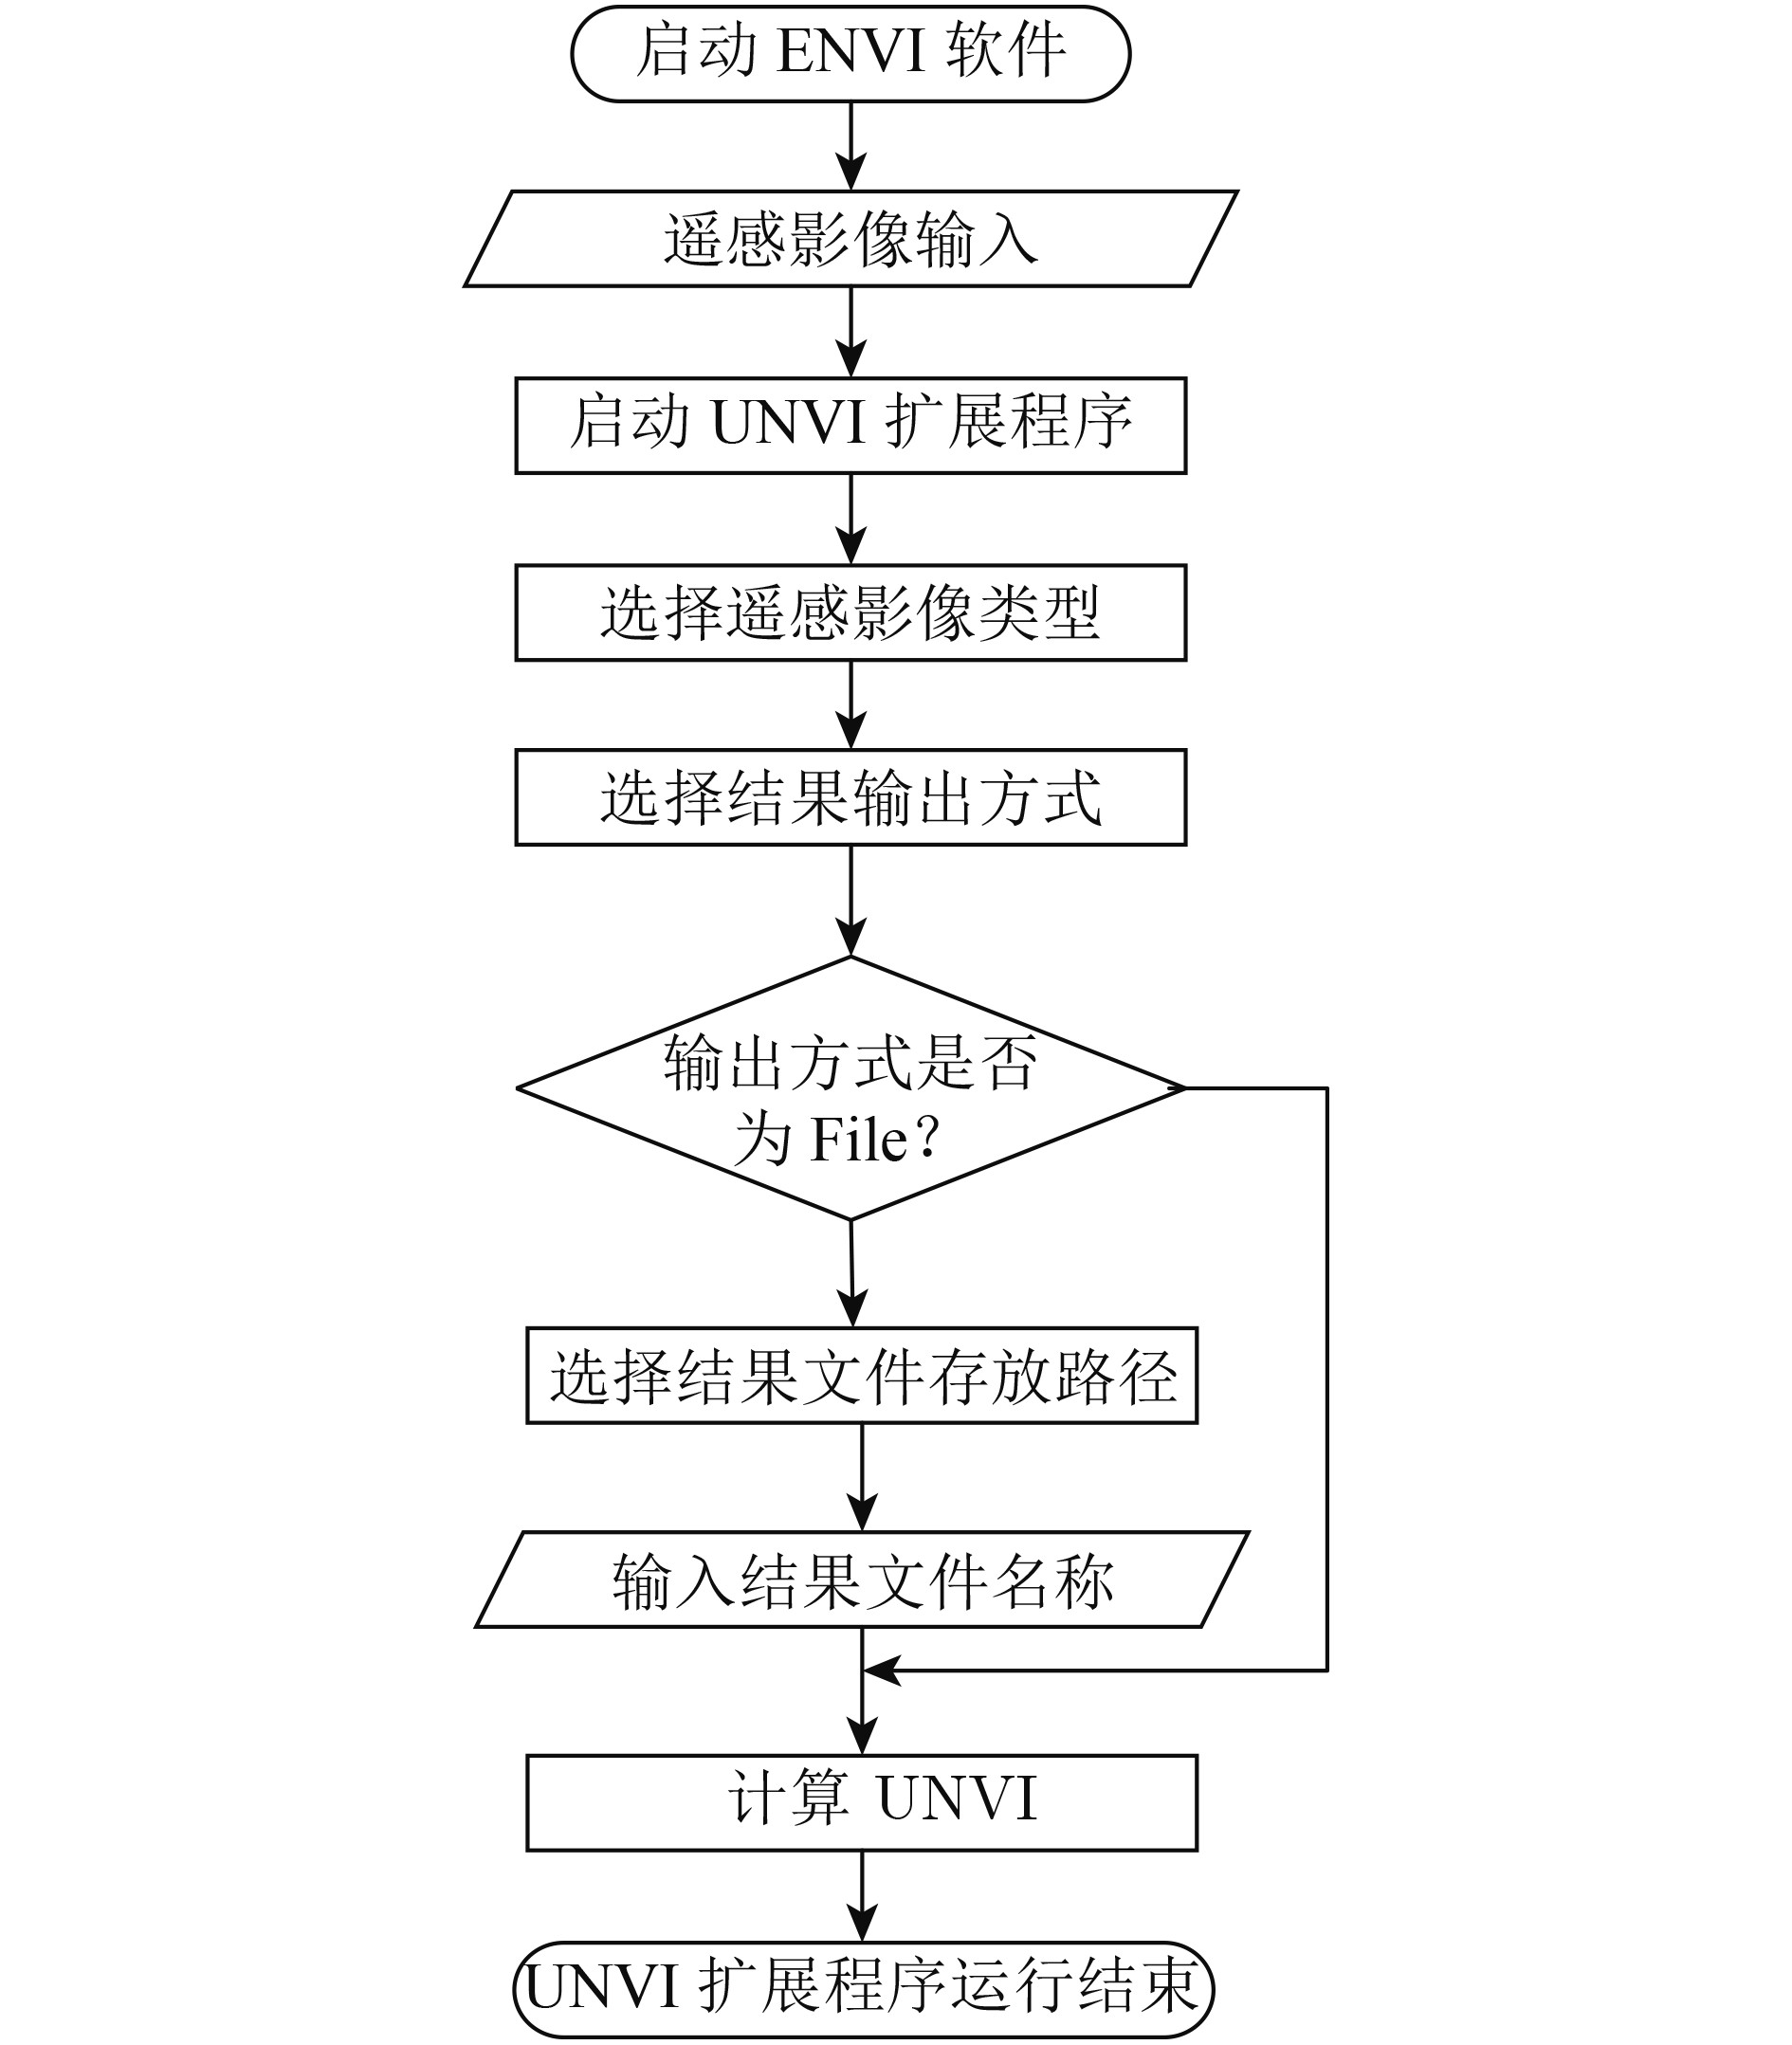
UNVI插件主要包括数据输入、传感器选择、结果输出3个模块,可供选择的传感器有MODIS,Landsat TM,ETM+和OLI,图1为UNVI插件操作流程图。

本文以MODIS数据为例,详细介绍UNVI插件使用流程:
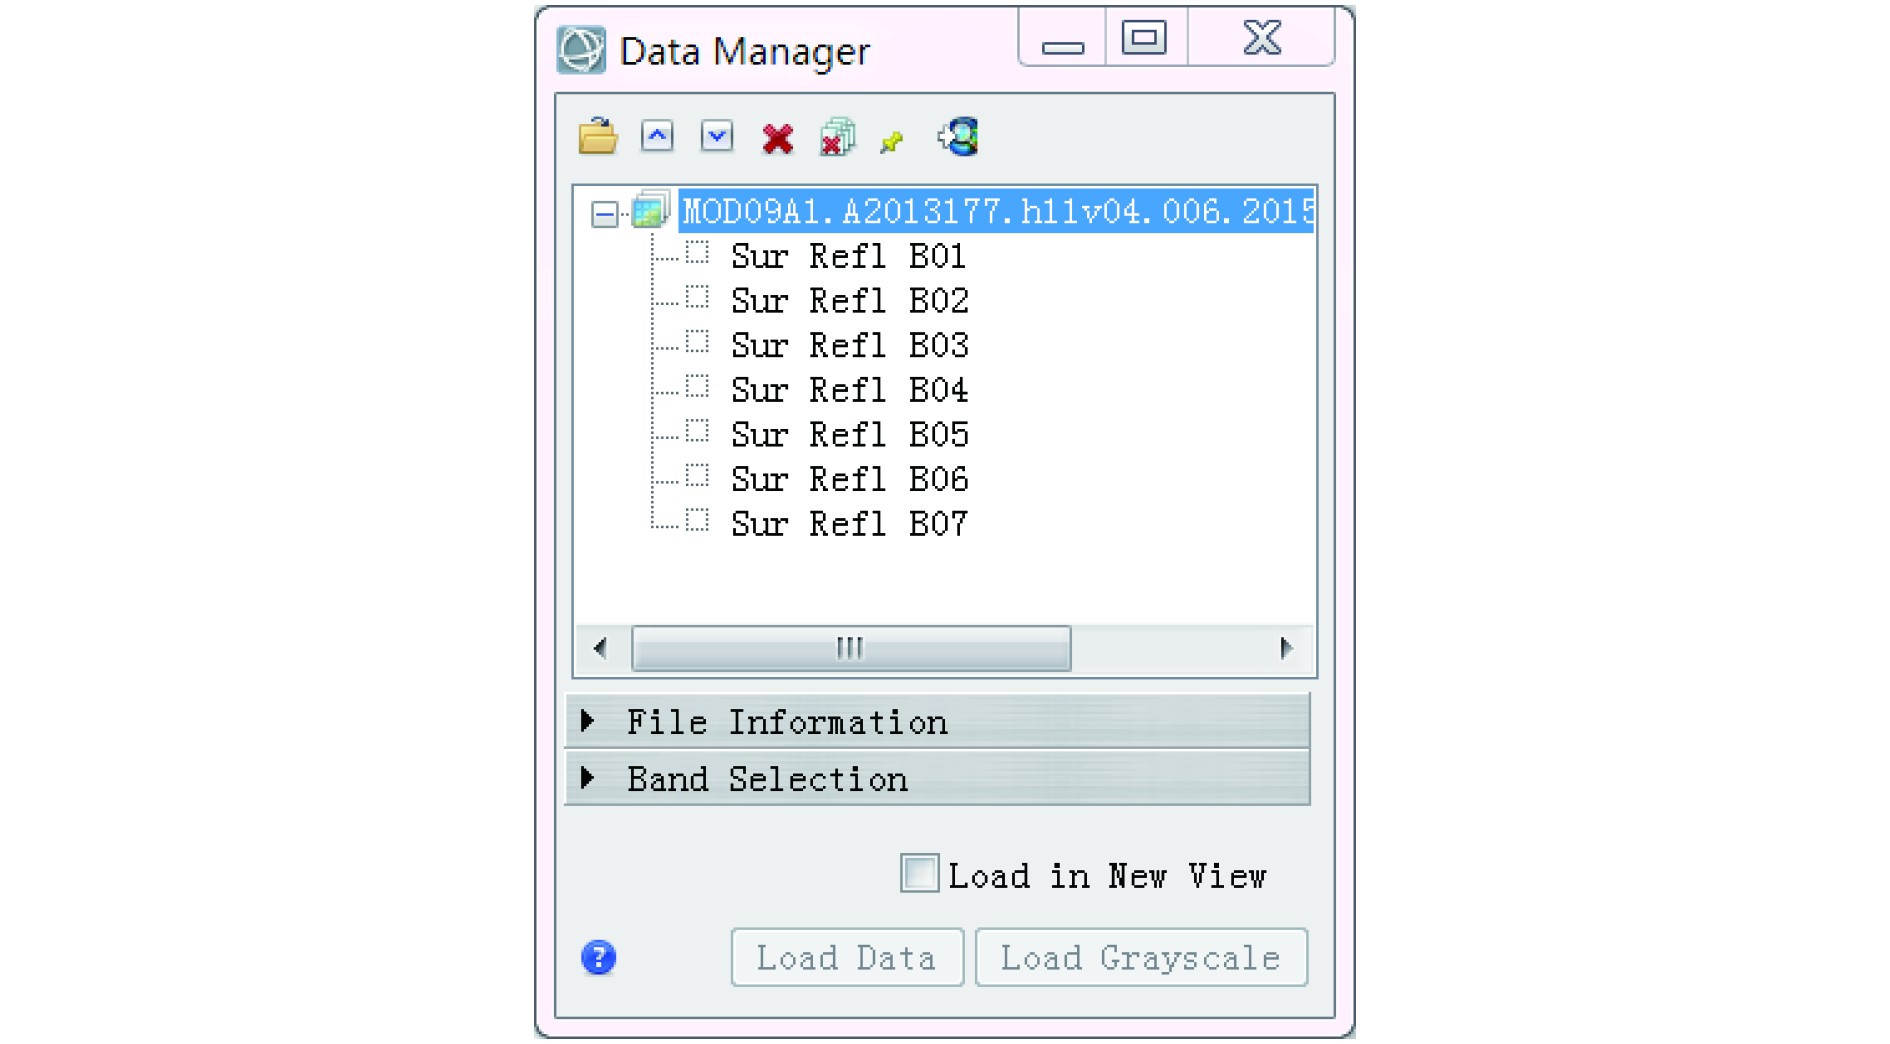
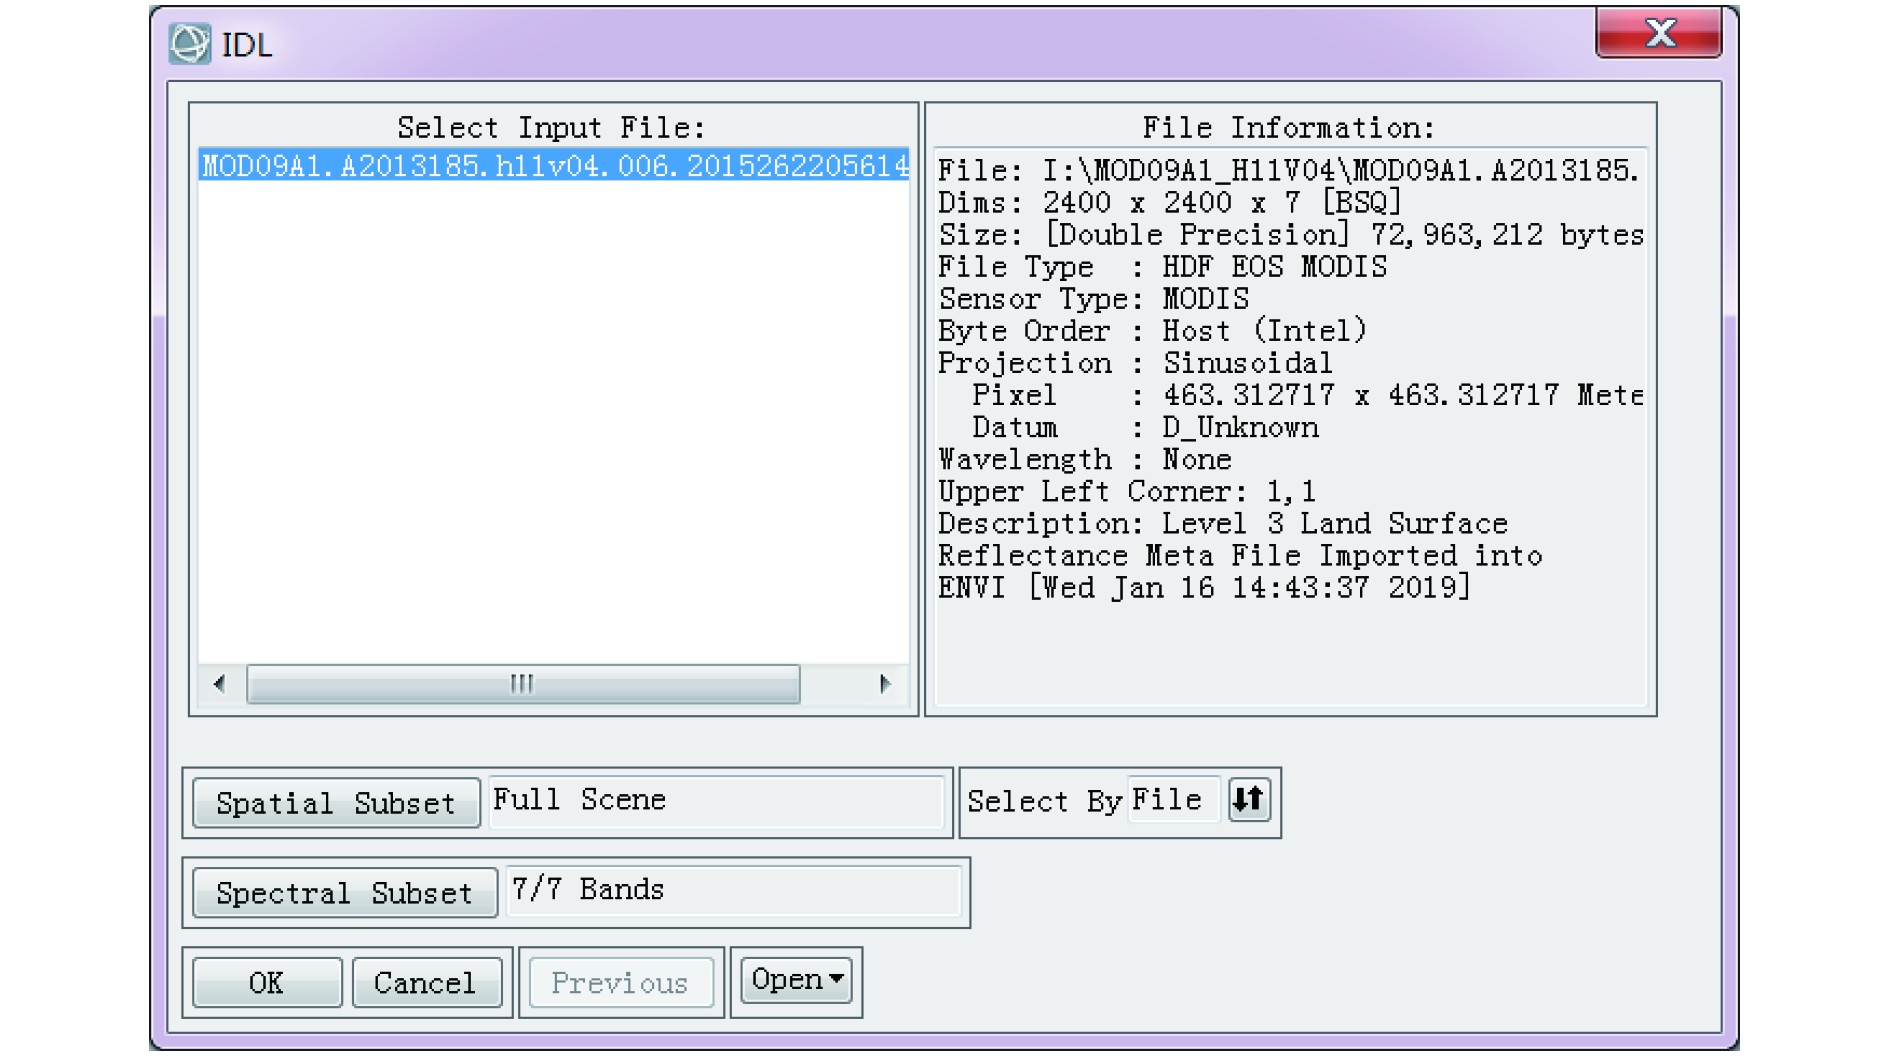
步骤1:用ENVI读取MODIS数据,本文使用的是MOD09A1反射率产品,如图2所示。
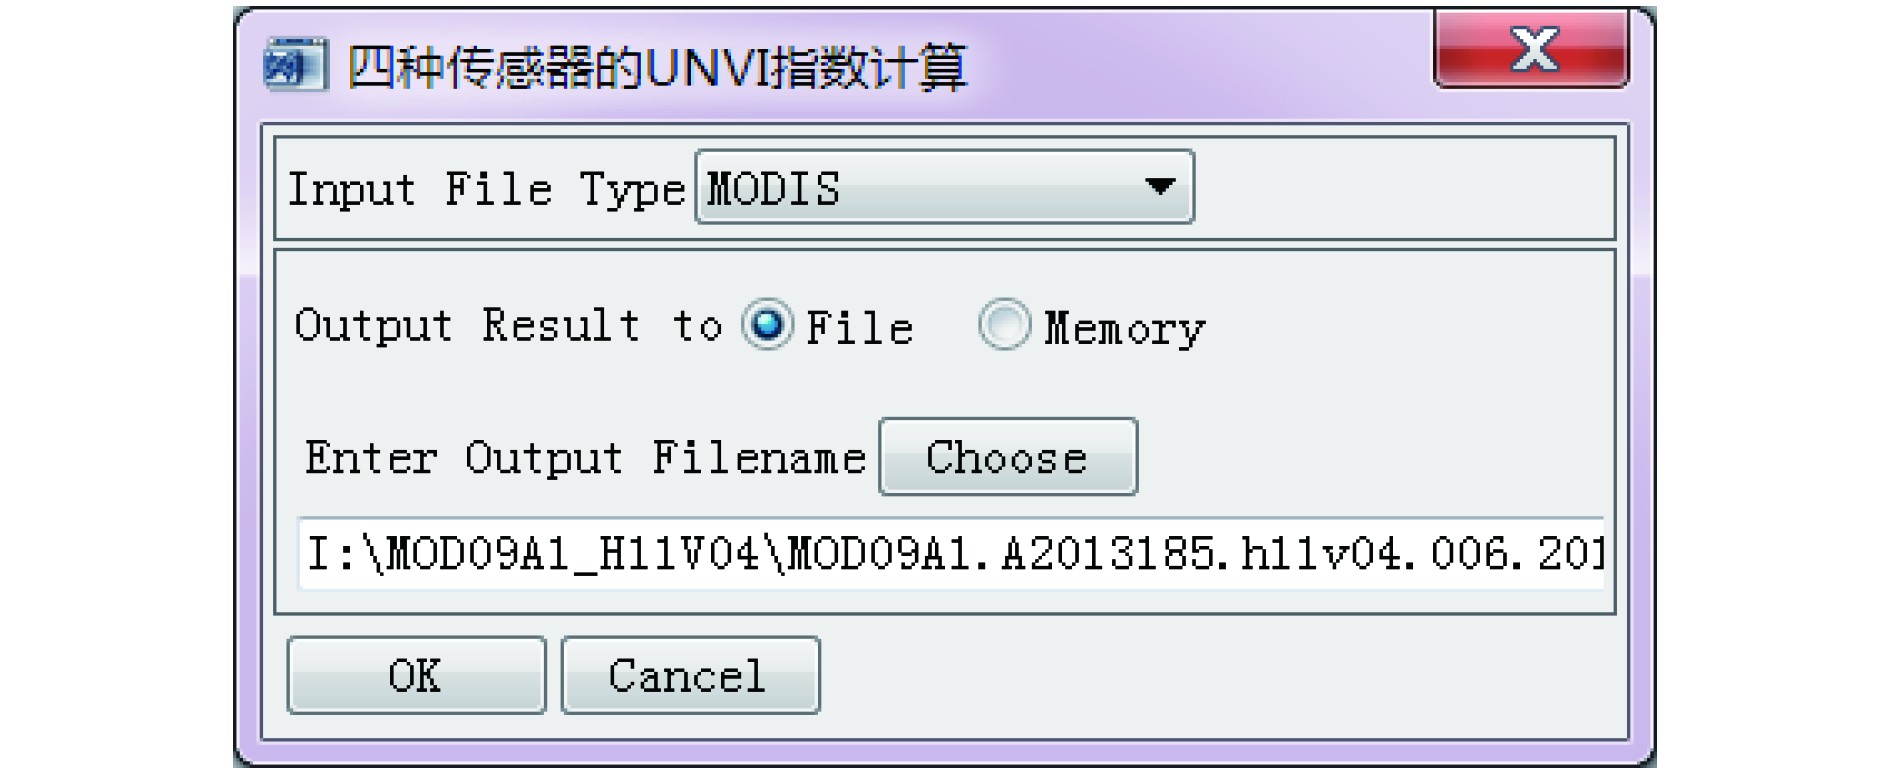
步骤2:启动UNVI扩展程序,选择待处理图像(图3)和文件输出路径(图4)。

3.3 UNVI应用示例
为更好地说明UNVI在反映植被生长状况方面的优势,本研究基于通量站点数据,将UNVI应用于植被总初级生产力估算。本文所使用的通量站点数据来源于FLUXNET 2015数据集,站点名称为US-WCr(45.8059°N,–90.0799°E),所覆盖的植被类型为落叶阔叶林。
本文采用的GPP估算模型是由Wu 等(2010)提出的GPP-VI模型,即GPP∝PAR×VI×VI,该模型主要由植被指数驱动,PAR可通过通量站点观测数据获得。首先基于UNVI插件,利用MOD09A1反射率产品获得2013年—2014年覆盖US-WCr通量站点的UNVI数据,同时根据此MOD09反射率产品计算了NDVI和EVI。然后基于站点位置求得以站点为中心的5×5像元窗口内UNVI、NDVI和EVI均值,并依据MOD09产品质量控制文件筛选无云、无云阴影及无雪覆盖的优质数据参与GPP估算,反演精度由相关系数R2和均方根误差RMSE(Root Mean Squared Error)指标指示。图7展示了基于UNVI、NDVI和EVI估算的GPP与站点获得的GPP的相关关系。基于植被指数的GPP估算模型反演精度较高,其中基于UNVI估算的GPP与站点GPP相关系数达0.795,均方根误差RMSE为2.381 g·C·m–2·day–1,基于NDVI和EVI估算的GPP与站点GPP相关系数分别为0.743和0.776,均方根误差RMSE分别为2.753 g·C·m–2·day–1和2.614 g·C·m–2·day–1。结果表明,本研究提出的UNVI指数对GPP变化较为敏感,可以通过GPP-VI模型得到较高的GPP反演精度,从而验证了UNVI在植被初级生产力估算方面的优势。

由于基于UNVI和VIUPD的定量应用研究已有其他研究论文发表,本文仅以GPP估算举例说明,其他应用请参见有关文献(Hasan,2013;佘晓君,2016;Zhang 等,2019)。
4 结 论
本文基于IDL语言开发了UNVI软件插件,该软件插件可方便快速地计算出MODIS、Landsat TM、ETM+和OLI卫星遥感数据的UNVI指数。UNVI指数具有比传统植被指数更多的反射率波段,可以反映更丰富的植被信息。利用本文发布的UNVI插件,将UNVI指数应用于GPP遥感反演,其反演结果优于利用传统植被指数(NDVI和EVI)反演的GPP结果,进一步验证了UNVI指数在植被遥感监测方面的应用潜力。
本研究提供的软件插件可为UNVI在植被理化参数反演、植被净初级生产力估算等方面提供重要技术支持。今后将根据其他新型传感器的参数设置不断更新UNVI插件,并将拓展UNVI指数在其他植被理化参量遥感反演中的应用。
参考文献(References)
-
Baig M H A, Zhang L F, Shuai T and Tong Q X. 2014. Derivation of a tasselled cap transformation based on Landsat 8 at-satellite reflectance. Remote Sensing Letters, 5 (5): 423–431. [DOI: 10.1080/2150704X.2014.915434]
-
Hasan M A B A. 2014. A study on exploring remote sensing based multi-band vegetation indices and gross primary production estimation. University of Chinese Academy of Sciences
-
Huete A R, Liu H Q, Batchily K and van Leeuwen W. 1997. A comparison of vegetation indices over a global set of TM images for EOS-MODIS. Remote Sensing of Environment, 59 (3): 440–451. [DOI: 10.1016/s0034-4257(96)00112-5]
-
Jiao W Z, Zhang L F, Chang Q, Fu D J, Cen Y and Tong Q X. 2016. Evaluating an enhanced Vegetation Condition Index (VCI) based on VIUPD for drought monitoring in the continental United States. Remote Sensing, 8 (3): 224 [DOI: 10.3390/rs8030224]
-
She X J. 2016. GPP Estimation Based on Landsat and MODIS Data Fusion and Research on the Uncertainty and Temporal Sensitivity. Beijing: University of Chinese Academy of Sciences (佘晓君. 2016. 基于时空谱融合数据的GPP估算不确定性和时间敏感性研究. 北京: 中国科学院大学)
-
Shen M G, Tang Y H, Klein J, Zhang P C, Gu S, Shimono A and Chen J. 2008. Estimation of aboveground biomass using in situ hyperspectral measurements in five major grassland ecosystems on the Tibetan Plateau . Journal of Plant Ecology, 1 (4): 247–257. [DOI: 10.1093/jpe/rtp002]
-
Tucker C J. 1979. Red and photographic infrared linear combinations for monitoring vegetation. Remote Sensing of Environment, 8 (2): 127–150. [DOI: 10.1016/0034-4257(79)90013-0]
-
Wu C Y, Niu Z and Gao S. 2010. Gross primary production estimation from MODIS data with vegetation index and photosynthetically active radiation in maize. Journal of Geophysical Research: Atmospheres, 115 (D12): D12127 [DOI: 10.1029/2009JD013023]
-
Zhang L F, Fujiwara N, Furumi S, Muramatsu K, Daigo M and Zhang L P. 2007a. Assessment of the universal pattern decomposition method using MODIS and ETM+ data. International Journal of Remote Sensing, 28 (1): 125–142. [DOI: 10.1080/01431160600617228]
-
Zhang L F, Furumi S, Muramatsu K, Fujiwara N, Daigo M and Zhang L P. 2007b. A new vegetation index based on the universal pattern decomposition method. International Journal of Remote Sensing, 28 (1): 107–124. [DOI: 10.1080/01431160600857402]
-
Zhang L F, Liu B, Zhang B and Tong Q X. 2010. An evaluation of the effect of the spectral response function of satellite sensors on the precision of the universal pattern decomposition method. International Journal of Remote Sensing, 31 (8): 2083–2090. [DOI: 10.1080/01431160903246675]
-
Zhang L F, Qiao N, Baig M H A, Huang C P, Lv X, Sun X J and Zhang Z. 2019. Monitoring vegetation dynamics using the universal normalized vegetation index (UNVI): an optimized vegetation index-VIUPD. Remote Sensing Letters, 10 (7): 629–638. [DOI: 10.1080/2150704X.2019.1597298]