

|
收稿日期: 2019-03-14; 预印本: 2019-05-30
基金项目: 国家自然科学基金(编号:41830108,41701404);国家重点研发计划(编号:2017YFC1500900)
第一作者简介: 张立福,1967年生,男,研究员,研究方向为高光谱数据处理技术。E-mail:zhanglf@radi.ac.cn
通信作者简介: 孙雪剑,1987年生,博士,助理研究员,研究方向为高光谱数据融合。E-mail:sunxj@radi.ac.cn
|
摘要
近年来,遥感应用的快速发展推动了遥感载荷指标性能的不断提升。但由于遥感传感器的硬件技术瓶颈,遥感数据无法同时具有高空间分辨率、高光谱分辨率、高时间分辨率的指标特性。遥感数据融合是解决该问题的有效方法。为了深入了解目前遥感数据融合技术的研究进展情况,本文对国内外1992年—2018年间在该领域有一定影响力的相关成果进行了调研、分析与归纳总结。首先对遥感数据融合相关论文的年发文量、发文国家与机构、发表刊物以及关键词等进行了统计,梳理其发展历史及趋势;系统性的总结了各类数据融合算法,将其分为面向空间维提升的融合算法、面向光谱维提升的融合算法以及面向时间维提升的融合算法3类,并对各类算法的优势与适用性进行了分析;归纳总结了遥感数据融合的质量评价指标,包括有参考影像的融合评价指标以及无参考影像的融合评价指标;最后对遥感数据融合进展进行了总结与展望。
关键词
遥感数据, 数据融合, 图像融合, 融合评价, 文献分析
Abstract
Remote sensing applications have been promoting the development of satellite sensors and their performances. The satellite sensors are now possessing higher and higher data resolutions, and it in turn greatly facilitating remote sensing applications. The improvement of spatial resolution makes it possible to precisely record textures and spatial features of land covers. The improvement of spectral resolution makes it possible to precisely classify and retrieve parameters. The improvement of temporal resolution makes it easier to record the temporal changes of land covers during different phases. However, due to the limitation of sensors, satellite data can not possess high spatial resolution, high temporal resolution and high spectral resolution at the same time, which greatly hinders further remote sensing applications. Remote sensing data fusion is one of the effective solutions to deal with the problem of limitation in sensors’ resolutions, which is to integrate data from different sources and with different resolutions using algorithm methods to get richer information than one single image data. In recent years, the remote sensing data fusion methods have been greatly developed and related articles boost in growing numbers and importance. Thus, this article aims to systematically introduce the remote sensing data fusion and its current progress. Former reviews of remote sensing data fusion divides fusion methods into different categories. Based on processing levels, the remote sensing data fusion methods can be divided into pixel-level fusion, feature-level fusion and decision-level fusion. And based on the data sources, the remote sensing data fusion methods can be divided into homogeneous data fusion, heterogeneous data fusion, fusion for remote sensing observation and station data, and fusion for remote sensing observation and non-observed data. And this article adopts another category system which makes it more systematic and comprehensive in mathematical principles. In order to systematically indicate the current progress and developed history of remote sensing data fusion methods, this article first did bibliometric analysis on the remote sensing data fusion articles from data sources from Web of Science (WOS) and Chinese National Knowledge Infrastructure (CNKI). The data was preprocessed and has removed duplicates. Analysis including the aspects of yearly publishments, countries and organizations, journals and key words to see the history and trends have been done by Histcite, Bibliometric, Citespace and Endnote. Then the remote sensing fusion methods are systematically introduced. According to different resolution improvements, this article firstly divided the fusion methods into three categories: fusion methods emphasizing improvements of spatial resolution development, spectral development and temporal development, and based on that we further divide them into subcategories according to different mathematical principles. And the basic principles, some of the important methods, the advantages and flaws of these methods are systematically introduced in this section. Also, we did detailed instructions on fusion result assessment methods including methods with reference image and without reference image. Under these two categories we further introduced different assessment metrics and its applicable scenarios. And finally, this article made summaries of these fusion methods and described its features and directions. And finally makes predictions of future trends in remote sensing data fusion methods.
Key words
remote sensing data, data fusion, image fusion, fusion quality assessment, document analysis
1 引 言
近年来遥感应用如全球变化、农情监测、资源环境调查等等领域的不断发展,推动了遥感数据的需求,促进了卫星传感器的指标性能的提升,遥感数据的空间分辨率、光谱分辨率、时间分辨率不断提高。例如,Worldview3卫星全色影像空间分辨率已达到了0.31 m,高分五号卫星可见短波红外高光谱传感器分辨率为5 nm,哨兵3号SLSTR传感器全球覆盖重访时间可以达到0.5天,一定程度上解决了对地观测的应用需求。高空间分辨率的遥感影像能够提供精细的纹理及几何特征,能够满足空间几何格局监测的需求,但对于全国尺度的大区域作物的精准识别和监测有所不足,仍受到卫星的幅宽以及重访周期的限制(Tang 等,2010);中低分辨率遥感影像数据重访周期较短,在反映作物的物候变化有巨大的优势,但由于其较小的空间分辨率,难以准确刻画作物的空间分布(Chen 等,2016);高光谱遥感影像能够提供地物准确的光谱信息,能够对作物进行精细分类以及胁迫预警,但目前高光谱卫星在数据质量、数据源、时空分辨率上受限,难以广泛运用(Tong 等,2014)。因此,为满足大尺度、长时间、高精度应用的综合观测需求,遥感应用需要获取到空间分辨率、光谱分辨率、时间分辨率皆高的遥感数据。但由于传感器硬件限制,任何单一传感器都无法同时获得高空间分辨率、高光谱分辨率、高时间分辨率的数据(Wang 等,2010)。
数据融合是解决传感器瓶颈对遥感数据指标限制的有效方法。数据融合是将不同指标或不同来源的数据通过一定的算法进行综合,以获得比单一数据源更加丰富的信息的过程。根据融合数据源类型,遥感数据融合可以分为同质遥感数据融合(同一成像手段获得的遥感数据进行融合,主要目的为提升数据时间、空间、光谱分辨率指标),异质遥感数据融合(不同成像手段获得的遥感数据进行融合,比如光学—热红外、光学—雷达数据等),遥感—站点数据融合(融合大面积低精度的遥感数据与高精度的站点观测数据,获得连续、高精度、大面积地表数据),遥感—非观测数据融合(融合遥感数据与非遥感观测数据,又称为数据同化)(Zhang和Shen,2016)。根据融合层次不同,遥感数据融合可以分为像元级融合(原始数据层面直接进行融合)、特征级融合(原始数据经过特征提取后,对特征进行融合)以及决策级融合(原始数据经过地物解译数据后进行融合)(Pohl和 van Genderen,1998)等。
近年来,遥感数据融合相关文献数不断增多,可见其重要性在不断增加。其中,面向提升时间、空间、光谱分辨率指标的遥感数据融合中最主要的分支是可见光—近红外遥感数据融合,其发展最为成熟。因此本文主要针对可见光—近红外遥感数据融合,从文献发展趋势分析、融合算法综述、融合评价指标以及总结展望等几个部分,对其发展现状以及具体算法进行了详尽的脉络整理以及综述。
2 遥感数据融合文献分析
为了对遥感数据融合相关研究的发展趋势以及热点进行分析,本文从WOS (Web of Science )收集了SCI-EXPANDED(Science Citation Index Expanded)库以及CNKI中的SCI、EI以及核心期刊库的相关文献,并利用文献计量法对文献进行定量化整理和分析。由于研究对象为可见光—近红外遥感数据融合研究部分,为尽量保证检索范围的准确性,WOS检索关键词选择为(标题=fusion) And (主题=remote sensing) Not (主题=lidar) Not (主题= infrared) Not (主题=SAR),检索年限范围为1966—2018年,经去重获得471篇有效题录数据,年限范围覆盖1992年—2018年。CNKI检索关键词选择为(标题=融合)And(主题=遥感)Not(关键词=雷达)Not(关键词=红外)Not(关键词=微波),检索年限范围不限,经去重及筛选处理获得1106篇有效题录数据,处理软件为HistCite、Endnote、Bibliometric以及Citespace。
2.1 年发文量变化
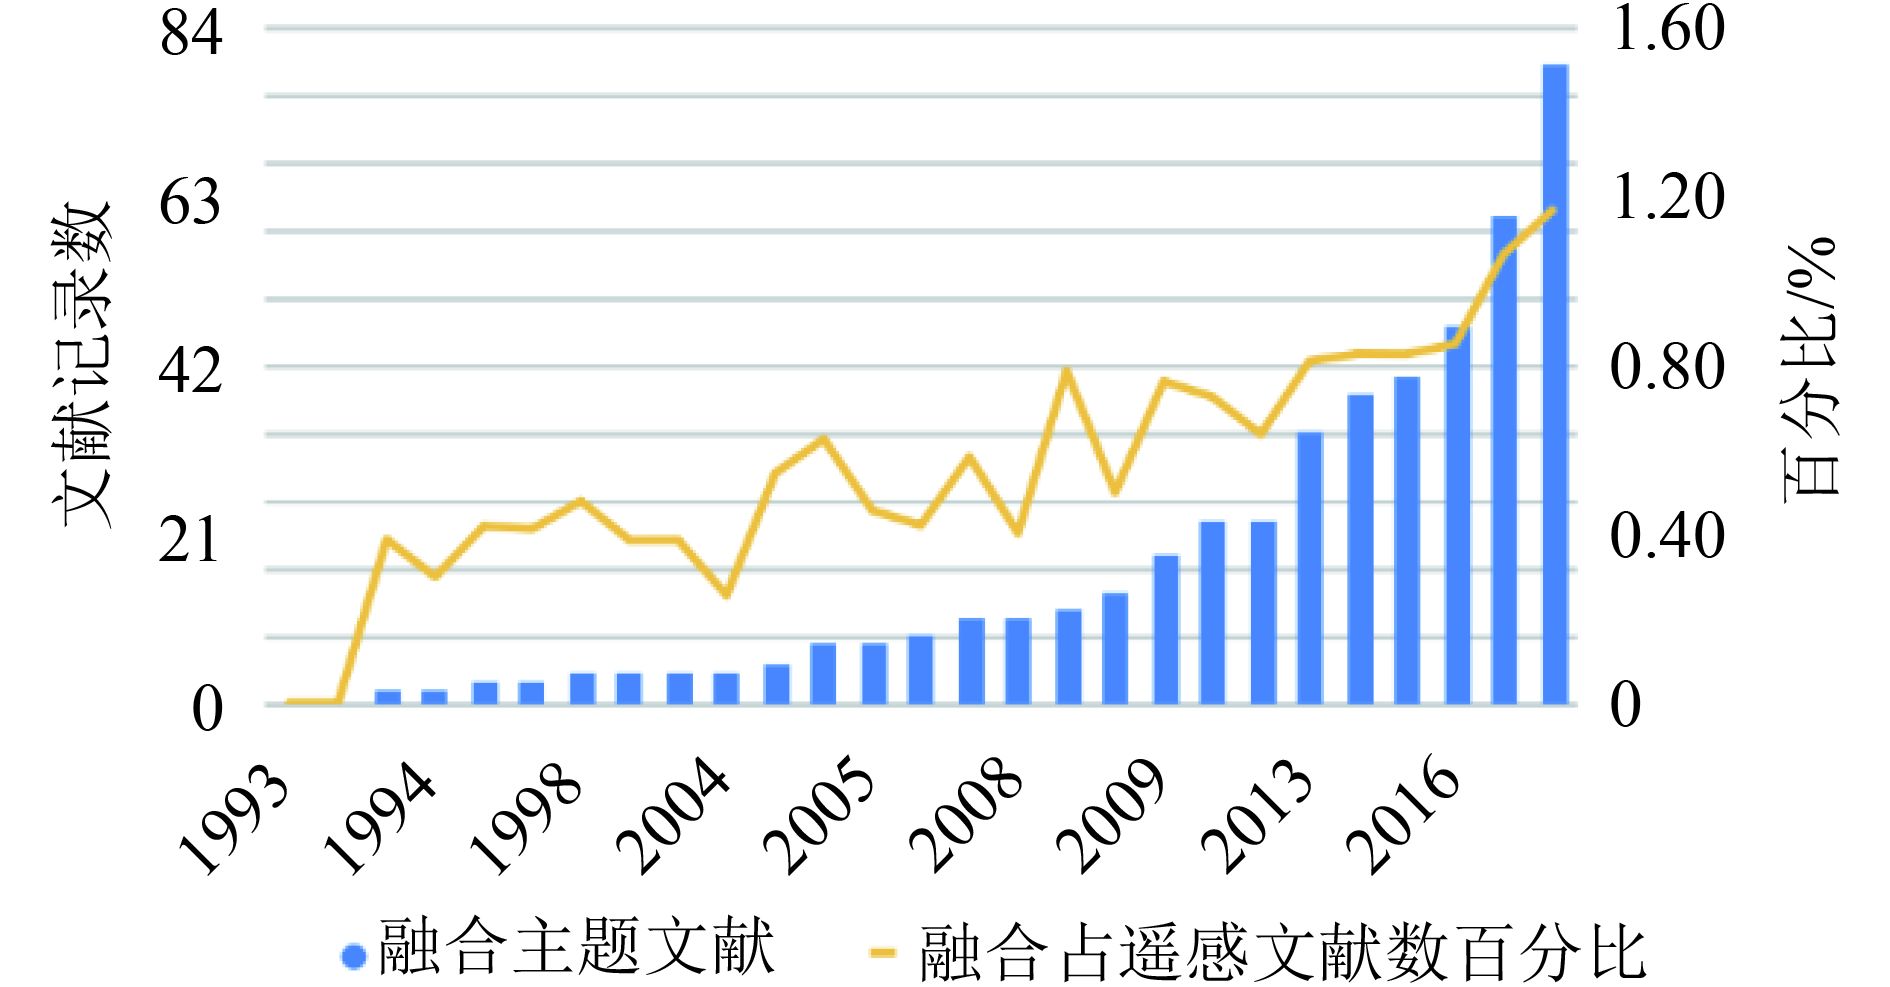
利用HistCite对WOS有效题录数据进行年份统计,获得遥感数据融合相关文章年发文量情况,可见从1992年开始,相关主题的融合文献数量整体呈现随着年份逐步上涨的趋势,并在2018年达到最高峰80篇,如图1的蓝色柱状图所示。由于遥感相关文献同时也呈现上涨趋势,为体现融合文献在遥感相关文献中的比重变化,本文同时统计了遥感相关文献的题录数据,关键词检索为(主题=remote sensing),检索年限为1992年—2018年,共获取有效题录64754篇,并计算了每年融合题录文献占遥感题录文献的比例,如图1的黄色折线图部分。可见,融合相关主题文献占遥感相关文献的比重不断上升,说明其重要性随年份逐渐上升。

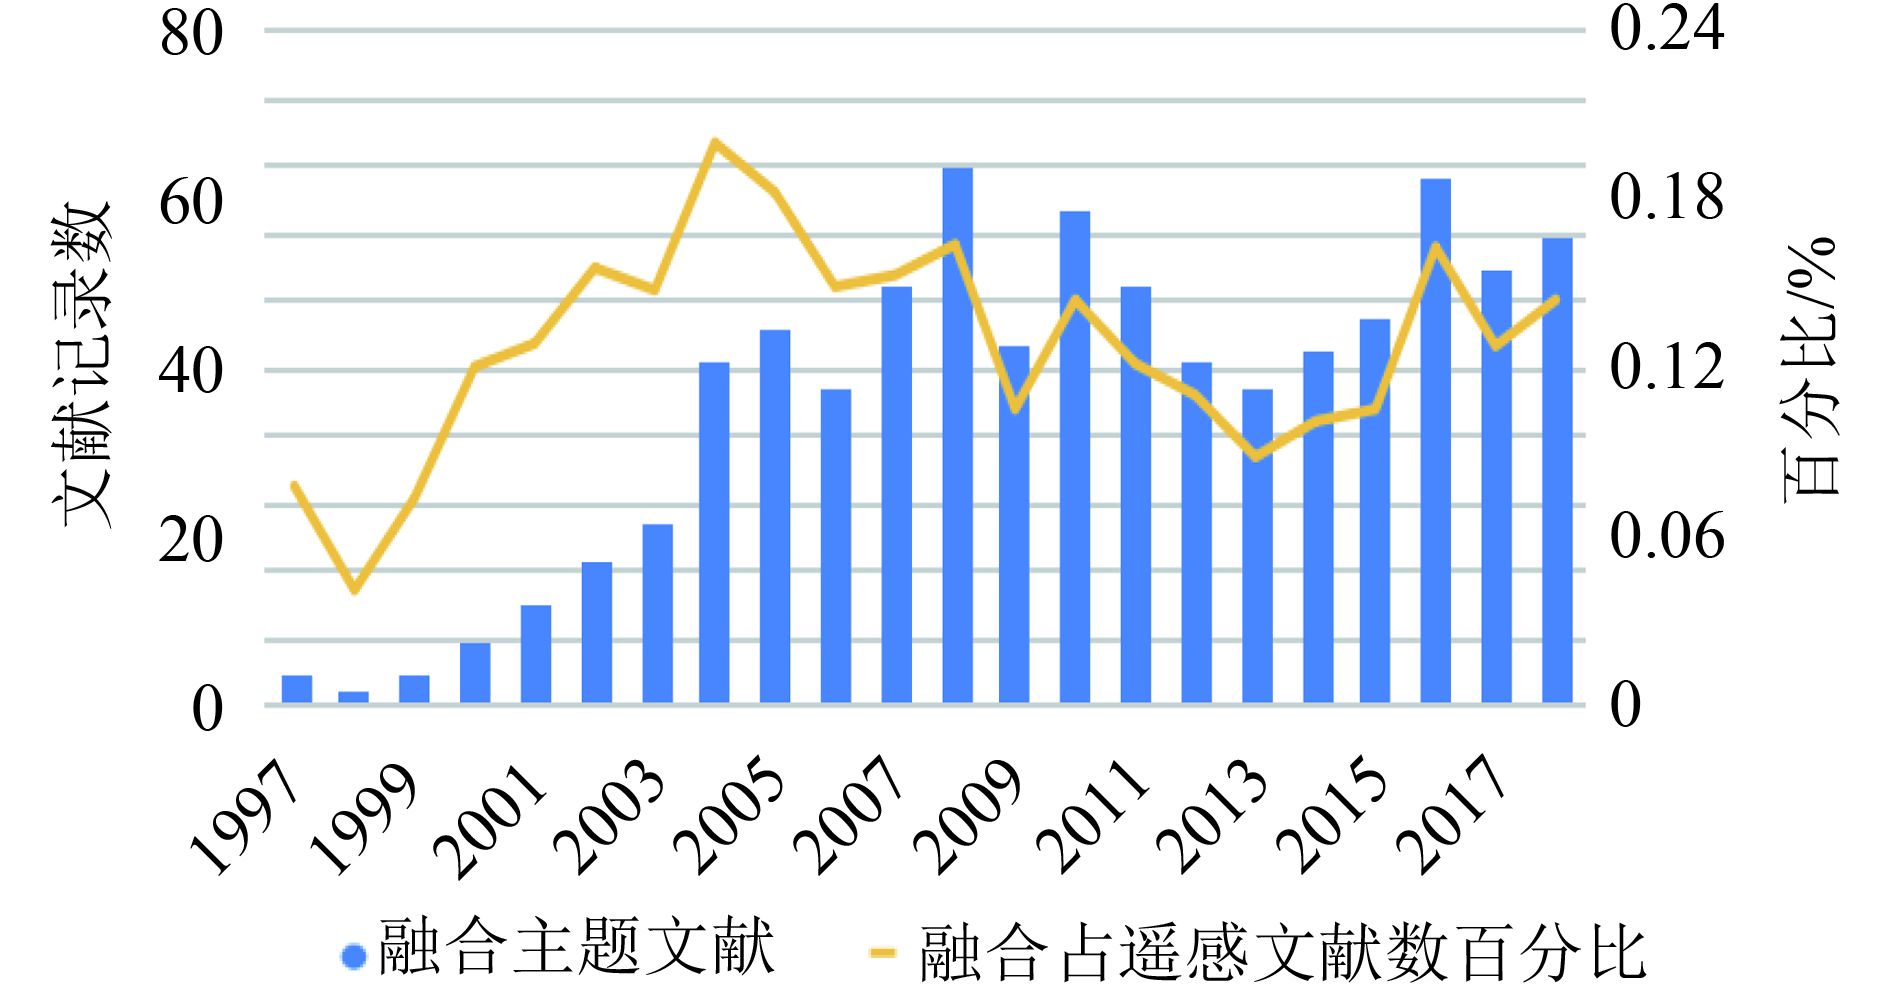
对于中文期刊题录数据,利用Endnote进行年份统计,获得遥感数据融合相关文章年发文量情况如图2,可见中文期刊中融合主题文献于1997年出现后不断处于数量上涨的趋势,于2008年到达高峰64篇,随后于2013年到达小低谷后上升。同样,为了体现融合占遥感主题文献比重的变化,本文同时以(关键词=遥感)并去除无关题录,共获取有效题录6111篇并计算每年融合文献舒展遥感文献数的比重,如图2中黄色折线图部分,可见其比重呈现于年发文量相似的趋势。
2.2 国家及机构分布
对于WOS题录数据,利用HistCite按照国家进行统计整理,列出前10名发文数最多的国家制作饼图,如图3所示。可见,世界范围内中国在遥感数据融合研究领域发文数最多,为242篇,约占49.9%。第二名发文数最多的国家是美国,约占17.3%。其次按照国家发文数的顺序排列为意大利、法国、印度、加拿大、西班牙、日本、德国和韩国。可见,中国在遥感数据融合领域具有相当的贡献。

利用HistCite对发表机构进行统计分析,按照机构发文数前10进行排列,同时统计各机构文章的本地引用次数TLCS(Total Local Citation Score)总体引用次数TGCS(Total Global Citation Score),得到WOS索引下发表机构发文量、TLCS、TGCS统计表(表1)。本地引用次数是指一篇文章被本地收录集(local collection)内的文章索引次数,而总体引用次数是指整个检索文献索引数据库内一篇文章的被引频次。从表1可见,前10名发文数最高的机构中,中国科研机构处于遥感数据融合研究的前列,共有9所,其中武汉大学、中国科学院以及北京师范大学的贡献突出。
表 1 WOS索引下发表机构发文量、TLCS、TGCS统计表(按发文量排名)
Table 1 Numbers of published articles by different organizations and their TLCS and TGCS in WOS data source
| 排名 | 机构 | 文献数 | TLCS | TGCS |
| 1 | 武汉大学 | 40 | 69 | 622 |
| 2 | 中国科学院 | 38 | 33 | 421 |
| 3 | 北京师范大学 | 17 | 61 | 511 |
| 4 | 香港大学 | 14 | 78 | 365 |
| 5 | 湖南大学 | 10 | 36 | 429 |
| 6 | 中国科学院大学 | 10 | 6 | 25 |
| 7 | 中国矿业大学 | 9 | 8 | 133 |
| 8 | 南京大学 | 9 | 8 | 199 |
| 9 | 清华大学 | 9 | 19 | 146 |
| 10 | 冰岛大学 | 9 | 22 | 427 |
针对CNKI数据集,利用Endnote对发表机构进行统计分析,并按发文数量排列并截取前10名,获得CNKI索引下发表机构发文量统计表(表2)。可见在中文期刊中,武汉大学、中国科学院遥感与数字地球研究所、西北工业大学在遥感数据融合领域发文数较多。
表 2 CNKI索引下发表机构发文量(按发文量排名)
Table 2 Numbers of published articles by different organizations and their TLCS and TGCS in CNKI data source
| 排名 | 机构 | 文献数 |
| 1 | 武汉大学 | 45 |
| 2 | 中国科学院遥感与数字地球研究所 | 29 |
| 3 | 西北工业大学 | 20 |
| 4 | 北京师范大学 | 17 |
| 5 | 西安电子科技大学 | 15 |
| 6 | 信息工程大学 | 14 |
| 7 | 河海大学 | 14 |
| 8 | 福州大学 | 13 |
| 9 | 华中科技大学 | 12 |
| 10 | 浙江大学 | 11 |
2.3 刊物分析
利用HistCite按照刊物的融合发表记录数进行统计整理,获得WOS索引下刊物文章数量、TLCS、TGCS统计表(表3)。可见,在遥感融合领域,IEEE TRANSACTIONS ON GEOSCIENCE AND REMOTE SENSING为贡献最突出的期刊,其TLCS及TGCS都为最高,说明在该期刊上发表的融合相关文章影响力最大。其次,ISPRS JOURNAL OF PHOTOGRAMMETRY AND REMOTE SENSING虽然遥感数据融合相关文章位于第7位,但其TLCS以及TGCS都相对较高,说明该刊物虽遥感数据融合文章相对较少,但影响力较大。
表 3 WOS索引下刊物文章数量、TLCS、TGCS统计表(按文章数排名)
Table 3 Numbers of published articles on different journals and their TLCS and TGCS in WOS data source
| 排名 | 刊物 | 文章数 | TLCS | TGCS |
| 1 | IEEE TRANSACTIONS ON GEOSCIENCE
AND REMOTE SENSING |
46 | 321 | 3089 |
| 2 | INTERNATIONAL JOURNAL OF
REMOTE SENSING |
33 | 46 | 560 |
| 3 | REMOTE SENSING | 32 | 14 | 220 |
| 4 | IEEE GEOSCIENCE AND REMOTE
SENSING LETTERS |
28 | 56 | 574 |
| 5 | IEEE JOURNAL OF SELECTED
TOPICS IN APPLIED EARTH OBSERVATIONS AND REMOTE SENSING |
24 | 20 | 241 |
| 6 | JOURNAL OF APPLIED REMOTE
SENSING |
22 | 0 | 52 |
| 7 | ISPRS JOURNAL OF
PHOTOGRAMMETRY AND REMOTE SENSING |
21 | 79 | 947 |
| 8 | JOURNAL OF THE INDIAN SOCIETY
OF REMOTE SENSING |
14 | 9 | 27 |
| 9 | SENSORS | 13 | 6 | 149 |
| 10 | INFORMATION FUSION | 12 | 54 | 606 |
利用Endnote按照刊物发表记录数进行统计整理,按照文章数由多到少的顺序排列,并统计其复合影响因子、综合影响因子,获得CNKI索引下刊物文章数量表如表4。可见,在中文期刊中,中国图象图形学报、遥感技术与应用、测绘学报关于遥感数据融合的发文量最多。
表 4 CNKI索引下刊物文章数量(按文章数排名)
Table 4 Numbers of published articles on different journals and their TLCS and TGCS in CNKI data source
| 排名 | 刊物 | 文章数 |
| 1 | 中国图象图形学报 | 37 |
| 2 | 遥感技术与应用 | 31 |
| 3 | 测绘学报 | 30 |
| 4 | 遥感学报 | 28 |
| 5 | 测绘科学 | 25 |
| 6 | 测绘通报 | 25 |
| 7 | 武汉大学学报(信息科学版) | 24 |
| 8 | 计算机工程与应用 | 22 |
| 9 | 国土资源遥感 | 18 |
| 10 | 农业工程学报 | 16 |
2.4 关键词分析
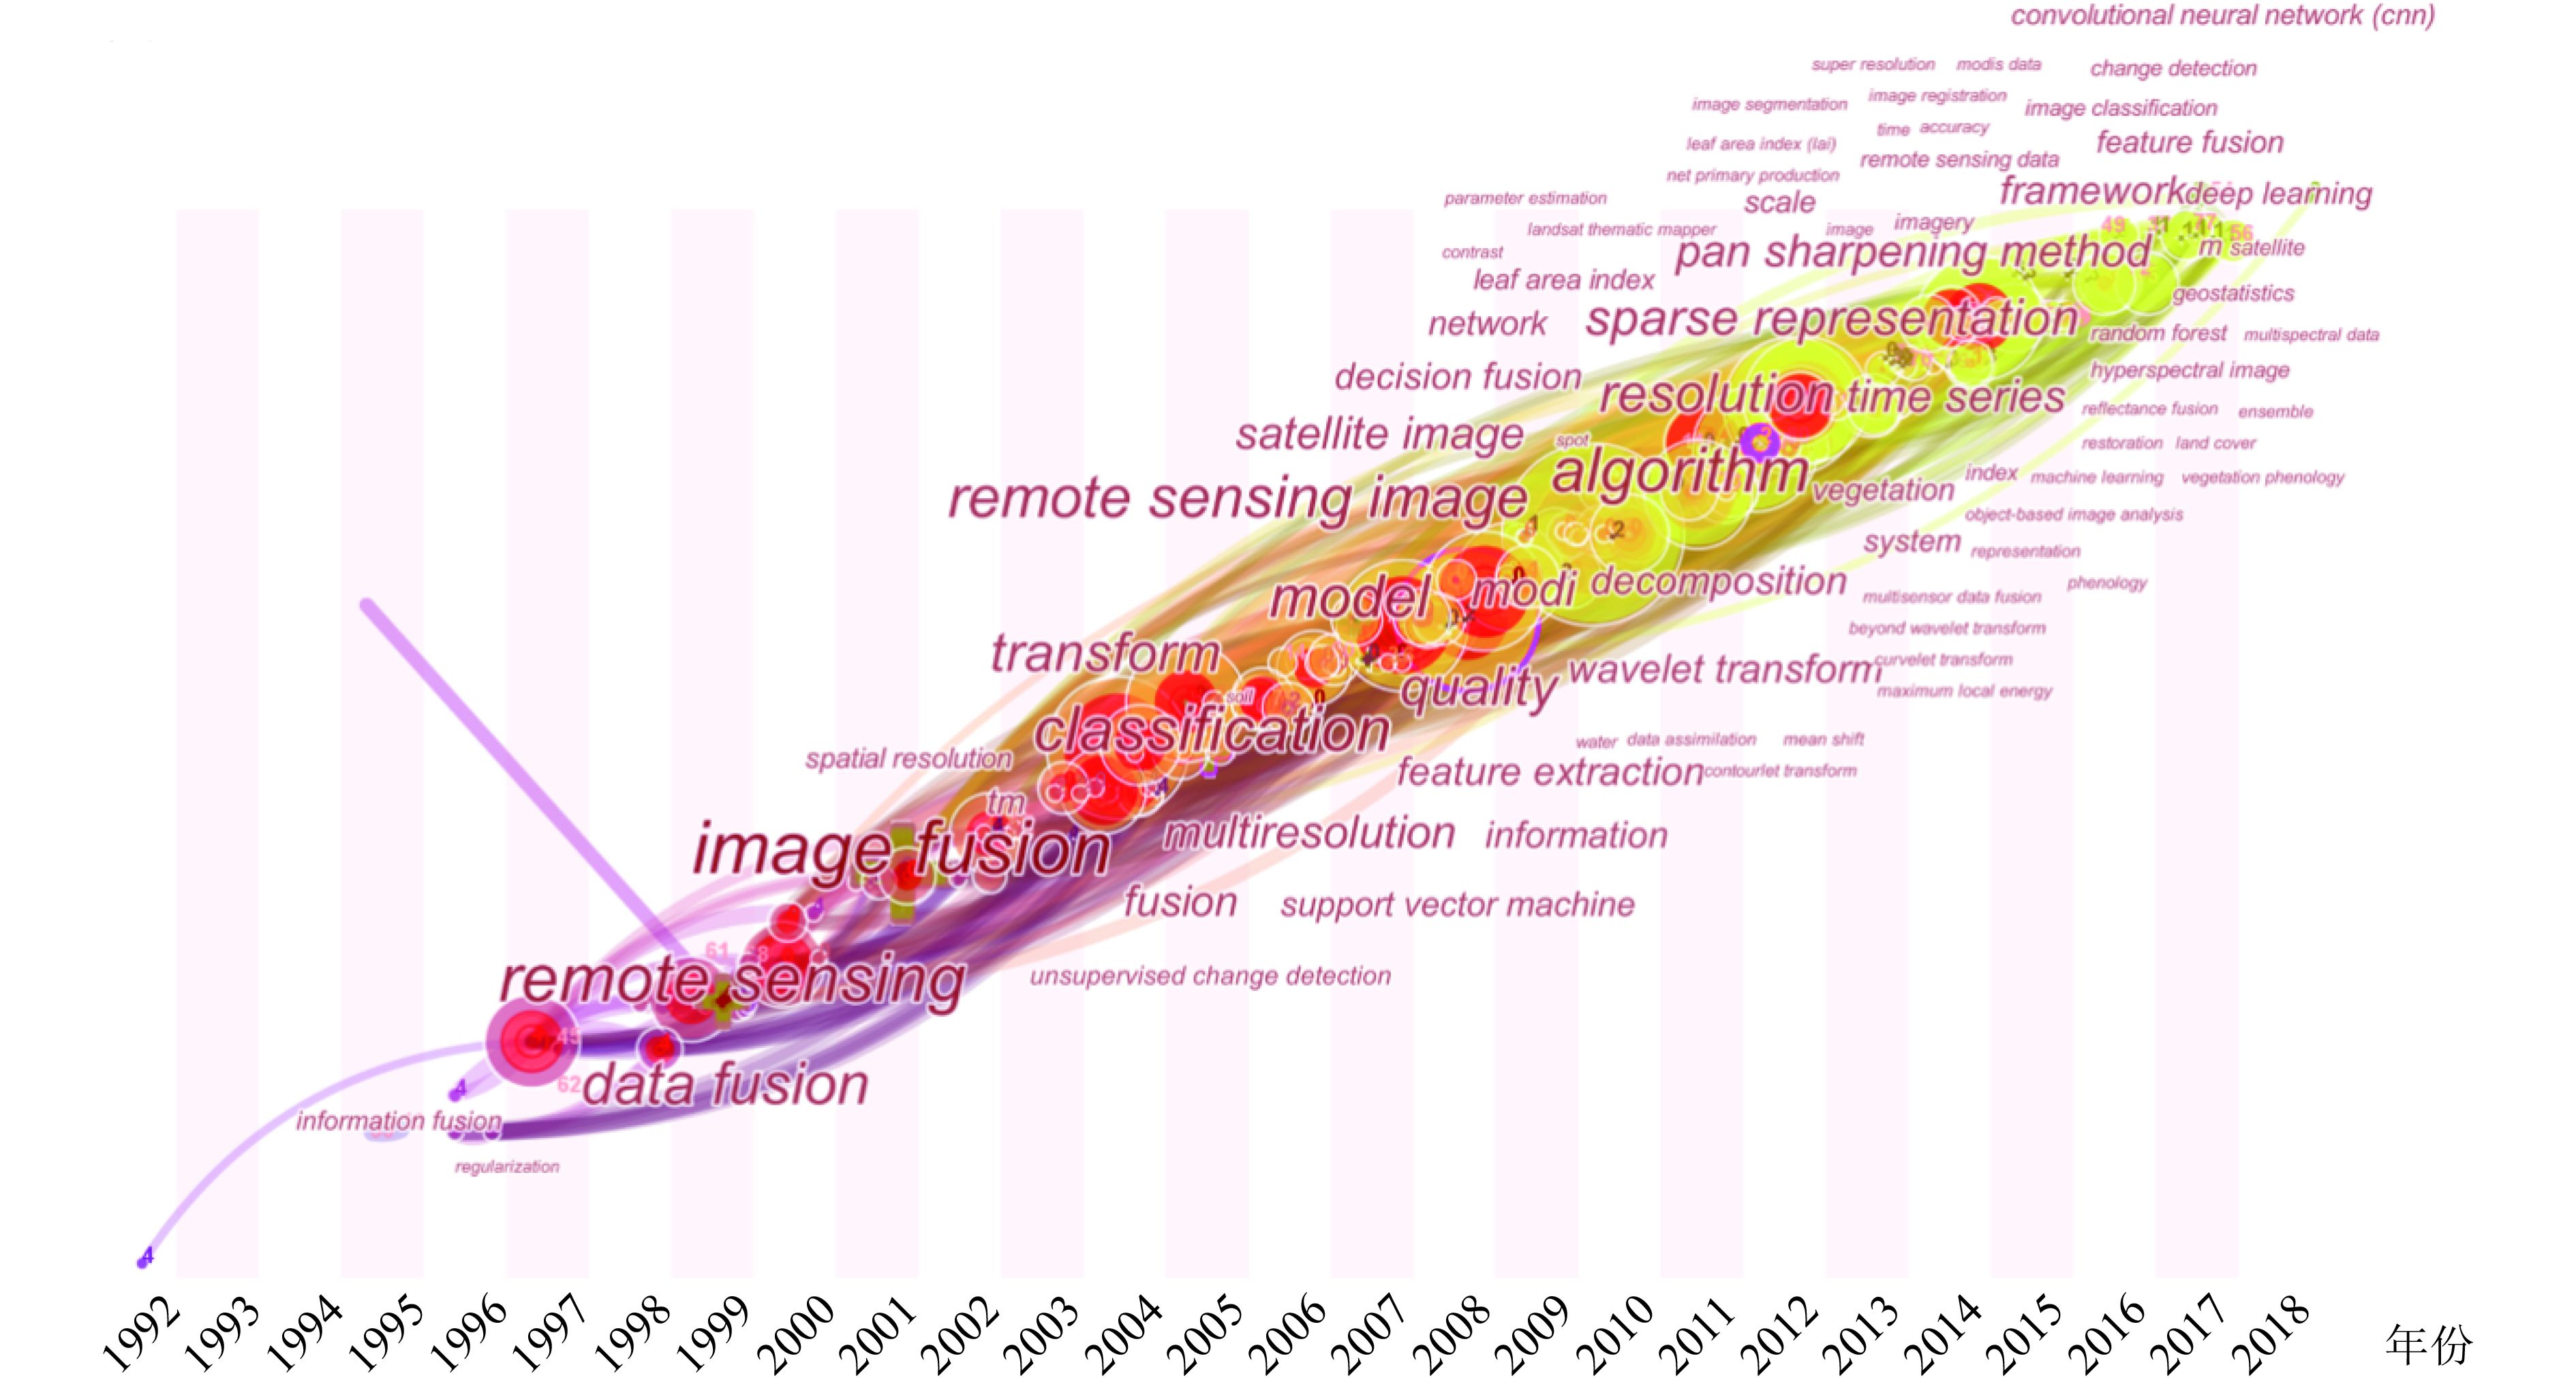
对题录数据进行关键词逐年分析,利用Citespace进行关键词共引分析,时间尺度为1992年—2018年,时间切片设置为1,节点类型设置为关键词,按照词频大小进行标签,获得1992年—2018年遥感数据融合相关研究关键词演进图谱(图4)。根据关键词聚类及词频排序,可以将融合发展历程分为以下5个阶段:
(1) 1992年—2003年关键词:数据融合、遥感、图像融合、空间分辨率。通过分析2003年以前的关键词,可知遥感数据融合起源于信息融合与遥感交叉学科结合,演变为遥感图像融合。此时的遥感数据融合侧重于空间分辨率的提升。
(2) 2003年—2007年关键词:变换、分类、非监督变化检测。该时段的研究热点为基于变换的融合方法及变换方法相关的融合相关应用,利用融合数据进行分类、非监督变换监测等应用。
(3) 2008年—2011年关键词:模型、多分辨率、小波变换、特征提取、质量。该时段的研究热点为融合模型构建,多分辨率数据融合、基于小波变换的融合及应用以及融合质量评价。
(4) 2012年—2014年关键词:算法、分辨率、稀疏表达。该时段融合注重融合算法的研究及分辨率提升,其中稀疏表达是遥感数据融合研究的重点。
(5) 2015年—2018年关键词:全色—多光谱数据融合、融合框架、高光谱数据、深度学习。该时段全色—多光谱数据融合又重新开始成为热点,注重不同数据源的融合框架的研究。同时,针对高光谱数据源的融合、利用深度学习框架进行遥感数据融合也是这一时段的研究热点。
3 遥感数据融合指标提升算法
遥感数据融合过程,根据Schmitt和Zhu(2016)文献,首先对待融合数据进行数据配准、重排列等操作,目的是使待融合数据之间建立联系、互相匹配,然后利用数据融合算法进行融合,获得融合后的影像。其中,遥感数据融合过程中最重要的部分是融合算法。本节根据维度提升侧重点,将数据融合算法分为面向空间维提升的融合算法、面向光谱维提升的融合算法、面向时间维提升的融合算法,并根据原理将其细分进行阐述。本文所整理的、以提升指标及原理为分类依据的融合算法如表5所示。
表 5 以提升指标及原理为分类依据的融合算法一览表
Table 5 Remote sensing data fusion methods based on the category of resolution improvements and mathematical principles
| 提升指标 | 原理 | 融合方法 | 文献来源 | |
| 空间维提升 | 成分替换法 | Principle Component Analysis(PCA) | (Shettigara,1992) | |
| Intensy-Hue-Saturation(IHS) | (Tu 等,2001) | |||
| Brovey Transform(BT) | (Tu 等,2005) | |||
| Gram-Smidt(GS) | (Aiazzi 等,2007) | |||
| GS adaptive (GSA) | (Aiazzi 等,2007) | |||
| GIHS adaptive (GIHSA) | (Aiazzi 等,2007) | |||
| 光谱维提升 | 线性优化分解法 | 多分辨率分析法 | Wavelet Transform | (Nunez 等,1999) |
| High-pass filtering | (Chavez 等,1991) | |||
| Curvelet Transform | (Nencini 等,2007) | |||
| Contour Transform | (Do和Vetterli,2005) | |||
| Laplacian Pyramid | (Schmitt和Zhu,2016) | |||
3.1 面向空间维提升的融合算法
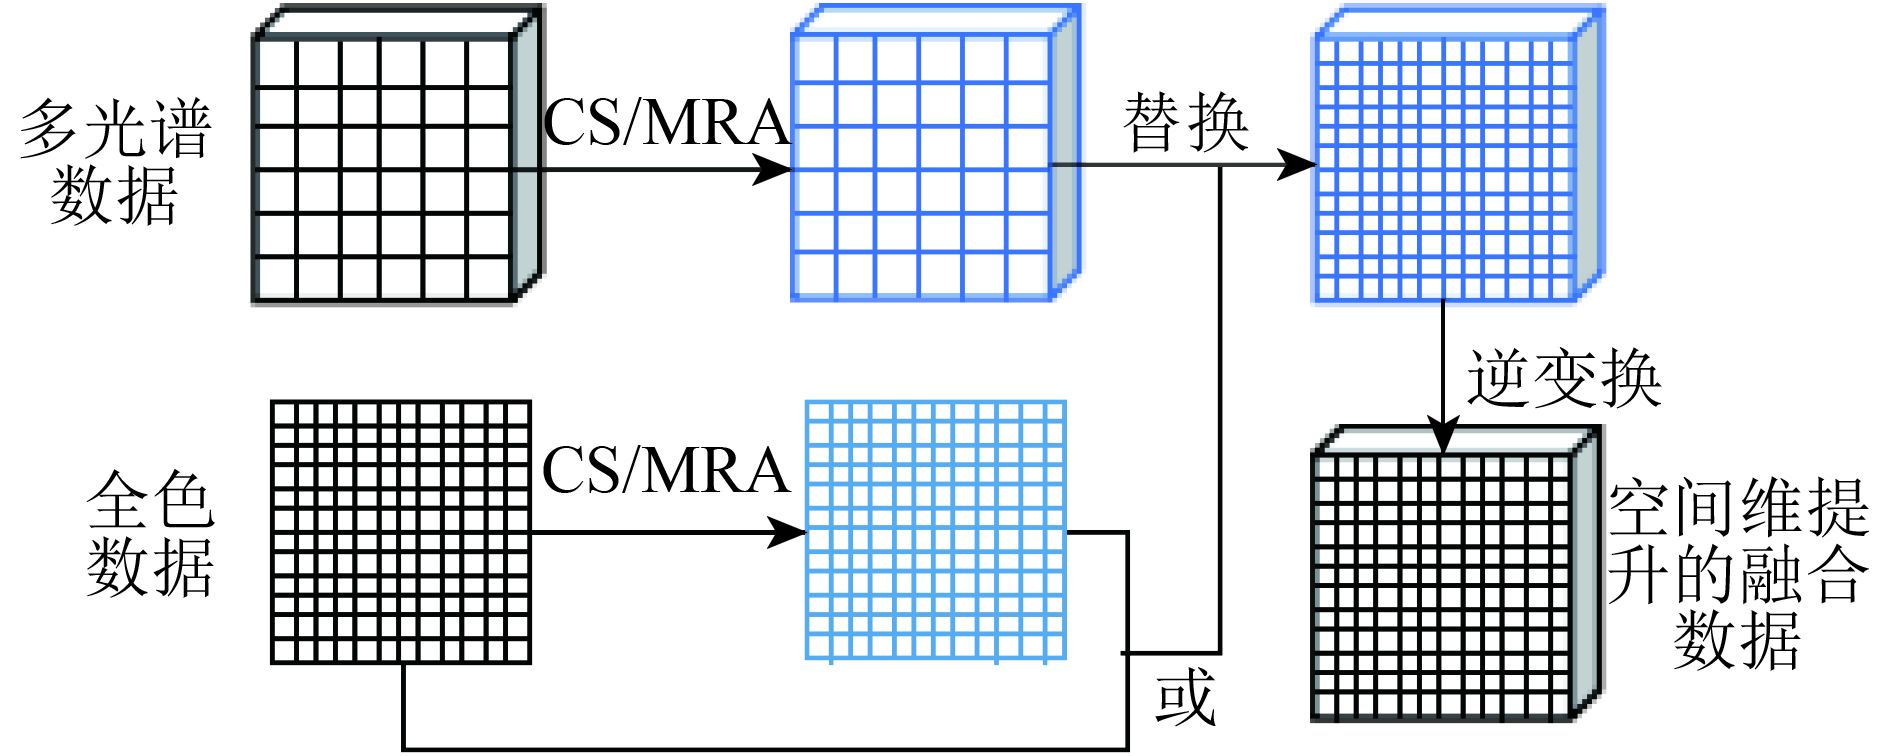
面向空间维提升的融合算法主要是通过多源数据融合获得比原始数据空间分辨率更高的过程。空间维提升主要的应用场景为多光谱—全色融合,即利用全色数据的空间维信息提升多光谱数据的空间分辨率,如图5所示。它侧重于影像空间分辨率的提升,而在光谱维上有一定失真。具有代表性的方法有成分替换法与多分辨率分析法。
3.1.1 成分替换法
成分替换法(Component Constitution)是指将遥感影像投影至一个新的变换空间,将含有空间信息的成分替换为高空间分辨率影像并逆变换得到空间维提升后的遥感数据的过程(Ghassemian, 2016)。假设(高)多光谱数据可以用
| $ {{{M}}^\prime }\left({{{x}}_1^\prime, \cdots, x{'_m}} \right) = F\left({M\left({{{{x}}_1}, \cdots, {{{x}}_m}} \right)} \right) $ | (1) |
式中,F为投影变换的映射关系。得到变换特征集后,将其中含有空间信息的成分替换为高空间分辨率影像,即得到
| $ {{{M}}_H}\left({{{x}}{{\rm{'}}_1}, \cdots, {{x}}_m^\prime = {F^\prime }\left({y, \cdots, {{x}}{{\rm{'}}_m}} \right)} \right) $ | (2) |
式中,
常用的方法有(1)IHS(Intensity-Hue-Saturation)变换(Tu 等, 2001),即将RGB影像变换为强度、模糊度和色度3个分量,其中的空间分量主要集中于强度分量中,因此替换的分量为I分量;(2)主成分变换法(PCA)(Shettigara, 1992),主要通过线性变换将多光谱数据投影新的变换空间,其第一主成分处于最大方差方向上,具有最丰富的信息,因此被替换的分量为第一主成分;(3)Gram–Schmidt变换法(Aiazzi 等,2007)等,是将全色数据模拟至多光谱的空间分辨率,模拟的全色数据作为第一主成分与多光谱同时进行GS变换,用原始全色数据的第一主成分,并逆变换获得融合后数据。此外还有Brovey变换BT(Brovey Transform)(Tu 等,2005)等等。
成分替换法能有效提高空间分辨率,但对于光谱维上信息保持能力欠佳。为了解决这个问题,学者发展了许多算法例如将波段响应函数考虑在内的GSA (GS adaptive)、GIHSA (GIHS adaptive)等(Aiazzi 等,2007)以及波段分组的策略(Chen 等,2014),在一定程度上解决了多光谱融合过程中的光谱失真问题。
3.1.2 多分辨率分析法
多分辨率分析法(Multiresolution Analysis Method)是将每个原始数据都分解为不同分辨率的一系列影像,在不同的分辨率上进行融合,最后进行逆变换获得融合后的影像。对多光谱影像
| $ {M_m} \to {M_{m \times l}}^\prime \left({{x_1}, {x_2}, \cdots, {x_l}} \right) $ | (3) |
对全色影像
| $ {{P}} \to {{P}}_l^\prime $ | (4) |
获得不同分辨率上的数据后,在不同尺度上实现融合,常用的融合策略有:(1)替换方法,即将多光谱影像每个波段分解得到的第一个平面上的成分替换为相应的全色影像的分解成分,然后进行逆变换得到融合后的数据;(2)加法方法,即只分解全色影像,讲的到的l个平面上的分解成分分别加到各个波段上,在进行逆变换得到融合后的数据。
常用的多分辨率分析方法有高通滤波HPF(High-Pass Filtering)(Chavez 等,1991),小波方法(Nunez 等,1999),curvelet变换(Nencini 等,2007),基于平滑滤波的强度调制(smoothing filter-based intensity modulation)(Liu, 2000),contourlet变换(Do和Vetterli, 2005),Laplacian pyramid (Schmitt和Zhu, 2016)等。多分辨率分析方法相对于成分替换方法能够较好的保持光谱信息,但要求数据进行严格配准,否则会出现空间失真现象(Yuan 等,2018)。
3.2 面向光谱维提升的融合算法
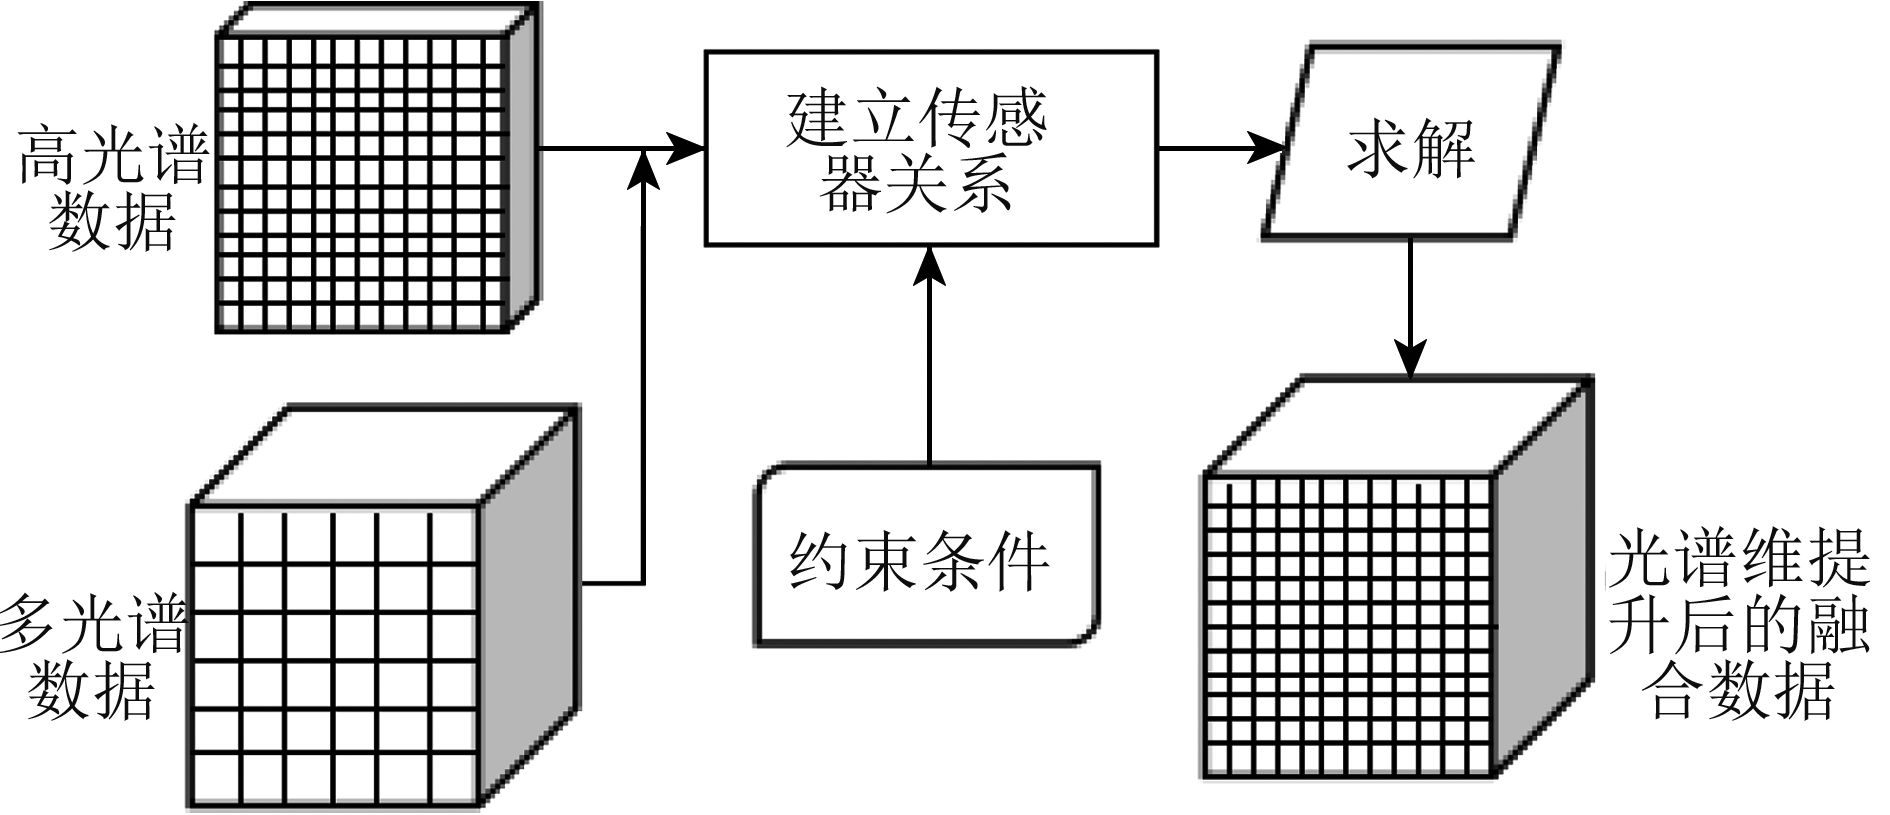
面向光谱维提升的融合算法主要是通过融合获得比原始数据光谱分辨率更高的过程。面向光谱维提升的融合主要的应用场景为高光谱—多光谱融合,即利用高光谱数据提升多光谱数据的光谱分辨率,如图6所示。相对于面向空间维提升的融合算法,它在空间维提升的同时,更加注重光谱维信息的保真性。常用的方法可分为线性优化分解法及人工智能法。
3.2.1 线性优化分解法
线性优化分解法是假设融合重建数据
| $ {{X}} = {{WZ}} + {{n}} $ | (5) |
式中,W为变换算子。当测数据为高光谱数据时,W为空间模糊算子及降采样算子;当观测数据为多光谱数据时,W为多光谱卫星的波段响应函数。利用已知数据X求解Z可以视为一个病态的拟问题(Yuan 等,2018),通过加入不同的约束条件,并求解最优解。按照原理不同,可分为光谱解混法、贝叶斯概率法以及稀疏解混法。
光谱解混是近年来针对高光谱影像分析的有力手段,它将一个有限的区域内的反射率当作是不同材料光谱的混合,即高、多光谱中每个像元中端元(endmember)光谱及成分丰度(fraction、abundances)的线性加和(Adams等, 1986)。基于光谱解混方法的融合,学者提出了诸多种方法,如解混后亚像元定位获得融合数据(Gross和Schott, 1998),以及光谱分辨率提升算法SREM(Sun 等,2015)等。其中较为典型的多—高光谱光谱解混融合法(Bendoumi 等,2014),用矩阵的形式可以表示为
| $ {{Z}} = {{EA}} + {{n}} \approx {{EA}} $ | (6) |
式中,
| $ {{H}} = {{EAW}} + {{n}} = {{E}}{{{A}}_h} + {{n}} $ | (7) |
| $ {{M}} = {{WEA}} + {{n}} = {{{E}}_m}{{A}} + {{n}} $ | (8) |
式中,
概率统计法是通过概率统计的方法进行融合,主要是基于贝叶斯模型假设。它将待融合的数据视为观测值,融合后的数据视为未被观测到的真实值,通过计算出现观测值的前提条件下真实值出现的概率,并将概率最大化从而求解得融合过程中的参数值,从而最后得到融合后的数据。其中具有代表性的算法为最大后验概率MAP(Maximum A Posteriori) (Hardie 等,2004),即
| $ \hat {{Z}} = \arg {\max _z}p({{Z}}|{{M}}, {{H}}) $ | (9) |
式中,Z为融合重建后的数据,M为观测到的真实多光谱数据,H为观测到的真实高光谱数据,
| $ \hat {{Z}} = \arg {\min _{\textit{z}}}{{C}}({{Z}}) $ | (10) |
式中,损失函数
| $ \begin{split} {{{C}}}({{Z}}) = & \frac{1}{2}{{({{M}} - {{WZ}})}^{\rm{T}}}{{C}}_n^{ - 1}({{M}} - {{WZ}}) + \\ & {\frac{1}{2}{{\left({{{Z}} - {\mu _{{{Z}}|{{H}}}}} \right)}^{\rm{T}}}{{C}}_{{{Z}}|{{X}}}^{ - 1}\left({{{Z}} - {\mu _{{{Z}}|{{H}}}}} \right)} \end{split} $ | (11) |
具体推导过程详见(Hardie 等,2004)。通过求解损失函数的梯度并令梯度为零,并通过参数估计获得最终的融合结果。此外,代表性的概率统计模型还有随机混合模型SMM(Stochastic Mixing Model) (Eismann和Hardie,2003,2005)、线性贝叶斯模型(Ge 等,2007)、与小波结合(Zhang 等,2009) (Zhang,2012)、分层贝叶斯模型(Wei 等,2014a,2014b)等。
稀疏表达法的融合是将观测数据分解为字典矩阵和稀疏系数矩阵,并加入稀疏约束条件求解稀疏系数并最终获得融合重建后的数据。其表达如下
| $ {{X}} = {{D}}{{\alpha}} + {{n}} $ | (12) |
式中,D为稀疏字典,
| $ {min _{{\alpha}} }{\left\| {{\alpha}} \right\|_0}\;\;\;{\rm{{subject}\;{to}}}\;\left\| {{{X}} - {{D}}{{\alpha}} } \right\|_2^2 < {{\varepsilon }} $ | (13) |
式中,
| $ {min _{{\alpha}} }{\left\| {{\alpha}} \right\|_1}\;\;{\rm{{subject}\;{to}}}\;\left\| {{{X}} - {{D}}{{\alpha}} } \right\|_2^2 < {{\varepsilon }} $ | (14) |
在式(14)的基础上代入传感器线性模型,利用稀疏解混的方法获取字典和稀疏矩阵,最后进行融合数据重建,常用方法有压缩感知(Li和Yang, 2011)、稀疏表达(Huang 等,2014) (Wei 等,2015)、解析稀疏模型(Han 等,2016)等。
线性优化分解法能够有效的提升多光谱数据的光谱维分辨率,并且对空间维具有较好的保真效果。然而分解优化法都是基于线性观测模型假设,在实际成像过程中,线性条件往往不能被满足。
3.2.2 人工智能法
上述方法大多都基于假设传感器间的关系是线性关系,然而这种假设并没有得到较严谨的验证。同时优化类方法的参数较为依赖先验知识(Yuan 等,2018)。人工智能法是基于人工神经网络、卷积神经网络等,能够较好的学习系统输入输出的非线性关系。人工神经网络(Artificial Neural Network)是模拟生物神经元结构,这些神经元各自构造简单但互相紧密联结。其基本结构如下
| $ {{y}} = {{f}}\left({\sum\limits_{k = 1}^K {{x_i}} {w_{ij}} + b} \right) $ | (15) |
对于一组输入
| $ {{{y}}_{i, J}} = f\left({b + \sum\limits_{n = 1}^K {\sum\limits_{m = 1}^K {{w_{n, m}}} } {x_{i + n, j + m}}} \right) $ | (16) |
可写为卷积形式
| $ y = f(b + w*x) $ | (17) |
式中,*代表卷积运算。近年来,随着深度学习研究的爆发式发展,也有部分学者研究利用深度学习方法遥感图像融合。该方法大多基于假设高、低空间分辨率的全色影像之间的关系与高、低空间分辨率多光谱影像之间的关系相同且非线性。Huang 等(2015)首次利用深度神经网络(DNN)对多光谱和全色影像进行了融合,在DNN框架内加入了预训练和微调学习阶段,增加了融合的准确性。在此基础上,学者发展出了众多算法如PNN(Masi 等,2016)、MRA框架下的DNN (Azarang和Ghassemian, 2017)、DRPNN (Wei 等,2017b)、MSDCNN (Yuan 等,2018)。对于高光谱和多光谱融合的研究较少,Frosti Palsson利用了3D CNN模型对高光谱和多光谱进行了融合,为了克服高光谱数据量大造成的计算复杂性,对高光谱数据进行了降维处理,相对于MAP算法具有更高的精度(Palsson 等,2017)。
基于深度学习的融合方法的精度相对于投影变换、分解优化法而言,能够更好的刻画不同分辨率影像之间的非线性关系,可迁移性强。然而基于CNN的问题在于,前提假设并未得到严格的证实,同时CNN的计算复杂性较大,比较耗时,且对样本数量要求较大,在训练样本数量较少的情况下往往难以获得很好的融合结果。
3.3 面向时间维提升的融合算法
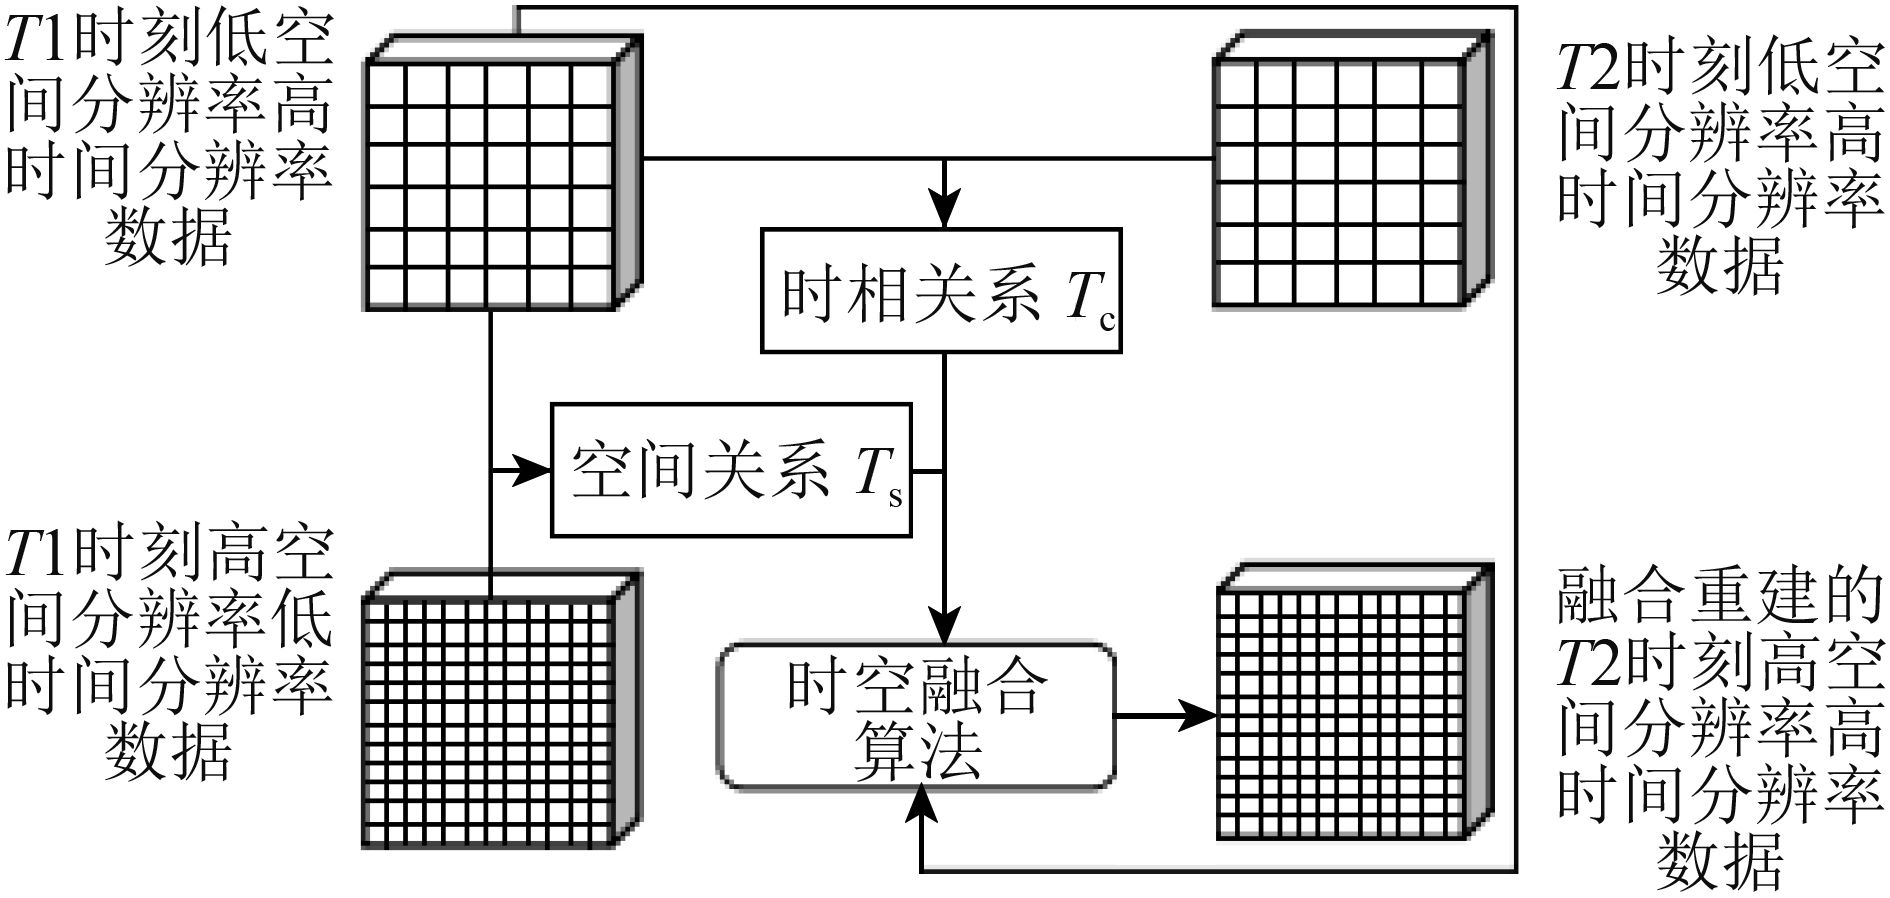
面向时间维提升的融合算法主要是通过数据融合模拟出缺失时相的遥感数据,以达到时间维提升的目的。面向时间维提升的融合主要的应用场景为多光谱—多光谱时空融合,较为常见于利用MODIS数据和Landsat数据融合获得缺失时相的具有Landsat空间分辨率的数据,如图7所示。典型的方法有权重函数法,线性优化分解法及人工智能法。
3.3.1 权重函数法
权重函数法假设高空间低时间分辨率影像与低空间高时间分辨率影像之间有一定的线性关系,在此基础上建立两者之间的联系,利用滑动窗口内的像元确定像元中心的值,加上权重系数来预测重建缺失时间影像,获得高空间高时间分辨率影像,该方法起源于由Feng等(2006)提出的时空自适应融合方法STARFM(a Spatial and Temporal Adaptive Reflectance Fusion Model),是时空融合中应用最广泛的算法之一。其前提假设地物在成像时间到预测时间之内地物不发生变化,其基本形式为
| $ \begin{split} {{{L}} }\left( {{{{x}}_{\frac{w}{2}}},{{{y}}_{\frac{w}{2}}},{t_0}} \right) = & \sum\limits_{i = 1}^w {\sum\limits_{j = 1}^w {\sum\limits_{k = 1}^n {{W_{ijk}}\left( {{{M}}\left( {{{{x}}_i},{{{y}}_i},{t_0}} \right) + } \right.} } }\\ & {\left. {{{L}}\left( {{{{x}}_i},{{{y}}_i},{t_k}} \right) - {{M}}\left( {{{{x}}_i},{{{y}}_i},{t_k}} \right)} \right)} \end{split} $ | (18) |
式中,
STARFM算法虽然模型易于理解,应用广泛,但仍具有如下问题:(1)STARFM算法虽然在预测渐变信息上具有较好的效果,但它不能预测短期内瞬时的扰动事件。(2)STARFM没有考虑反射率方向性问题。(3)STARFM依赖于MODIS低分辨率像元的纯净、同质像元假设。针对这些问题,学者们进行了改进,如STAARCH模型(Hilker 等,2009)、Enhanced STARFM算法(ESTARFM)(Zhu 等,2010)、mESTARFM(Fu 等,2013)、RWSTFM(Wang和Huang, 2017)。除了常见的可见—近红外卫星数据融合以外,时空滤波法还广泛应用于地表温度数据的融合如双边滤波法(Huang 等,2013)、SADFAT(Weng 等,2014)、STITFM(Wu 等,2015c)等以及NDVI数据融合如STVIFM(Liao 等,2017)等等。
权重函数法优点在于模型直观、应用广泛,但它的问题在于:(1)对形状变化的物体、短期瞬时变化不能很好地进行预测。(2)传感器之间的相关关系未得到严格证明。(3)滑动窗口大小等参数需要人工制定,不能做到自动化。
3.3.2 线性优化分解法
基于线性优化分解法的时间维提升融合算法同样基于线性假设,原理类似于2.2.1节。通过加入约束条件获得最优解求解获得融合后的重建影像。所基于原理包括光谱解混法、概率统计法以及稀疏表达法。
光谱解混法也是基于光谱线性解混模型,原理见1.3节。常见步骤如下(Song 等,2018):(1)对高空间低时相数据进行非监督分类;(2)利用(1)获得的成分信息对低空间高时相数据进行光谱解混;(3)通过将低空间高时相数据解混出的光谱信息加入高空间低时相数据,获得融合后的高空间高时相数据。常用算法有MMT光谱解混算法(Zhukov 等,1999),STDFM算法(Wu,2012)、ESTDFM(Zhang 等,2013)、MSTDFA(Wu 等,2015b)等。软聚类方法(soft clustering) (Amorós-López 等,2013)、OB-STVIUM算法OBIA(Object Based Image Analysis)(Lu 等,2016)等。基于光谱解混的时空融合方法的优点在于考虑了低分辨率影像混合像元的问题,提高了融合的精度。但该方法大多建立于线性光谱解混方法,其前提假设未经过严格验证;端元成分和确定过程中,地物覆盖类型图与待预测时相之间的时间差距离太大,其精度无法保证;同时端元成分确定是基于预测时间内地物类型不发生变化的基础上建立的,然而这种情况有时不能被满足。
概率统计法是利用贝叶斯统计概率作为融合框架,对缺失时相的高空间分辨率数据进行预测的融合算法。一般首先建立缺失影像与已知影像之间的关系,然后通过最大化在已知影像的条件下缺失影像的条件概率来进行缺失影像重建,即最大后验概率模型MAP(Maximum a posteriori)。根据Zhu(2018)的分类方法,在缺失影像与已知影像的关系上,可分为时相关系模型及尺度关系模型。时相关系模型是指建立不同时相影像之间的关系,刻画地物缓慢和瞬时变化,如NDVI-BSFM(Liao 等,2016)。尺度关系模型指的是通过对在同一时相上缺失影像与已知影像的关系进行建模,通过点扩散函数来建立已知影像像元与未知影像像元的关系,如利用低分辨率影像的联合协方差作为时相关系模型,低分辨率影像的双边滤波以及高分辨率影像的高通滤波来建立尺度关系模型的基于贝叶斯统计算法的融合方法(Xue 等,2017)。基于概率统计方法的优点在于不要求波段响应严格匹配。
基于稀疏表达的融合算法,最有代表性的算法为基于稀疏表达的时空融合算法SPSTFM(SParse-representation-based SpatioTemporal reflectance Fusion Model)(Huang和Song, 2012),主要是通过缺失影像前后的时相影像的差异影像对进行联合字典训练,并用学习获得的字典重建缺失影像前、后时相与缺失影像的两个差值影像,再加权获得最终融合重建结果。在差异影像思想的基础上,学者也发展出了许多基于稀疏表达的融合方法,如EBSCDL(Wu 等,2015a)、基于ELM的融合方法(ELM-based method)(Liu 等,2016)、bSBL-SCDL/msSBL-SCDL(Wei 等,2017b)、CSSF(Wei 等,2017a)等。
基于线性优化分解法的时间维提升融合算法虽然能够较好的时间维重建效果,但由于其假设模型为人为设定的近似线性关系,在实际成像关系中难以满足。
3.3.3 人工智能法
权重滤波法、概率统计法、优化分解法都是基于对传感器观测模型或者已知、缺失时相影像之间的线性关系,然而这种线性关系未被严格证明。深度学习方法能够很好的刻画非线性关系,因此也有学者探索利用深度学习方法进行时空融合的方法。Vahid Moosavi结合小波算法及人工神经网络ANN(Artificial Neural Network)、自适应神经模糊推理系统ANFIS(Adaptive Neuro-Fuzzy Inference System)以及支持向量机SVM(Supported Vector Machine),提出预测时相的Landsat热红外数据的WAIFA算法(Moosav 等,2015)。近年来卷积神经网络CNN(Convolutional Neural Networks)的兴起,利用CNN进行时空融合的算法如STFDCNN (Song 等,2018)、DCSTFN(Tan 等,2018)等也逐渐被提出。
人工智能法能够学习并较为准确的刻画已知、缺失时相影像之间的非线性关系,相对于线性优化分解方法更具有迁移性和准确性。但其刻画能力与网络架构设计、参数设置有关,较差的网络结构往往不能得到良好的效果,且需要大量训练样本及训练时间。
4 融合数据指标评价
至今,学界已经提出许多融合算法。然而,融合算法的融合效果如何,对时间、空间、光谱信息的保持和复原能力如何,需要进行定性与定量评估。融合影像的定性评估通常通过目视解译实现,即对融合后的单波段影像或RGB合成影像进行目视比对,从图像纹理、色彩变化上定性评估融合的效果。定量评估通常用不同的数值评价指标进行定量化评估,或者通过信息提取如目标探测、地物分类等应用来进行定量化评估。其中,根据是否有参考影像,常用融合指标评价方法可分为两类(Jagalingam和Hegde, 2015)。
4.1 有参考影像的融合评价指标
有参考影像的融合往往通过原始数据模拟出的模拟数据进行融合以得到参考影像,其主要遵守Wald准则(Wald,1997)。Wald准则包括两部分,一致性(consistency property)以及合成性(synthesis property)。一致性是指融合数据B0x在降采样后得到数据B0’应该与原始影像B1相同。合成性是指原始影像A0和B1降采样后得到的数据A1和B2在融合之后获得的数据可以用原始的A0数据作为参考数据。在大部分情况下,Wald准则在融合质量评价上是有效的,但在如下的情况下有一定限制(Thomas和Wald,2006):(1)数据包含噪声时,准则无效;(2)准则的适用性依赖于降采样倍数。
有参考影像的融合评价指标通常通过对比较评价参考影像及融合影像之间的在光谱维、空间维上的相关统计量实现融合质量评价。常见的评价指标有光谱角SAM(Spectral Angle Mapper) (Zhang 等,2009),光谱信息散度SID(Spectral Information Divergence) (Chang, 1999),通用图像质量指数UIQI(Universal Image Quality Index) (Li 等,2012),均方根误差RMSE(Root Mean Square Error) (Wei 等,2015a),相对平均光谱误差RASE(Relative Average Spectral Error) (Choi, 2006),信噪比SNR(Signal Noise Ratio) (Zhang 等,2009),峰值信噪比PSNR(Peak Signal Noise Ratio) (Huynh-Thu和Ghanbari, 2008),相关系数CC(the Correlation Coefficient) (Alparone 等,2007),结构相似参数SSIM(the Structural Similarity Metric) (Wang 等,2004),全局综合误差指标(ERGAS) (Zurita-Milla 等,2008),平均偏差MB(Mean Bias) (Yusuf 等,2013)等。各个指标的概述、最佳值及参考文献详见表6。
表 6 有参考影像的融合质量评价指标
Table 6 Fusion result assessment methods with reference image
| 评价指标 | 概述 | 常用融合场景 | 参考文献 | ||
| 空间维提升 | 光谱维提升 | 时间维提升 | |||
| 光谱信息散度 | 通过计算参考影像与融合影像像元的交叉熵,以反映光谱失真情况 | √ | (Chang, 1999) | ||
| 光谱角 | 通过计算参考影像与融合影像逐像元向量之间的光谱角,以反映融合数据的光谱失真(spectral distortion)情况 | √ | (Zhang 等,2009) | ||
| 通用图像质量指数 | 利用参考影像与融合影像之间的协方差、均值以及方差对融合数据的空间细节进行评估 | √ | √ | (Li 等,2012) | |
| 均方根误差 | 常用的衡量参考影像与融合影像之间的误差,可逐波段计算,或将所有波段相加,获得总体误差(Total Error) | √ | √ | (Wei 等,2015a) | |
| 相对平均光谱误差 | 在均方根的基础上,衡量融合算法在影像的所有波段上的平均性能 | √ | (Choi, 2006) | ||
| 信噪比 | 将参考影像与融合影像的差值视为噪声,参考影像视为信号,计算其比值,来衡量影像的失真情况 | √ | (Zhang 等,2009) | ||
| 峰值信噪比 | 在均方差(MSE)的基础上,通过计算重建影像最大峰值和两个图像均方差的比值,来反映融合重建影像的质量 | √ | (Huynh-Thu和Ghanbari, 2008) | ||
| 相关系数 | 通过计算融合影像与参考影像像元与平均像元间的差异获得相关系数 | √ | √ | (Alparone 等,2007) | |
| 结构相似参数 | 通过计算融合影像与参考影响的均值、方差和协方差来衡量整体的融合
质量 |
√ | √ | (Wang 等,2004) | |
| 全局综合误差指标 | 在RMSE的基础上,考虑融合影像与观测影像之间的尺度关系 | √ | √ | (Zurita-Milla 等,2008) | |
| 平均偏差 | 融合影像和参考影像的均值的差值来衡量融合效果 | √ | (Yusuf 等,2013) | ||
4.2 无参考影像的融合评价指标
在大部分融合场景中,参考影像都难以获取。因此,直接利用原始数据以及融合重建数据,在原始的分辨率尺度上进行指标评价,在无参考影像的融合目标下更具有意义。常见的融合质量评价指标有无参考质量指标QNR(Quality with No Reference) (Alparone 等,2008),均值(Mean Value)(Ghassemian, 2016)、方差(Variance)(Ghassemian, 2016)和标准差(Standard Deviation)(Ghassemian, 2016)、信息熵(Information Entropy)(Ghassemian, 2016)和平均梯度(Average Gradient)(Ghassemian, 2016)等。各个指标的概述、公式、最佳值及适用范围详见表7。
表 7 无参考影像的融合质量评价指标
Table 7 Fusion result assessment methods without reference image
| 评价指标 | 概述 | 常用融合场景 | 参考文献 | ||
| 空间维
提升 |
光谱维
提升 |
时间维
提升 |
|||
| 无参考质量指标 | 不需要融合参考数据,从光谱失真、空间失真两者综合指标
进行衡量评估。适用于多光谱—全色影像融合 |
√ | √ | (Alparone 等,2008) | |
| 均值 | 融合重建数据每个波段图像的所有像元的平均值 | √ | √ | (Ghassemian, 2016) | |
| 方差 | 融合重建数据每个波段影像相对于平均值的离散情况 | √ | √ | (Ghassemian, 2016) | |
| 标准差 | 融合重建数据每个波段影像相对于平均值的离散情况 | √ | √ | (Ghassemian, 2016) | |
| 信息熵 | 融合重建数据每个波段影像的信息量 | √ | √ | (Ghassemian, 2016) | |
| 平均梯度 | 单波段影像细节反差变化速率,表征图像清晰程度 | √ | √ | (Ghassemian, 2016) | |
5 结 论
遥感数据融合由于其能综合不同数据的长处,近几十年来得到了长足的发展,出现了丰富多样的融合算法,部分已被学界广泛使用。根据提升指标的不同,遥感数据融合可以分为基于空间维提升的融合算法、基于光谱维提升的融合算法以及基于时间维提升的融合算法。其中,根据算法机理,基于空间维提升的融合算法可分为成分替换法、多分辨率分析法;基于光谱维提升的融合算法可以分为线性优化分解法和深度学习法;基于时间维提升的融合算法可以分为权重滤波方法、线性优化分解法及深度学习方法。纵观融合算法的发展历程,其发展特点和方向有:
(1) 多指标综合。即时间维、空间维、光谱维多特征多指标的提升。学界从空谱融合、时空融合的两种指标提升,发展至时、空、谱三维指标综合提升。
(2) 多源传感器综合。即综合不同指标、不同种类传感器数据的长处,从两个传感器数据融合,发展至可见光多种传感器融合;从可见光单一种类数据融合,发展至可见光与雷达数据、热红外数据等多种类数据融合。
(3) 融合精度不断提高。在已有的算法上进行改进,使得算法精度不断提高,如ESTARFM是在STARFM算法上进行改进,提高了不同地物类型的时空融合算法精度;基于MAP发展而来的SMM、线性贝叶斯、分层贝叶斯等算法,相比于MAP在精度上都有所提升。
(4) 算法鲁棒性增强。算法在最初被提出时,只能在一定条件下获得较好的融合效果,或者对系数变化较为敏感。如小波融合算法对变化域系数十分敏感,容易出现空间域上的失真现象。而后面提出的概率统计算法,则在空间、光谱维上具有更好的鲁棒性,且对光谱重采样没有要求。
其中,深度学习作为近年来融合算法发展的新方向,由于刻画观测数据间的非线性关系的能力,以及具有强大的学习能力,在数据融合算法中具有不可小觑的潜力,可视为未来融合算法的发展方向。然而现今的基于深度学习的算法刚刚起步,仍有一定的不足之处,有待进一步的发展与创新。
参考文献(References)
-
Adams J B, Smith M O and Johnson P E. 1986. Spectral mixture modeling: a new analysis of rock and soil types at the Viking Lander 1 sites. Journal of Geophysical Research: Solid Earth, 91 (B8): 8098–8112. [DOI: 10.1029/JB091iB08p08098]
-
Aiazzi B, Baronti S and Selva M. 2007. Improving component substitution pansharpening through multivariate regression of MS+Pan data. IEEE Transactions on Geoscience and Remote Sensing, 45 (10): 3230–3239. [DOI: 10.1109/tgrs.2007.901007]
-
Alparone L, Aiazzi B, Baronti S, Garzelli A, Nencini F and Selva M. 2008. Multispectral and panchromatic data fusion assessment without reference. Photogrammetric Engineering and Remote Sensing, 74 (2): 193–200. [DOI: 10.14358/pers.74.2.193]
-
Alparone L, Wald L, Chanussot J, Thomas C, Gamba P and Bruce L M. 2007. Comparison of pansharpening algorithms: outcome of the 2006 GRS-S data-fusion contest. IEEE Transactions on Geoscience and Remote Sensing, 45 (10): 3012–3021. [DOI: 10.1109/TGRS.2007.904923]
-
Amorós-López J, Gómez-Chova L, Alonso L, Guanter L, Zurita-Milla R, Moreno J and Camps-Valls G. 2013. Multitemporal fusion of Landsat/TM and ENVISAT/MERIS for crop monitoring. International Journal of Applied Earth Observation and Geoinformation, 23 : 132–141. [DOI: 10.1016/j.jag.2012.12.004]
-
Azarang A and Ghassemian H. 2017. A new pansharpening method using multi resolution analysis framework and deep neural networks//Proceedings of the 3rd International Conference on Pattern Recognition and Image Analysis. Shahrekord, Iran: IEEE: 1-6 [DOI: 10.1109/PRIA.2017.7983017]
-
Bendoumi M A, He M Y and Mei S H. 2014. Hyperspectral image resolution enhancement using high-resolution multispectral image based on spectral unmixing. IEEE Transactions on Geoscience and Remote Sensing, 52 (10): 6574–6583. [DOI: 10.1109/tgrs.2014.2298056]
-
Chang C I. 1999. Spectral information divergence for hyperspectral image analysis//Proceedings of 1999 International Geoscience and Remote Sensing Symposium. Hamburg, Germany: IEEE [DOI: 10.1109/IGARSS.1999.773549]
-
Chavez P C Jr, Sides S C and Anderson J A. 1991. Comparison of three different methods to merge multiresolution and multispectral data: Landsat TM and SPOT panchromatic. Photogrammetric Engineering and Remote Sensing, 57 (3): 295–303.
-
Chen Z, Pu H Y, Wang B and Jiang G M. 2014. Fusion of hyperspectral and multispectral images: a novel framework based on generalization of pan-sharpening methods. IEEE Geoscience and Remote Sensing Letters, 11 (8): 1418–1422. [DOI: 10.1109/LGRS.2013.2294476]
-
Chen Z X, Ren J Q, Tang H J, Shi Y, Leng P, Liu J, Wang L M, Wu W B, Yao Y M and Hasiyuya. 2016. Progress and perspectives on agricultural remote sensing research and applications in China. Journal of Remote Sensing, 20 (5): 748–767. [DOI: 10.11834/jrs.20166214] ( 陈仲新, 任建强, 唐华俊, 史云, 冷佩, 刘佳, 王利民, 吴文斌, 姚艳敏, 哈斯图亚. 2016. 农业遥感研究应用进展与展望. 遥感学报, 20 (5): 748–767. [DOI: 10.11834/jrs.20166214] )
-
Choi M. 2006. A new intensity-hue-saturation fusion approach to image fusion with a tradeoff parameter. IEEE Transactions on Geoscience and Remote Sensing, 44 (6): 1672–1682. [DOI: 10.1109/tgrs.2006.869923]
-
Do M N and Vetterli M. 2005. The contourlet transform: an efficient directional multiresolution image representation. IEEE Transactions on Image Processing, 14 (12): 2091–2106. [DOI: 10.1109/TIP.2005.859376]
-
Eismann M T and Hardie R C. 2003. Resolution enhancement of hyperspectral imagery using coincident panchromatic imagery and a stochastic mixing model//Proceedings of IEEE Workshop on Advances in Techniques for Analysis of Remotely Sensed Data. Greenbelt, MD, USA: IEEE: 282-289 [DOI: 10.1109/WARSD.2003.1295206]
-
Eismann M T and Hardie R C. 2005. Hyperspectral resolution enhancement using high-resolution multispectral imagery with arbitrary response functions. IEEE Transactions on Geoscience and Remote Sensing, 43 (3): 455–465. [DOI: 10.1109/tgrs.2004.837324]
-
Elad M, Figueiredo M A T and Ma Y. 2010. On the role of sparse and redundant representations in image processing. Proceedings of the IEEE, 98 (6): 972–982. [DOI: 10.1109/jproc.2009.2037655]
-
Fu D J, Chen B Z, Wang J, Zhu X L and Hilker T. 2013. An improved image fusion approach based on enhanced spatial and temporal the adaptive reflectance fusion model. Remote Sensing, 5 (12): 6346–6360. [DOI: 10.3390/rs5126346]
-
Gao F, Masek J, Schwaller M and Hall F. 2006. On the blending of the Landsat and MODIS surface reflectance: predicting daily Landsat surface reflectance. IEEE Transactions on Geoscience and Remote Sensing, 44 (8): 2207–2218. [DOI: 10.1109/TGRS.2006.872081]
-
Ge Z R, Wang B and Zhang L M. 2007. Remote sensing image fusion based on Bayesian linear estimation. Science in China Series F: Information Sciences, 50 (2): 227–240. [DOI: 10.1007/s11432-007-0008-7]
-
Ghassemian H. 2016. A review of remote sensing image fusion methods. Information Fusion, 32 : 75–89. [DOI: 10.1016/j.inffus.2016.03.003]
-
Gross H N and Schott J R. 1998. Application of spectral mixture analysis and image fusion techniques for image sharpening. Remote Sensing of Environment, 63 (2): 85–94. [DOI: 10.1016/S0034-4257(97)00090-4]
-
Han C, Zhang H Y, Gao C X, Jiang C, Sang N and Zhang L P. 2016. A remote sensing image fusion method based on the analysis sparse model. IEEE Journal of Selected Topics in Applied Earth Observations and Remote Sensing, 9 (1): 439–453. [DOI: 10.1109/JSTARS.2015.2507859]
-
Hardie R C, Eismann M T and Wilson G L. 2004. MAP estimation for hyperspectral image resolution enhancement using an auxiliary sensor. IEEE Transactions on Image Processing, 13 (9): 1174–1184. [DOI: 10.1109/TIP.2004.829779]
-
Hilker T, Wulder M A, Coops N C, Linke J, McDermid G, Masek J G, Gao F and White J C. 2009. A new data fusion model for high spatial- and temporal-resolution mapping of forest disturbance based on Landsat and MODIS. Remote Sensing of Environment, 113 (8): 1613–1627. [DOI: 10.1016/j.rse.2009.03.007]
-
Huang B and Song H H. 2012. Spatiotemporal reflectance fusion via sparse representation. IEEE Transactions on Geoscience and Remote Sensing, 50 (10): 3707–3716. [DOI: 10.1109/TGRS.2012.2186638]
-
Huang B, Song H H, Cui H B, Peng J G and Xu Z B. 2014. Spatial and spectral image fusion using sparse matrix factorization. IEEE Transactions on Geoscience and Remote Sensing, 52 (3): 1693–1704. [DOI: 10.1109/TGRS.2013.2253612]
-
Huang B, Wang J, Song H H, Fu D J and Wong K. 2013. Generating high spatiotemporal resolution land surface temperature for urban heat island monitoring. IEEE Geoscience and Remote Sensing Letters, 10 (5): 1011–1015. [DOI: 10.1109/LGRS.2012.2227930]
-
Huang W, Xiao L, Wei Z H, Liu H Y and Tang S Z. 2015. A new pan-sharpening method with deep neural networks. IEEE Geoscience and Remote Sensing Letters, 12 (5): 1037–1041. [DOI: 10.1109/LGRS.2014.2376034]
-
Huang Z, Yu X C, Wang G A and Wang Z N. 2008. Application of several non-negative matrix factorization-based methods in remote sensing image fusion//Proceedings of the Fifth International Conference on Fuzzy Systems and Knowledge Discovery. Shandong, China: IEEE [DOI: 10.1109/FSKD.2008.439]
-
Huynh-Thu Q and Ghanbari M. 2008. Scope of validity of PSNR in image/video quality assessment. Electronics Letters, 44 (13): 800–801. [DOI: 10.1049/el:20080522]
-
Jagalingam P and Hegde A V. 2015. A review of quality metrics for fused image. Aquatic Procedia, 4 : 133–142. [DOI: 10.1016/j.aqpro.2015.02.019]
-
Li D, Hao M F, Zhang J Q, Hu B and Lu Q Y. 2012. A universal hypercomplex color image quality index//Proceedings of 2012 IEEE International Instrumentation and Measurement Technology Conference. Graz, Austria: IEEE: 985-990 [DOI: 10.1109/I2MTC.2012.6229639]
-
Li S T and Yang B. 2011. A new pan-sharpening method using a compressed sensing technique. IEEE Transactions on Geoscience and Remote Sensing, 49 (2): 738–746. [DOI: 10.1109/TGRS.2010.2067219]
-
Liao C H, Wang J F, Pritchard I, Liu J G and Shang J L. 2017. A spatio-temporal data fusion model for generating NDVI time series in heterogeneous regions. Remote Sensing, 9 (11): 1125 [DOI: 10.3390/rs9111125]
-
Liao L M, Song J L, Wang J D, Xiao Z Q and Wang J. 2016. Bayesian method for building frequent Landsat-like NDVI datasets by integrating MODIS and Landsat NDVI. Remote Sensing, 8 (6): 452 [DOI: 10.3390/rs8060452]
-
Liu J G. 2000. Smoothing filter-based intensity modulation: a spectral preserve image fusion technique for improving spatial details. International Journal of Remote Sensing, 21 (18): 3461–3472. [DOI: 10.1080/014311600750037499]
-
Liu X, Deng C W, Wang S G, Huang G B, Zhao B J and Lauren P. 2016. Fast and accurate spatiotemporal fusion based upon extreme learning machine. IEEE Geoscience and Remote Sensing Letters, 13 (12): 2039–2043. [DOI: 10.1109/LGRS.2016.2622726]
-
Lu M, Chen J, Tang H J, Rao Y H, Yang P and Wu W B. 2016. Land cover change detection by integrating object-based data blending model of Landsat and MODIS. Remote Sensing of Environment, 184 : 374–386. [DOI: 10.1016/j.rse.2016.07.028]
-
Masi G, Cozzolino D, Verdoliva L and Scarpa G. 2016. Pansharpening by convolutional neural networks. Remote Sensing, 8 (7): 594 [DOI: 10.3390/rs8070594]
-
Moosavi V, Talebi A, Mokhtari M H, Shamsi S R F and Niazi Y. 2015. A wavelet-artificial intelligence fusion approach (WAIFA) for blending Landsat and MODIS surface temperature. Remote Sensing of Environment, 169 : 243–254. [DOI: 10.1016/j.rse.2015.08.015]
-
Nencini F, Garzelli A, Baronti S and Alparone L. 2007. Remote sensing image fusion using the curvelet transform. Information Fusion, 8 (2): 143–156. [DOI: 10.1016/j.inffus.2006.02.001]
-
Nunez J, Otazu X, Fors O, Prades A, Palà V and Arbiol R. 1999. Multiresolution-based image fusion with additive wavelet decomposition. IEEE Transactions on Geoscience and Remote Sensing, 37 (3): 1204–1211. [DOI: 10.1109/36.763274]
-
Palsson F, Sveinsson J R and Ulfarsson M O. 2017. Multispectral and hyperspectral image fusion using a 3-D-convolutional neural network. IEEE Geoscience and Remote Sensing Letters, 14 (5): 639–643. [DOI: 10.1109/LGRS.2017.2668299]
-
Pohl C and Van Genderen J L. 1998. Review article Multisensor image fusion in remote sensing: concepts, methods and applications. International Journal of Remote Sensing, 19 (5): 823–854. [DOI: 10.1080/014311698215748]
-
Schmitt M and Zhu X X. 2016. Data fusion and remote sensing: an ever-growing relationship. IEEE Geoscience and Remote Sensing Magazine, 4 (4): 6–23. [DOI: 10.1109/MGRS.2016.2561021]
-
Shettigara V K. 1992. A generalized component substitution technique for spatial enhancement of multispectral images using a higher resolution data set. Photogrammetric Engineering and Remote Sensing, 58 (5): 561–567.
-
Song H H, Liu Q S, Wang G J, Hang R L and Huang B. 2018. Spatiotemporal satellite image fusion using deep convolutional neural networks. IEEE Journal of Selected Topics in Applied Earth Observations and Remote Sensing, 11 (3): 821–829. [DOI: 10.1109/JSTARS.2018.2797894]
-
Sun X J, Zhang L F, Yang H, Wu T X, Cen Y and Guo Y. 2015. Enhancement of spectral resolution for remotely sensed multispectral image. IEEE Journal of Selected Topics in Applied Earth Observations and Remote Sensing, 8 (5): 2198–2211. [DOI: 10.1109/jstars.2014.2356512]
-
Tan Z Y, Yue P, Di L P and Tang J M. 2018. Deriving high spatiotemporal remote sensing images using deep convolutional network. Remote Sensing, 10 (7): 1066 [DOI: 10.3390/rs10071066]
-
Tang H J, Wu W B, Yang P, Zhou Q B and Chen Z X. 2010. Recent progresses in monitoring crop spatial patterns by using remote sensing technologies. Scientia Agricultura Sinica, 43 (14): 2879–2888. [DOI: 10.3864/j.issn.0578-1752.2010.14.006] ( 唐华俊, 吴文斌, 杨鹏, 周清波, 陈仲新. 2010. 农作物空间格局遥感监测研究进展. 中国农业科学, 43 (14): 2879–2888. [DOI: 10.3864/j.issn.0578-1752.2010.14.006] )
-
Thomas C and Wald L. 2006. Analysis of changes in quality assessment with scale//Proceedings of the 9th International Conference on Information Fusion. Florence, Italy: IEEE [DOI: 10.1109/ICIF.2006.301595]
-
Tong Q X, Xue Y Q and Zhang L F. 2014. Progress in hyperspectral remote sensing science and technology in China over the past three decades. IEEE Journal of Selected Topics in Applied Earth Observations and Remote Sensing, 7 (1): 70–91. [DOI: 10.1109/jstars.2013.2267204]
-
Tu T M, Lee Y C, Chang C P and Huang P S. 2005. Adjustable intensity-hue-saturation and Brovey transform fusion technique for IKONOS/QuickBird imagery. Optical Engineering, 44 (11): 116201 [DOI: 10.1117/1.2124871]
-
Tu T M, Su S C, Shyu H C and Huang P S. 2001. A new look at IHS-like image fusion methods. Information Fusion, 2 (3): 177–186. [DOI: 10.1016/s1566-2535(01)00036-7]
-
Wald L, Ranchin T, Mangolini M. 1997. Fusion of satellite images of different spatial resolutions: assessing the quality of resulting images. Photogrammetric Engineering and Remote Sensing, 63 (6): 691–699.
-
Wang J and Huang B. 2017. A rigorously-weighted spatiotemporal fusion model with uncertainty analysis. Remote Sensing, 9 (10): 990 [DOI: 10.3390/rs9100990]
-
Wang J Y, Wang Y M and Li C L. 2010. Noise model of hyperspectral imaging system and influence on radiation sensitivity. Journal of Remote Sensing, 14 (4): 607–620. ( 王建宇, 王跃明, 李春来. 2010. 高光谱成像系统的噪声模型和对辐射灵敏度的影响. 遥感学报, 14 (4): 607–620. )
-
Wang Z, Bovik A C, Sheikh H R and Simoncelli E P. 2004. Image quality assessment: from error visibility to structural similarity. IEEE Transactions on Image Processing, 13 (4): 600–612. [DOI: 10.1109/TIP.2003.819861]
-
Wei J B, Wang L Z, Liu P, Chen X D, Li W and Zomaya A Y. 2017a. Spatiotemporal fusion of MODIS and Landsat-7 reflectance images via compressed sensing. IEEE Transactions on Geoscience and Remote Sensing, 55 (12): 7126–7139. [DOI: 10.1109/TGRS.2017.2742529]
-
Wei J B, Wang L Z, Liu P and Song W J. 2017b. Spatiotemporal fusion of remote sensing images with structural sparsity and semi-coupled dictionary learning. Remote Sensing, 9 (1): 21 [DOI: 10.3390/rs9010021]
-
Wei Q, Bioucas-Dias J, Dobigeon N and Tourneret J Y. 2015. Hyperspectral and multispectral image fusion based on a sparse representation. IEEE Transactions on Geoscience and Remote Sensing, 53 (7): 3658–3668. [DOI: 10.1109/TGRS.2014.2381272]
-
Wei Q, Dobigeon N and Tourneret J Y. 2014a. Bayesian fusion of hyperspectral and multispectral images//Proceedings of 2014 IEEE International Conference on Acoustics, Speech and Signal Processing. Florence, Italy: IEEE: 3176-3180 [DOI: 10.1109/ICASSP.2014.6854186]
-
Wei Q, Dobigeon N and Tourneret J Y. 2014b. Bayesian fusion of multispectral and hyperspectral images with unknown sensor spectral response//Proceedings of 2014 IEEE International Conference on Image Processing. Paris, France: IEEE: 698-702 [DOI: 10.1109/ICIP.2014.7025140]
-
Wei Y C, Yuan Q Q, Shen H F and Zhang L P. 2017. Boosting the accuracy of multispectral image pansharpening by learning a deep residual network. IEEE Geoscience and Remote Sensing Letters, 14 (10): 1795–1799. [DOI: 10.1109/LGRS.2017.2736020]
-
Weng Q H, Fu P and Gao F. 2014. Generating daily land surface temperature at Landsat resolution by fusing Landsat and MODIS data. Remote Sensing of Environment, 145 : 55–67. [DOI: 10.1016/j.rse.2014.02.003]
-
Wu B, Huang B and Zhang L P. 2015. An error-bound-regularized sparse coding for spatiotemporal reflectance fusion. IEEE Transactions on Geoscience and Remote Sensing, 53 (12): 6791–6803. [DOI: 10.1109/TGRS.2015.2448100]
-
Wu M Q, Huang W J, Niu Z and Wang C Y. 2015. Generating daily synthetic Landsat imagery by combining Landsat and MODIS data. Sensors, 15 (9): 24002–24025. [DOI: 10.3390/s150924002]
-
Wu M Q, Niu Z, Wang C Y, Wu C Y and Wang L. 2012. Use of MODIS and Landsat time series data to generate high-resolution temporal synthetic Landsat data using a spatial and temporal reflectance fusion model. Journal of Applied Remote Sensing, 6 (1): 063507 [DOI: 10.1117/1.JRS.6.063507]
-
Wu P H, Shen H F, Zhang L P and Göttsche F M. 2015. Integrated fusion of multi-scale polar-orbiting and geostationary satellite observations for the mapping of high spatial and temporal resolution land surface temperature. Remote Sensing of Environment, 156 : 169–181. [DOI: 10.1016/j.rse.2014.09.013]
-
Xue J, Leung Y and Fung T. 2017. A Bayesian data fusion approach to spatio-temporal fusion of remotely sensed images. Remote Sensing, 9 (12): 1310 [DOI: 10.3390/rs9121310]
-
Yokoya N, Yairi T and Iwasaki A. 2012. Coupled nonnegative matrix factorization unmixing for hyperspectral and multispectral data fusion. IEEE Transactions on Geoscience and Remote Sensing, 50 (2): 528–537. [DOI: 10.1109/tgrs.2011.2161320]
-
Yuan Q Q, Wei Y C, Meng X C, Shen H F and Zhang L P. 2018. A multiscale and multidepth convolutional neural network for remote sensing imagery pan-sharpening. IEEE Journal of Selected Topics in Applied Earth Observations and Remote Sensing, 11 (3): 978–989. [DOI: 10.1109/JSTARS.2018.2794888]
-
Yusuf Y, Sumantyo J T S and Kuze H. 2013. Spectral information analysis of image fusion data for remote sensing applications. Geocarto International, 28 (4): 291–310. [DOI: 10.1080/10106049.2012.692396]
-
Zhang L P and Shen H F. 2016. Progress and future of remote sensing data fusion. Journal of Remote Sensing, 20 (5): 1050–1061. [DOI: 10.11834/jrs.20166243] ( 张良培, 沈焕锋. 2016. 遥感数据融合的进展与前瞻. 遥感学报, 20 (5): 1050–1061. [DOI: 10.11834/jrs.20166243] )
-
Zhang W, Li A N, Jin H A, Bian J H, Zhang Z J, Lei G B, Qin Z H and Huang C Q. 2013. An enhanced spatial and temporal data fusion model for fusing Landsat and MODIS surface reflectance to generate high temporal Landsat-like data. Remote Sensing, 5 (10): 5346–5368. [DOI: 10.3390/rs5105346]
-
Zhang Y F. 2012. Wavelet-based Bayesian fusion of multispectral and hyperspectral images using Gaussian scale mixture model. International Journal of Image and Data Fusion, 3 (1): 23–37. [DOI: 10.1080/19479832.2010.551522]
-
Zhang Y F, De Backer S and Scheunders P. 2009. Noise-resistant wavelet-based Bayesian fusion of multispectral and hyperspectral images. IEEE Transactions on Geoscience and Remote Sensing, 47 (11): 3834–3843. [DOI: 10.1109/tgrs.2009.2017737]
-
Zhu X L, Cai F Y, Tian J Q and Williams T K A. 2018. Spatiotemporal fusion of multisource remote sensing data: literature survey, taxonomy, principles, applications, and future directions. Remote Sensing, 10 (4): 527 [DOI: 10.3390/rs10040527]
-
Zhu X L, Chen J, Gao F, Chen X H and Masek J G. 2010. An enhanced spatial and temporal adaptive reflectance fusion model for complex heterogeneous regions. Remote Sensing of Environment, 114 (11): 2610–2623. [DOI: 10.1016/j.rse.2010.05.032]
-
Zhukov B, Oertel D, Lanzl F and Reinhackel G. 1999. Unmixing-based multisensor multiresolution image fusion. IEEE Transactions on Geoscience and Remote Sensing, 37 (3): 1212–1226. [DOI: 10.1109/36.763276]
-
Zurita-Milla R, Clevers J G P W and Schaepman M E. 2008. Unmixing-based Landsat TM and MERIS FR data fusion. IEEE Geoscience and Remote Sensing Letters, 5 (3): 453–457. [DOI: 10.1109/lgrs.2008.919685]