
|
收稿日期: 2017-06-29
基金项目: 国家自然科学基金(编号:41774162,41574146);中国地震局地震预测研究所基本科研业务费(编号:2015IES010103)
第一作者简介: 刘祎,1993年生,男,博士研究生,研究方向为中低纬电离层物理。E-mail:liuyiwhuhan@whu.edu.cn
通信作者简介: 周晨,1983年生,男,副教授,研究方向为地球空间环境及电离层电波传播。E-mail:chenzhou@whu.edu.cn
中图分类号: P352.1
文献标识码: A
|
摘要
全球电离层分布特别是f0F2和hmF2对雷达探测、无线电通信以及卫星导航等有非常大的影响,为研究全球f0F2和hmF2的时空分布,利用全球导航卫星定位系统(GNSS)掩星数据统计分析了全球f0F2和hmF2的周年变化特性、日变化特性以及季节变化特性,并通过与日本地区测高仪站f0F2数据进行对比,分析了两种探测方式获取电离层参数的相关性。结果表明,全球f0F2和hmF2周年变化与太阳活动和地磁活动具有明显的正相关性,f0F2和hmF2还具有明显的空间分布特性。此外,全球f0F2和hmF2峰值出现在LT 14:00—16:00期间,且hmF2出现明显的日落后赤道电离异常复苏现象。全球f0F2具有比较明显的季节变化特性,f0F2峰值出现在春秋季中低纬地区,在夏冬季较小,且出现比较明显的冬季异常现象,而hmF2季节分布相比f0F2并不明显。通过和日本地区Wakkanai、Kokubunji、Yamagawa以及Okinawa测高仪站f0F2数据对比,发现两种探测手段获取的电离层参数具有较好的相关性。初步研究表明,全球f0F2和hmF2分布受到多种因素的影响,其中太阳活动和地磁活动占主要地位,其次是电场、热层风以及高能粒子沉降等。
关键词
f0F2和hmF2周年变化, f0F2和hmF2日变化, f0F2和hmF2季节变化, 测高仪, GNSS
Abstract
The ionosphere is an atmospheric region ionized by solar radiation, cosmic rays, and various particle radiations ranging from 60 km to 1000 km above the earth. Numerous free electrons and ions in the ionosphere can interfere with radio signals. Ionospheric parameters, especially F2 layer critical frequency (f0F2) and electron density peak height (hmF2), play an important role in the propagation of HF waves. Therefore, the study of f0F2 and hmF2, especially its global distribution, is important. The overall objective of this paper is to study the annual, diurnal, and seasonal variations of f0F2 andhmF2 in the world on the basis of GNSS occulation datasets and to compare the values f0F2 obtained by GNSS occultation and digisondes from all stations in Japan. COSMIC, GRACE, and CHAMP electron density profile datasets and digisonde datasets in Wakkanai, Kokubunji, Yamagawa, and Okinawa for 2002—2016 are selected as the data sources. The maximum electron density NmF2 and hmF2 is obtained by using the electron density profile. Compared with ionosonde f0F2 datasets, the latitude and longitude of the selected NmF2 are within 5 degrees of ionosondes, and the time of the selected NmF2 is within 15 minutes of ionosondes. Results show that the annual variation of f0F2 andhmF2 has a significant positive correlation with solar activity and geomagnetic activity and significant spatial distribution characteristics. The maximum value of f0F2 distribution on both sides of the magnetic equator is approximately 15 degrees, and the maximum value of hmF2 distribution in the equatorial region and the northern and southern hemisphere peak heights is not symmetrical. In addition, the peak value of f0F2 andhmF2 appears during LT 14:00—16:00, and hmF2 exhibits significant equatorial ionization anomaly recovery after sunset. The f0F2 has obvious seasonal characteristics; the peak value of f0F2 appears in spring and autumn at middle and low latitudes, and is evident in abnormal winter phenomenon. However, the seasonal distribution of hmF2 evidently change. The values f0F2, which were obtained by occultation and digisondes from all stations in Japan, were compared, and results indicate that the ionospheric parameters obtained by the two detection methods have acceptable correlation. The correlation in the Okinawa station is the best, with a correlation coefficient of 0.88. The correlation in the Wakkanai station is poor, with a correlation coefficient of 0.75. The correlation between Yamagawa and Kokubunji stations is close at 0.84 and 0.85, respectively. The preliminary study shows that the global f0F2 andhmF2 distribution is affected by many factors, including solar activity, geomagnetic activity, electric field, and wind and high-energy particle sedimentation. The values f0F2 obtained by occultation and digisondes from all stations in Japan were compared, and results show that the ionospheric parameters obtained by the two detection methods have acceptable correlation. However, some evident differences were observed; these differences may be due to the electron density gradient and satellite retrieval technology.
Key words
annual variation of f0F2 andhmF2, diurnal variation of f0F2 andhmF2, seasonal variation of f0F2 andhmF2, digisondes, GNSS
1 引 言
电离层是距地球上空60—1000 km的大气区域,在太阳辐射、宇宙射线以及各种微粒辐射的作用下,由大气电离而成。其中分布着大量的自由电子和离子,会对无线电信号产生干扰,电离层参量特别是
f0F2和hmF2的观测和研究表明,f0F2和hmF2具有明显的日变化、季节变化、太阳活动年变化和空间变化特征(Titheridge和Buonsanto,1983;Yu 等,2004;余涛 等,2008;Maruyama 等,2016)。索玉成(1995)利用1976年—1988年中国8个电离层站的f0F2数据研究发现,f0F2平均值的最大值出现在春秋季,夏季峰值明显下降。Ezquer等人(2004)分析美洲地区14个电离层站电离层参数f0F2和M(3000)F2太阳活动高年(1957年、1958年和1959年)以及太阳活动低年(1964年、1965年和1966年)数据,发现f0F2和M(3000)F2日变化特性随着太阳活动的变化情况(Kouris和Fotiadis,2002;Zhang 等,2004;Amarante 等,2004)。Rishbeth等人(2000)利用全球16个电离层站hmF2数据分析发现,hmF2年分布和太阳活动有着密切的关系,在太阳活动高峰期间,hmF2年平均高度在北半球中纬度地区增加11 km(Yonezawa,1971;Zou 等,2000)。
f0F2和hmF2参量获取主要是通过地基探测包括电离层测高仪、地基雷达和火箭实地探测等,以及通过国际电离层参考模式IRI获取(Balan 等,2000;徐盛 等,2014;Azpilicueta 等,2015;Maruyama 等,2017)。然而这些观测方式以及模型具有很大的局限性,无法获得精确的全球f0F2和hmF2分布,自2001年以来,越来越多的学者通过利用掩星探测手段来对f0F2和hmF2的全球空间分布特性进行研究(Lei 等,2007;Krankowski 等,2011;孙凌峰 等,2014;刘桢迪 等,2016)。McNamara和Thompson(2015)通过利用COSMIC数据反演得到的f0F2和M(3000)F2与澳大利亚电离层测高仪站数据进行对比,发现两者具有很好的一致性(Chuo 等,2011)。Lei等人(2007)研究了Millstone Hill和Jicamarca区域电离层测高仪电子密度数据和COSMIC得到的电子密度剖面的关系,并且给出了NmF2和hmF2的全球分布以及和IRI、TIEGCM模型获得的参数进行对比,发现COSMIC数据和地基观测以及模型得到的数据具有较好的一致性。中国地震电磁卫星于2018年发射(申旭辉 等,2008),地震电磁星的GNSS接收机也可以进行电离层掩星观测,从而为全球电离层特征参数分布提供第一手的观测资料。
目前,通过利用GNSS掩星数据对于f0F2和hmF2全球分布统计研究主要是通过利用单颗卫星的观测数据进行分析,但是由于不同卫星观测数据量存在差异,使统计结果也存在着明显的差异性。为了提高统计结果的准确性,本文主要结合3颗卫星COSMIC、GRACE和CHAMP在2002年—2016年的所有观测数据,对f0F2和hmF2全球分布进行研究。同时讨论了在一个完整的太阳活动周年内,太阳活动等因素对f0F2和hmF2全球分布的影响,并对相应的物理机制进行讨论研究。同时利用2002年—2016年日本地区Wakkanai、Kokubunji、Yamagawa以及Okinawa 4个电离层测高仪站观测数据,分析比较了在相同地区测高仪和掩星探测的f0F2的相关性,并对差异进行初步的分析。
2 数据源
文中选取2002年—2016年COSMIC、GRACE和CHAMP电子密度剖面数据和2002年—2016年日本地区Wakkanai、Kokubunji、Yamagawa以及Okinawa测高仪资料。其中,主要选取地理经纬度变化在5°范围内的电子密度剖面。利用电子密度剖面可以获取F2层最大电子密度NmF2和对应的峰值高度hmF2,利用式(1)将NmF2转化为f0F2。在与测高仪f0F2数据对比时,选取掩星资料NmF2所在的地理经纬度距离4个测高仪站5°范围内,且与测高仪观测时间在15 min范围内。表1为COSMIC、GRACE和CHAMP 3颗卫星的在轨运行时间以及观测数据量信息。表2为4个测高仪站的位置信息。
表 1 GNSS掩星观测信息
Table 1 Observation information of GNSS
| 卫星 | 观测数据量 | 在轨运行时间 |
| COSMIC | 6644159 | 2006年第112天—至今 |
| GRACE | 503225 | 2007年第59天—至今 |
| CHAMP | 468029 | 2001年第139天—2008年第279天 |
表 2 测高仪站位置信息
Table 2 Locations of ionosondes
| 位置 | 地理纬度 | 地理经度 | 地磁纬度 | 地磁经度 |
| Wakkanai | 45.16°N | 141.75°E | 36.4°N | 208.9°E |
| Kokubunji | 35.71°N | 139.49°E | 26.8°N | 208.2°E |
| Yamagawa | 31.20°N | 130.62°E | 21.7°N | 200.5°E |
| Okinawa | 26.68°N | 128.15°E | 17.0°N | 198.6°E |
| ${f_0}{{\rm{F}}_2} = \sqrt {{N_{\rm{m}}}{{\rm{F}}_2}/1.24/{{10}^5}} $ | (1) |
式中,f0F2为电离层F2层临频,NmF2为电离层F2层最大电子密度。
3 结果分析
3.1 f0F2和hmF2全球分布特性
太阳辐射是电离层主要的电离源,因而电离层参量的变化受到太阳活动的影响,研究电离层参量f0F2和hmF2全球分布与太阳活动的相关性是非常必要的。由于太阳辐射几乎完全被高空大气吸收,无法被地面观测到,因此利用太阳F10.7指数和太阳黑子数作为太阳活动参数。此外,地磁活动也是影响f0F2和hmF2全球分布的重要因素之一,因此将Ap指数也作为地磁活动参数(Forbes 等,2000;徐盛 等,2014)。图1为2002年—2016年Ap指数、F10.7指数以及太阳黑子数的分布。从图1中可以看出太阳活动存在明显的11年周期性,2002年—2003年、2014年—2015年为太阳活动高年,2007年—2009年为太阳活动低年。此外,地磁活动也存在相似的变化以及周期性。


利用2002年—2016年COSMIC、GRACE和CHAMP全年所有时刻观测数据统计全球f0F2和hmF2分布,采取2°×2°×1 h网格大小。图2、图3分别为2002年—2016年全球f0F2和hmF2周年分布,其中2004年数据缺失。从图2、图3中可以看出f0F2和hmF2周年分布和太阳活动以及地磁活动有着明显的相关性,在太阳活动高年以及地磁活动高峰期(2002年—2003年和2014年—2015年),f0F2和hmF2普遍升高,最大值分别可以达到14 MHz和450 km。而在太阳活动低年和地磁活动平静期(2007年—2009年),f0F2和hmF2相对较小,最大值分别为10 MHz和300 km。此外,从图2、图3中还可以看出f0F2最大值分布在磁赤道两侧大约15°的纬度区域,而hmF2最大值分布在赤道区域,且南北半球的峰高并不是对称的。
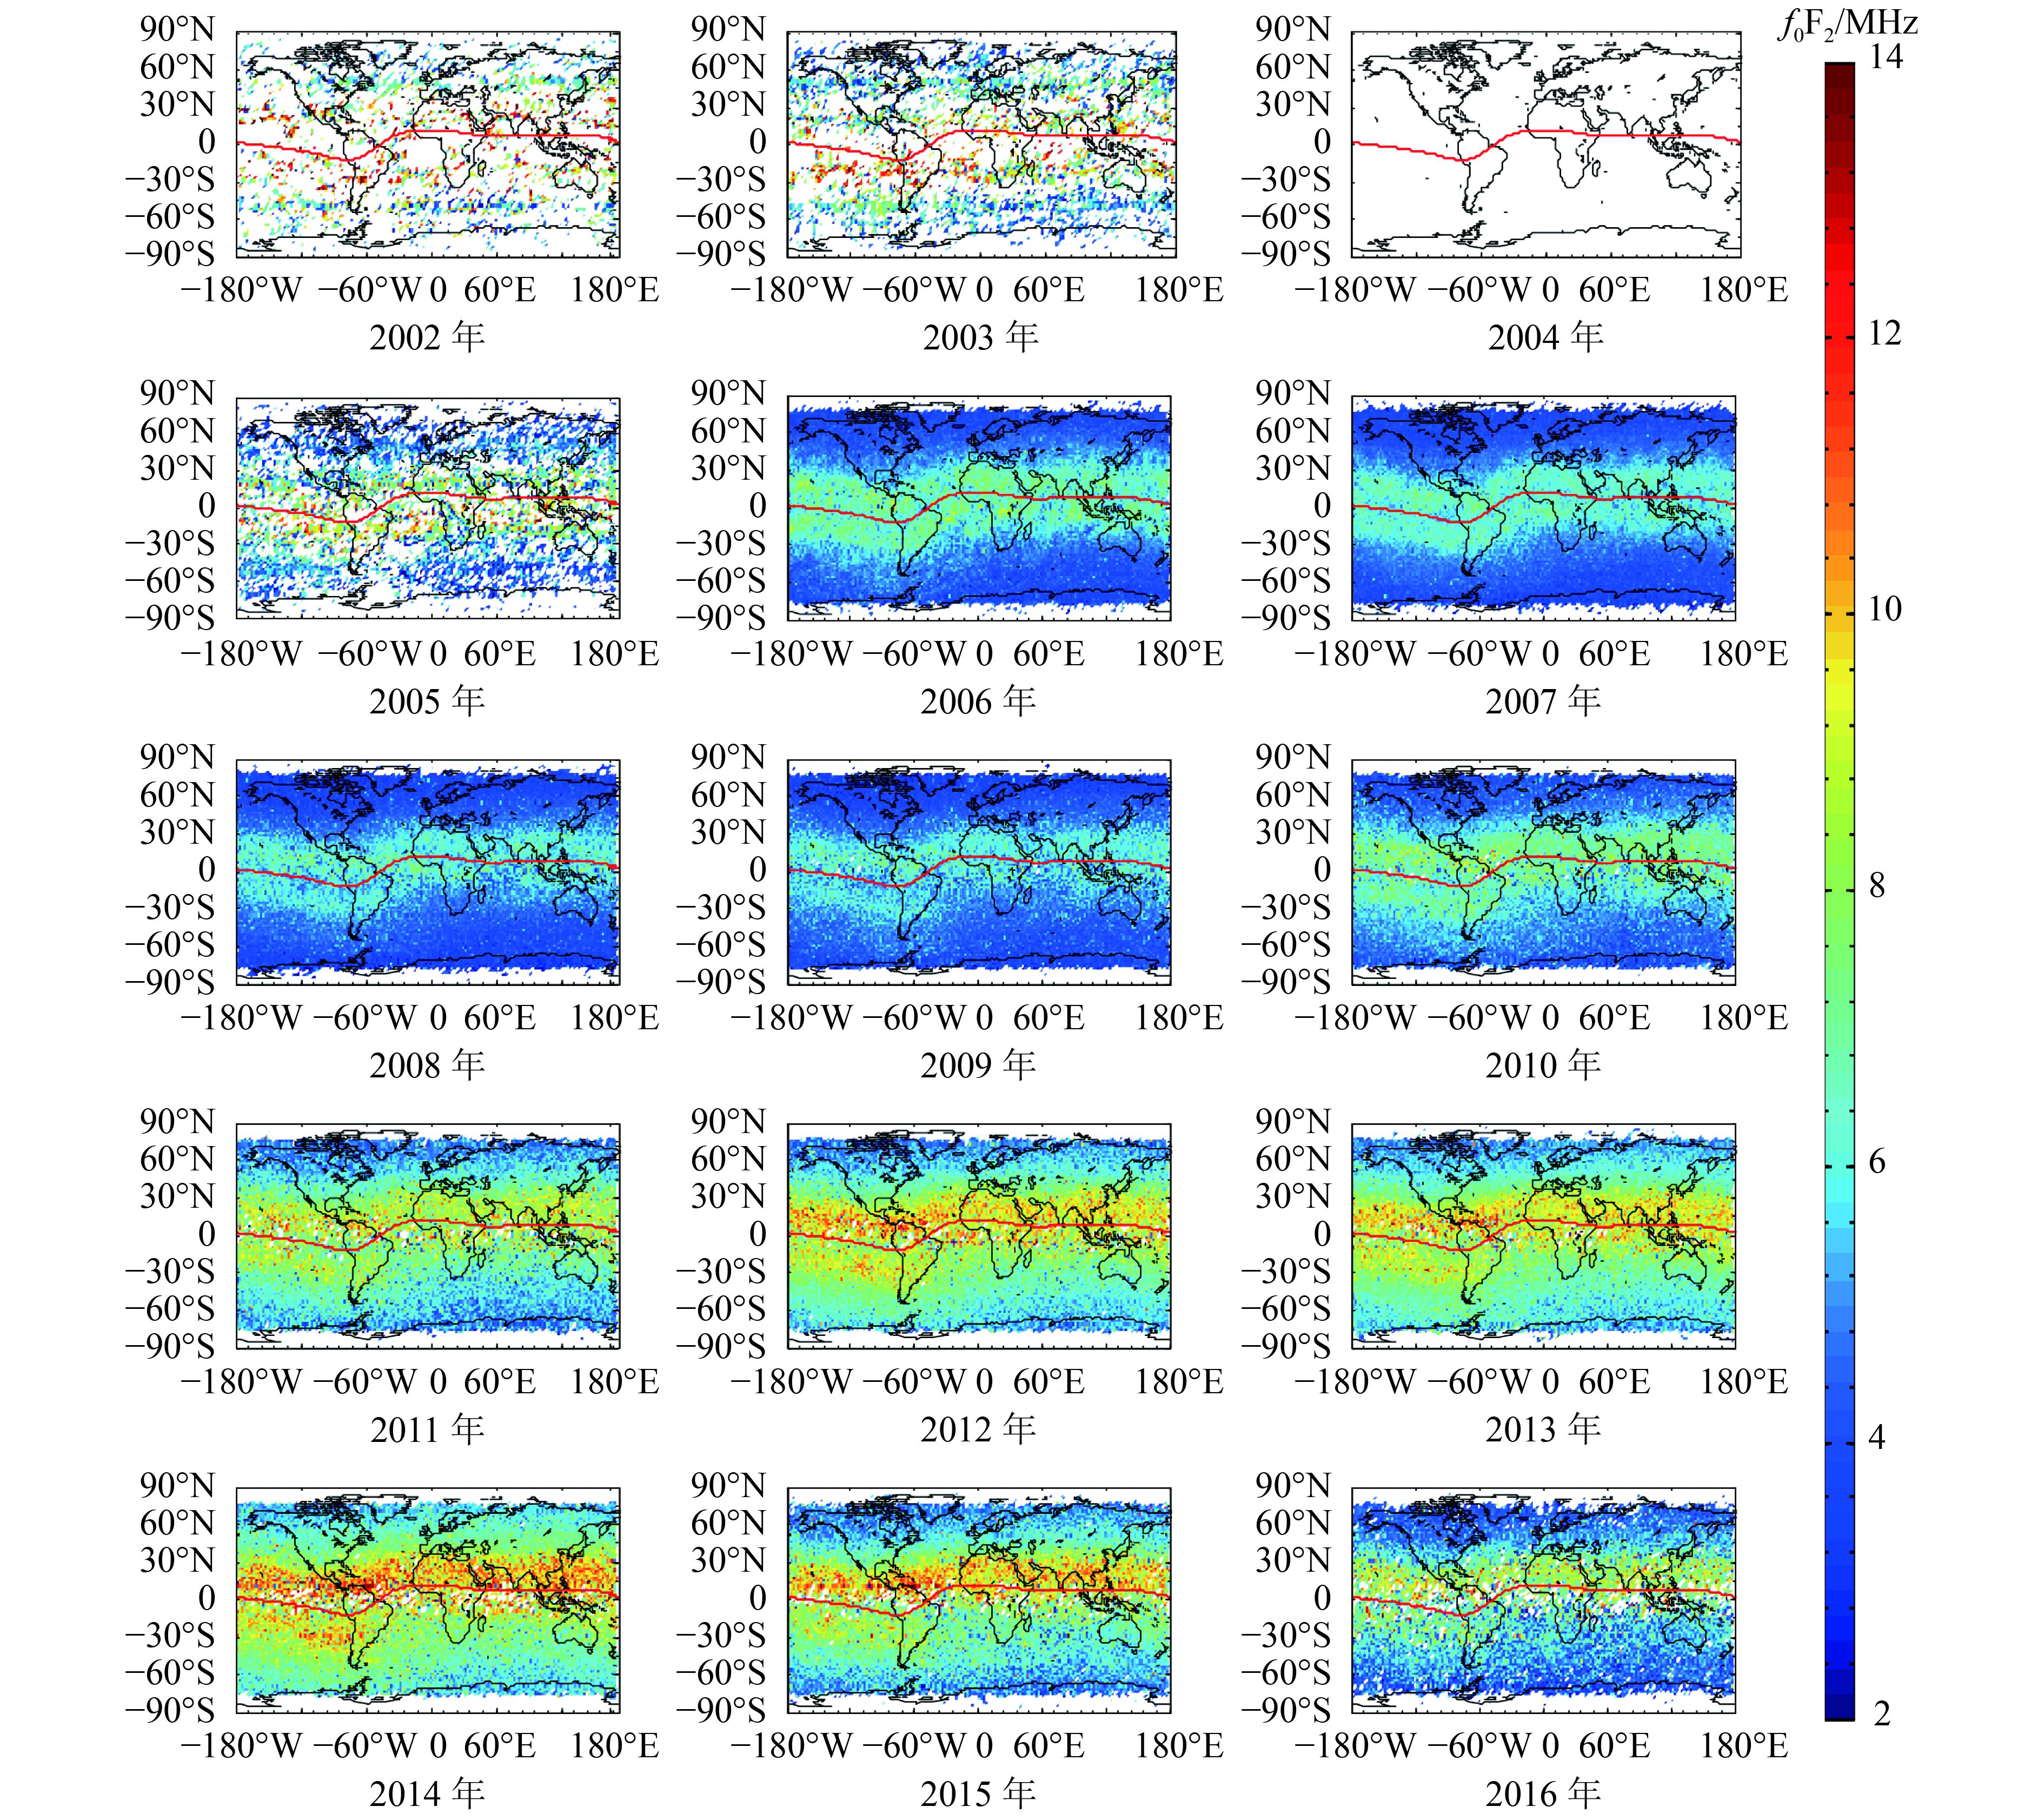

图4、图5分别为2002年—2016年全球f0F2和hmF2地方时分布,其中2004年数据缺失。从图4、图5中可以看出f0F2和hmF2的地方时分布具有明显的日变化,且周日变化相对于中午并不对称。在太阳活动低年以及地磁活动平静期(2007年—2009年),f0F2和hmF2峰值主要分布在LT 12:00—18:00期间,在LT 14:00—16:00期间达到最大值。在太阳活动高年以及地磁活动高峰期(2002年—2003年和2014年—2015年),f0F2和hmF2峰值分布可以持续到第2天的LT 02:00,且最大值分别可以达到14 MHz和450 km。此外,还可以看出在太阳活动峰年,出现较为明显的日落后赤道电离异常复苏现象,即在日落后LT 20:00处,hmF2出现异常的抬升。
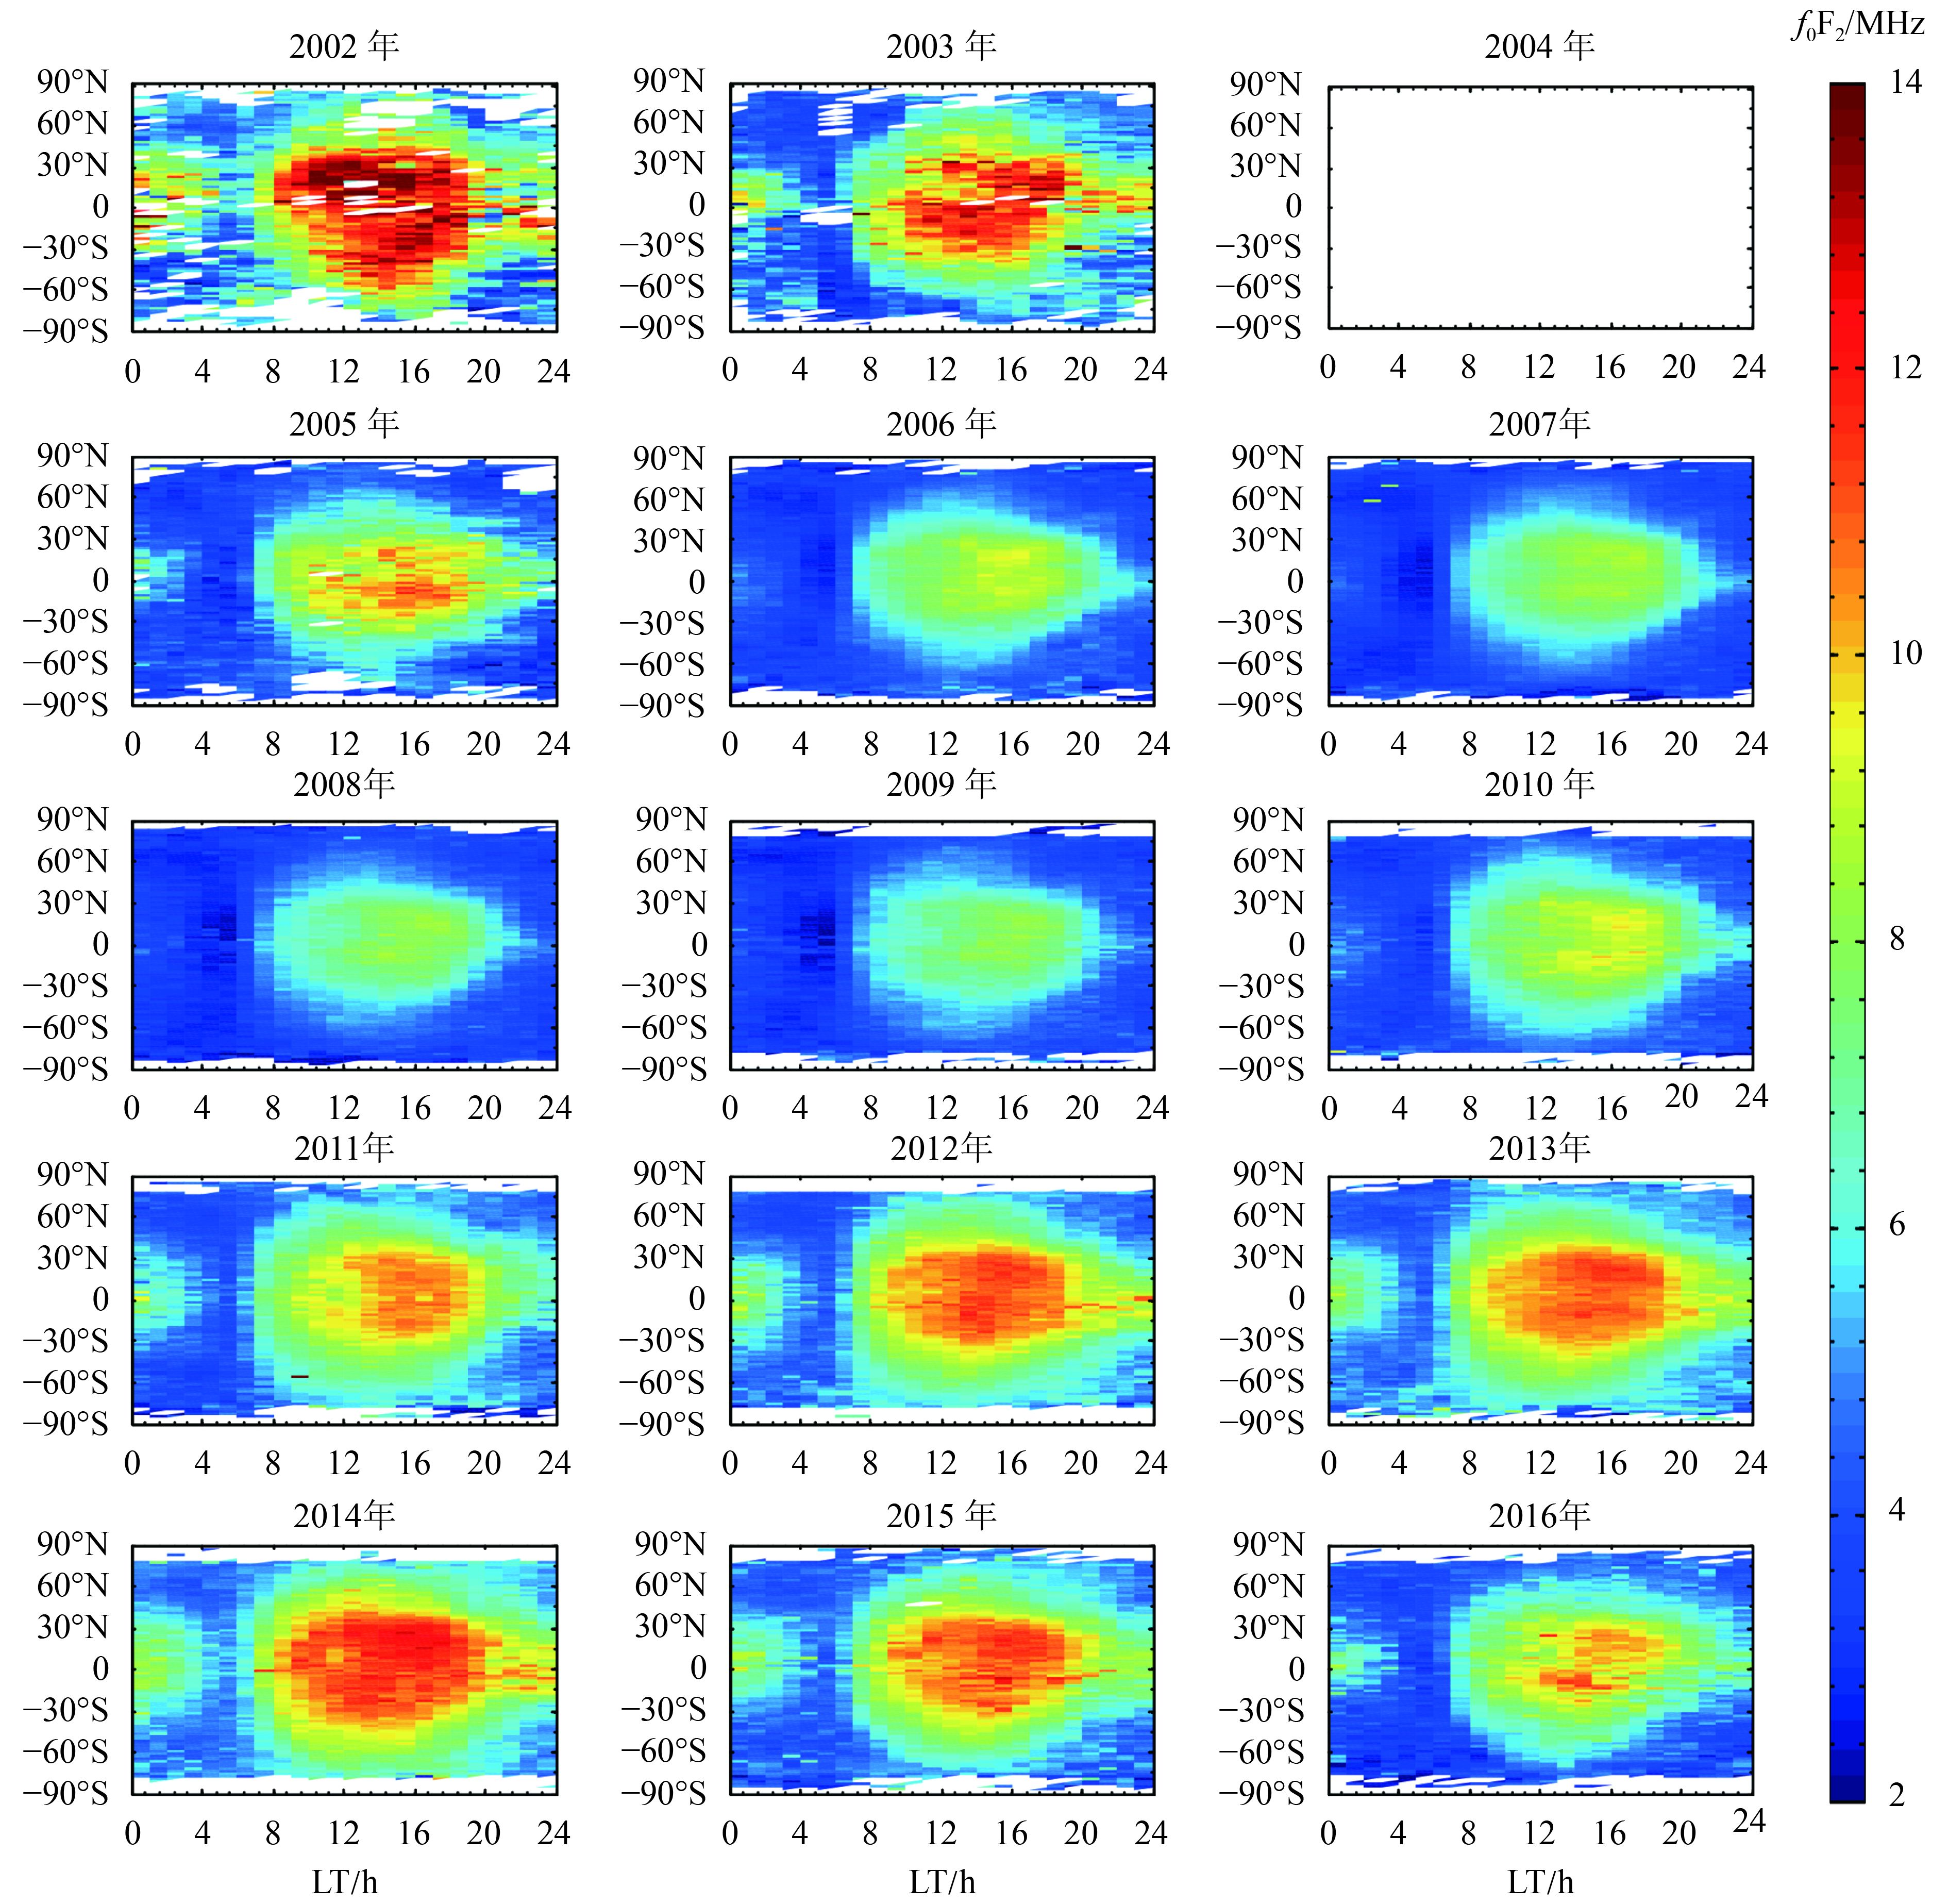
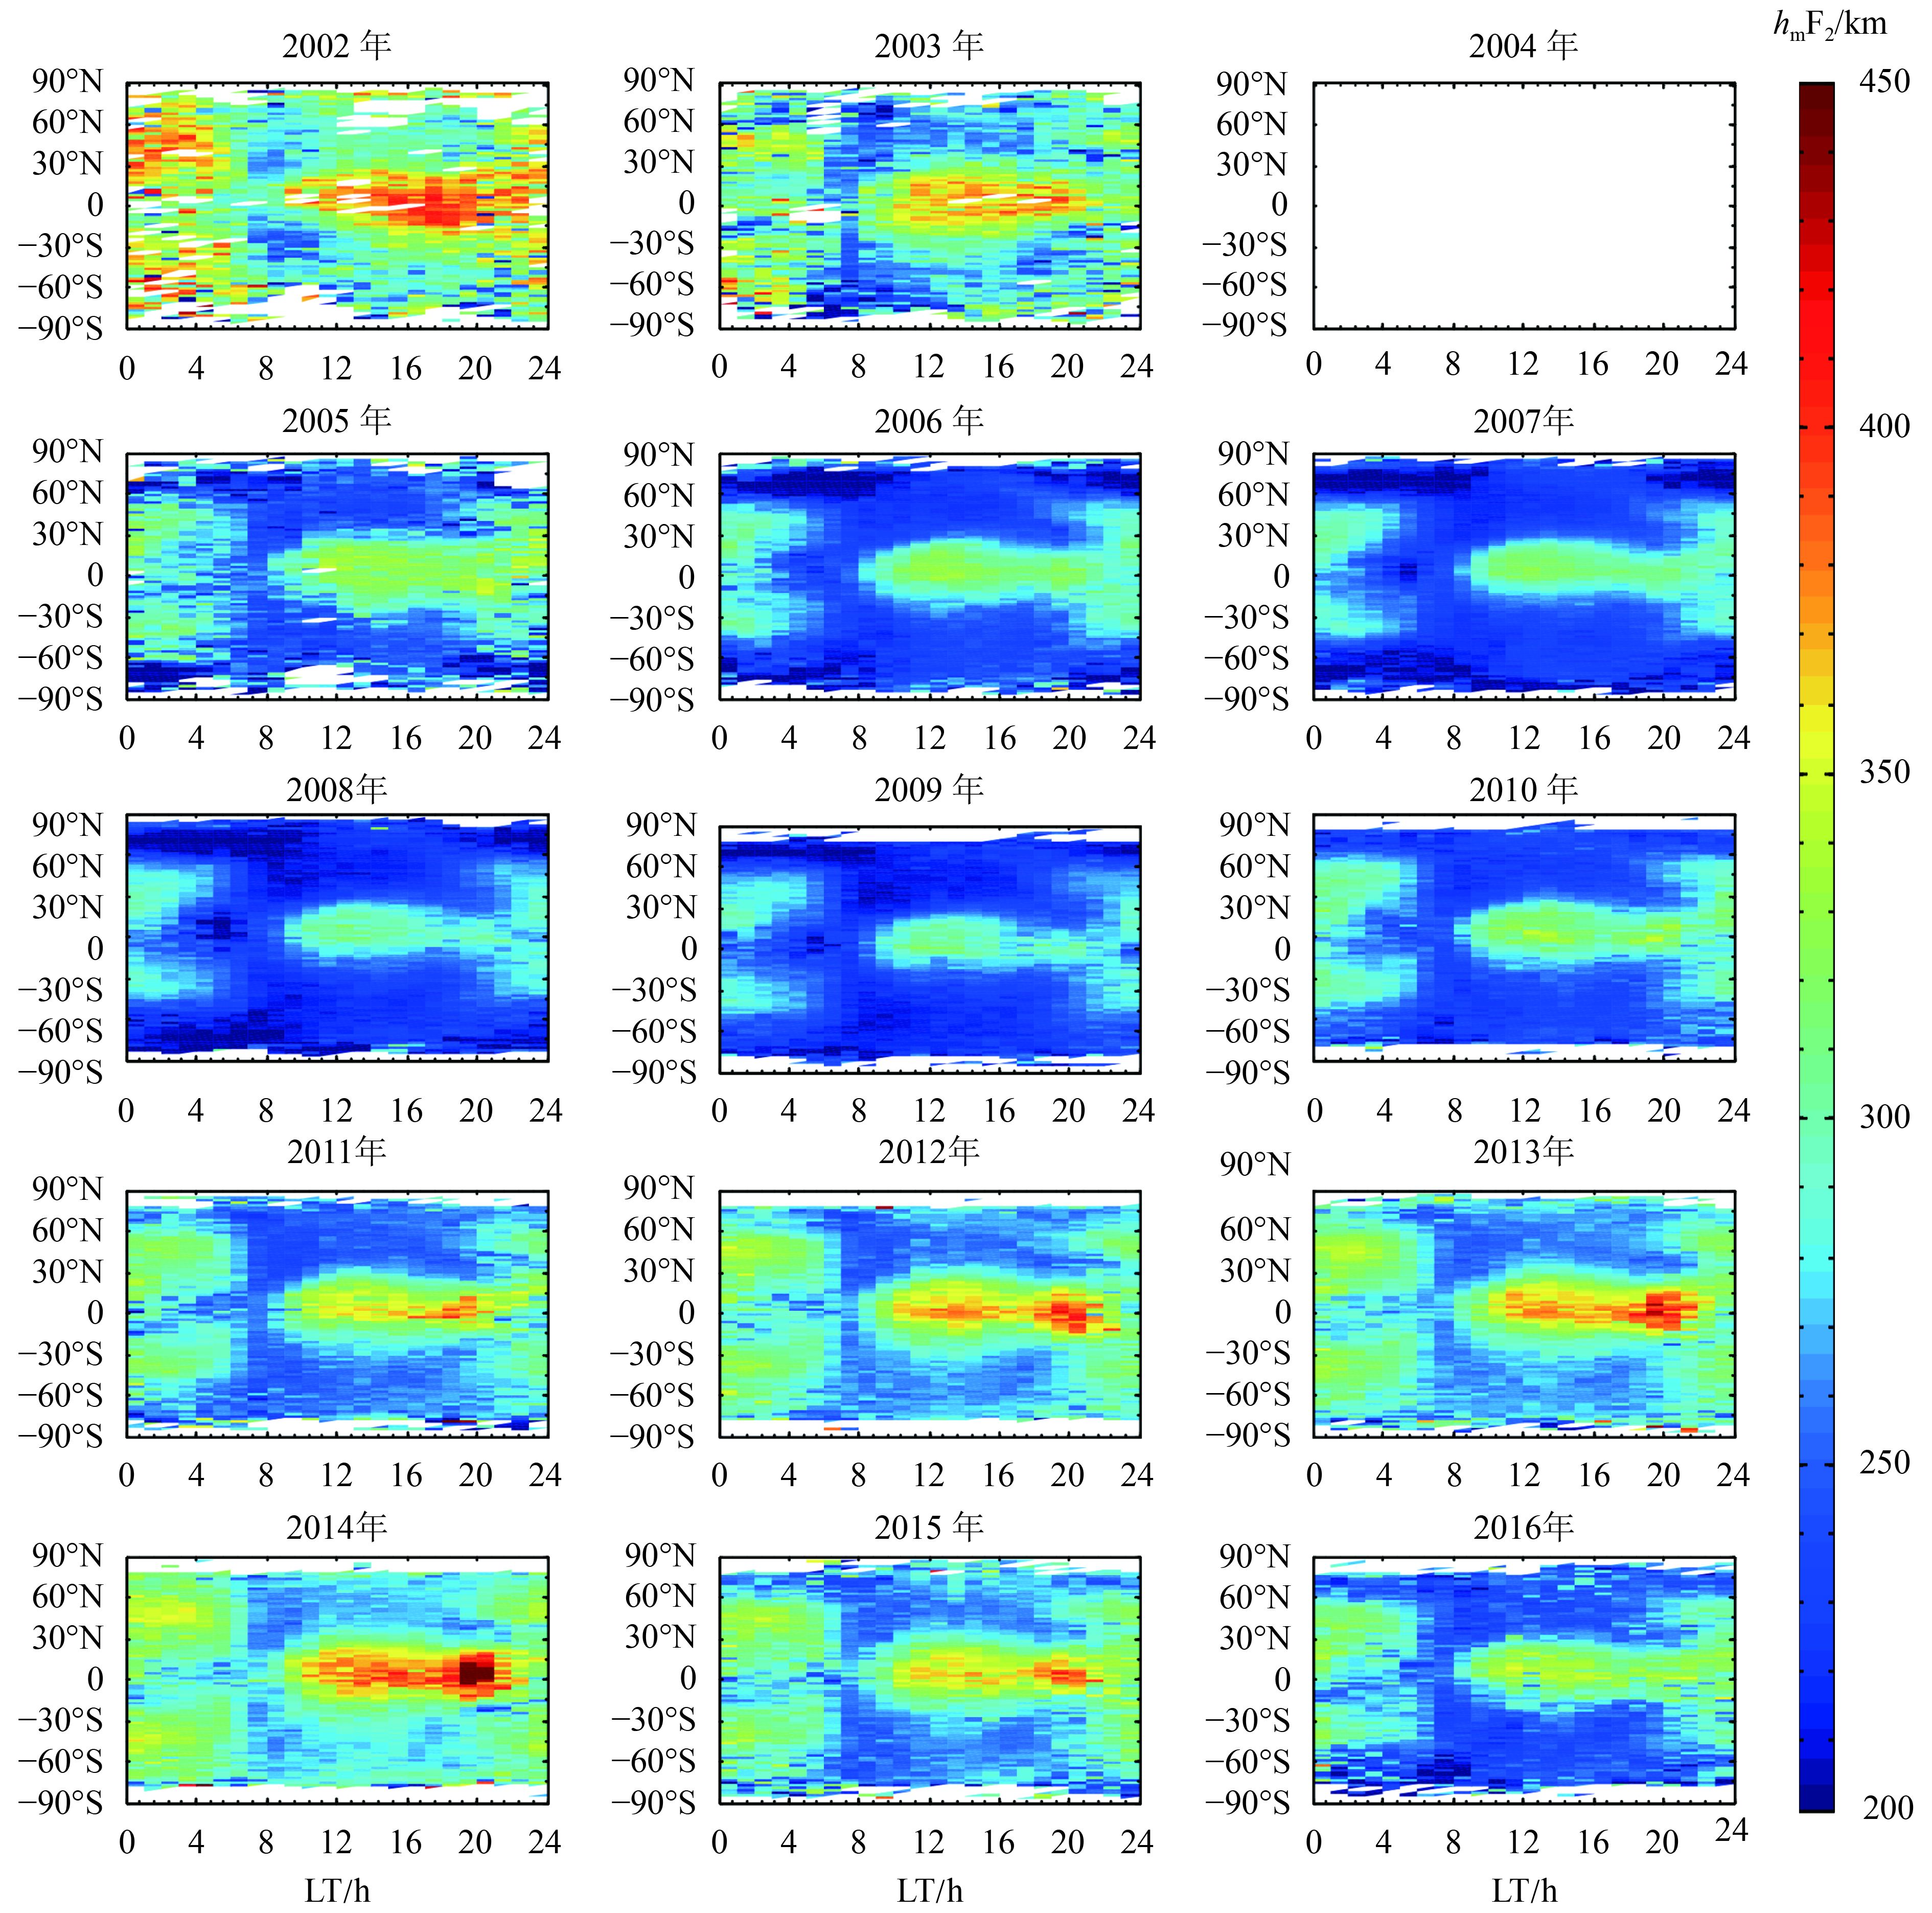
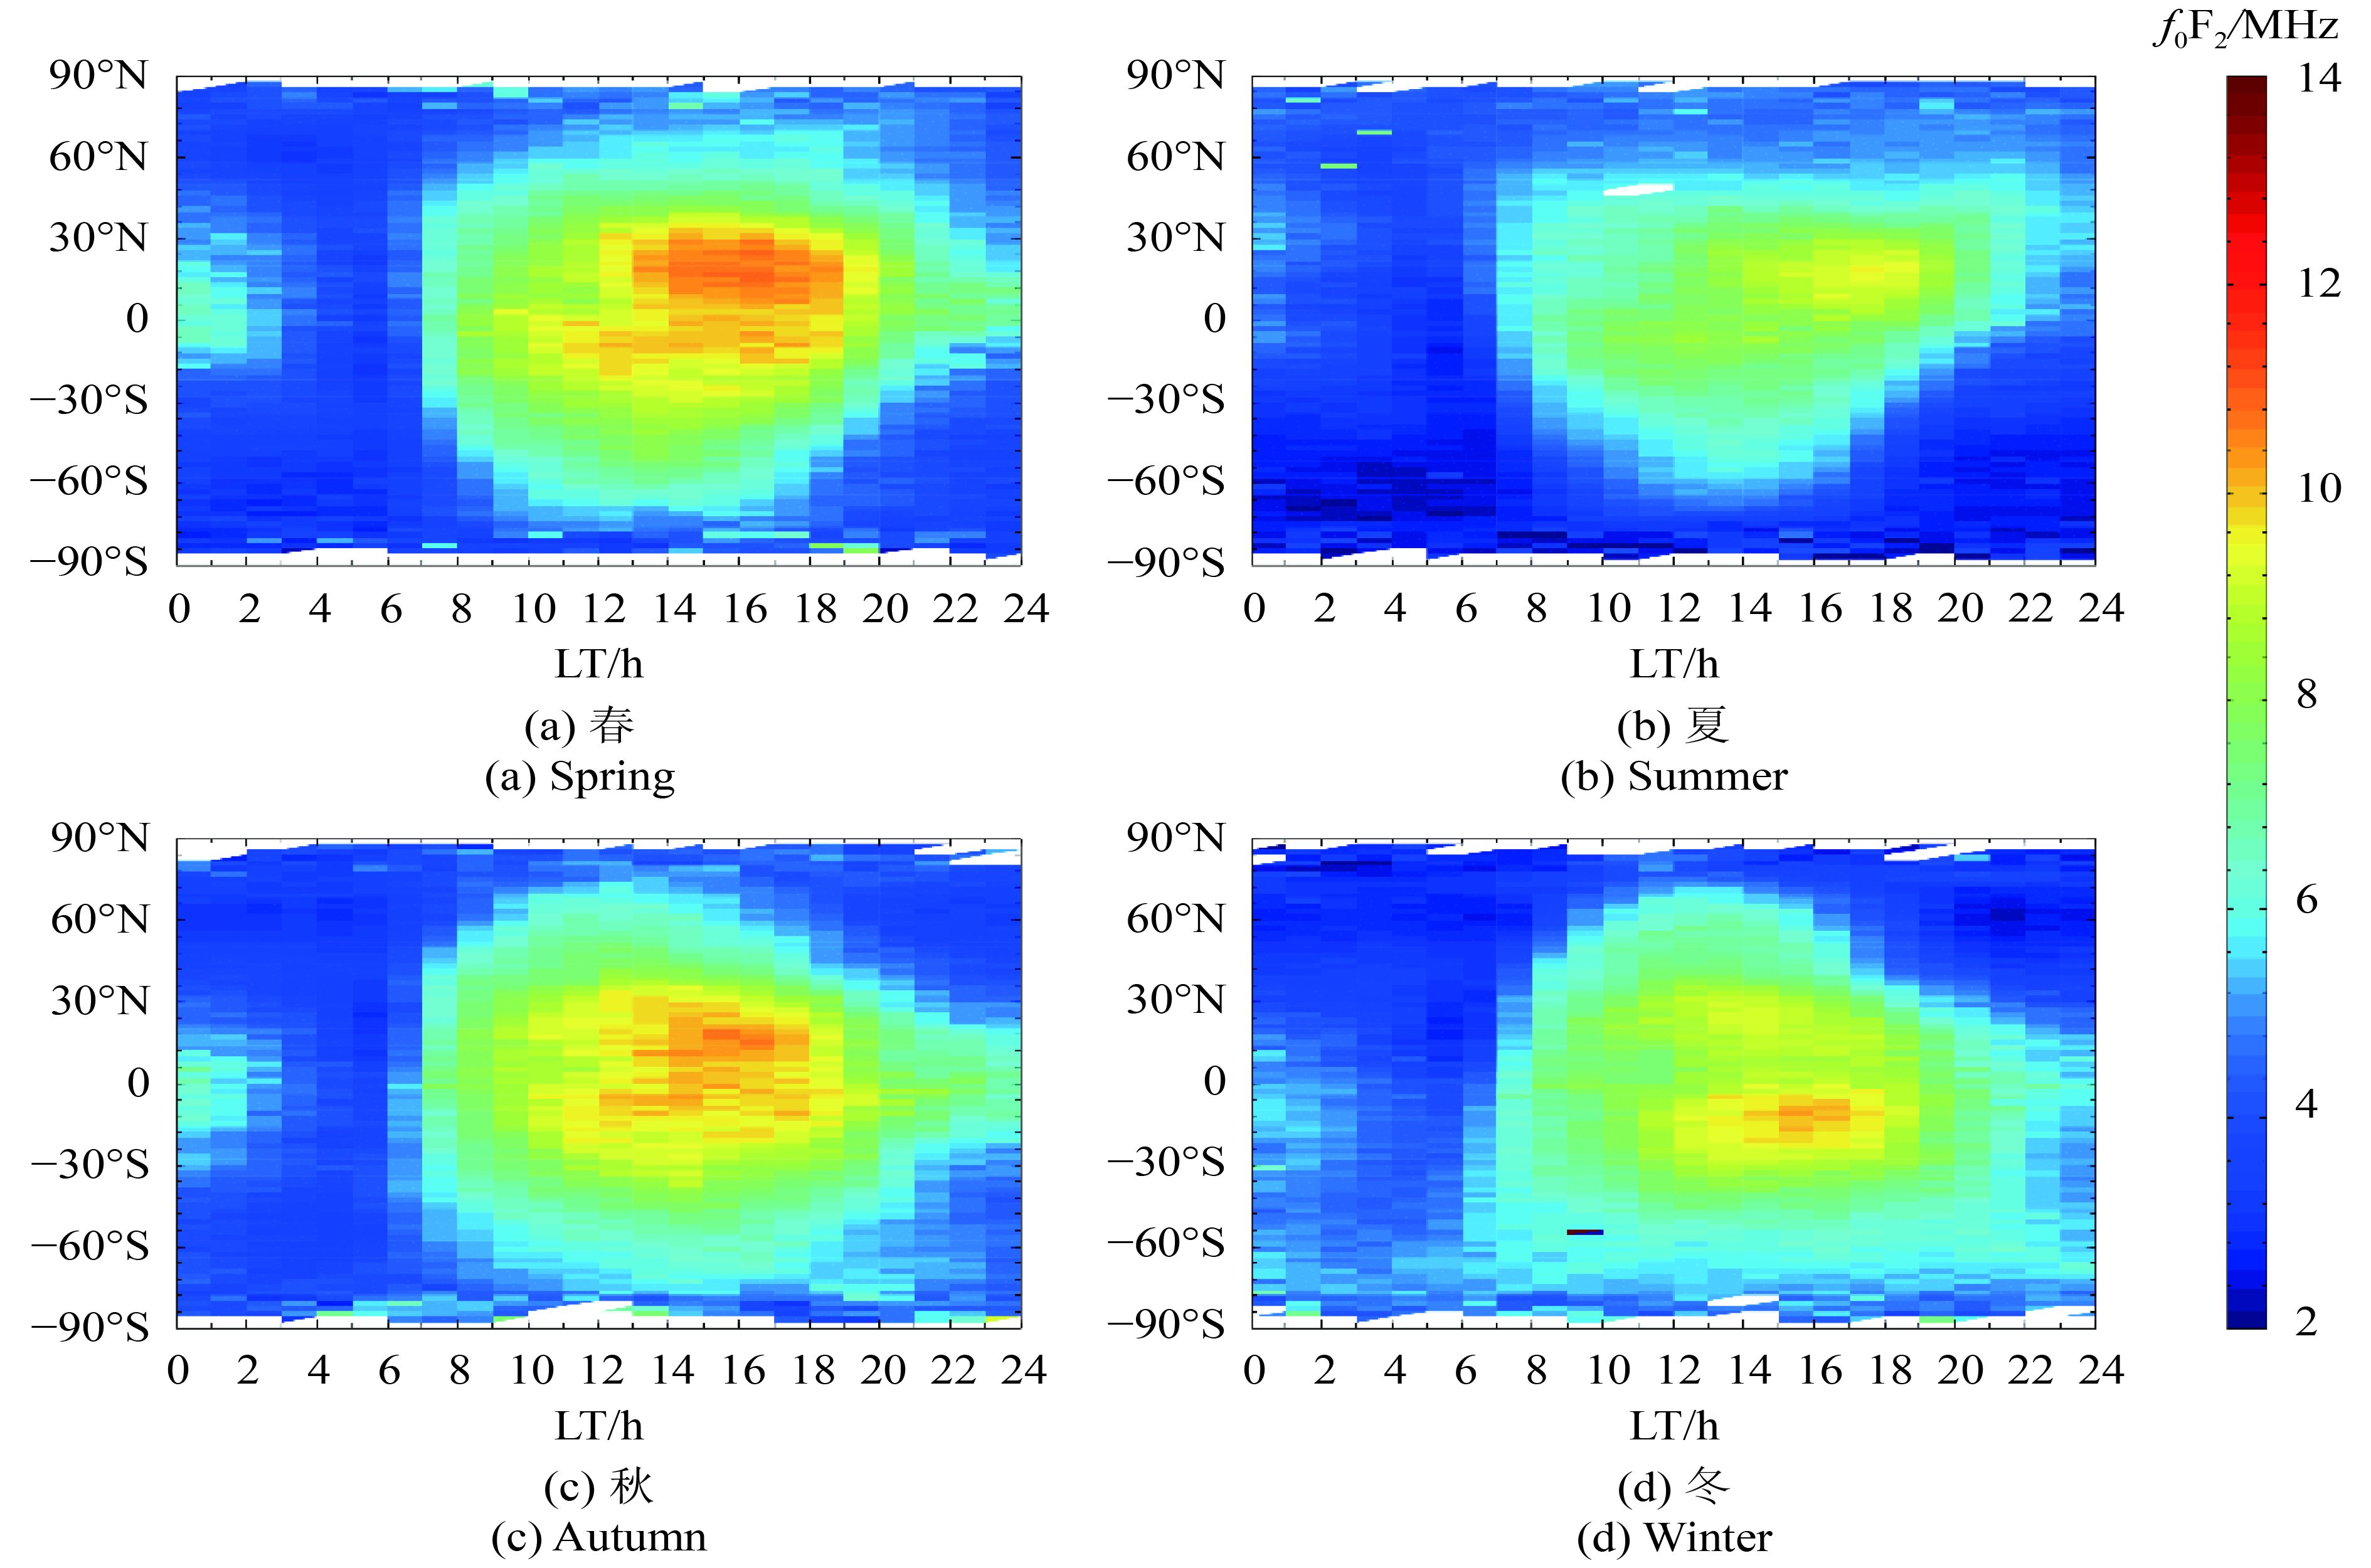
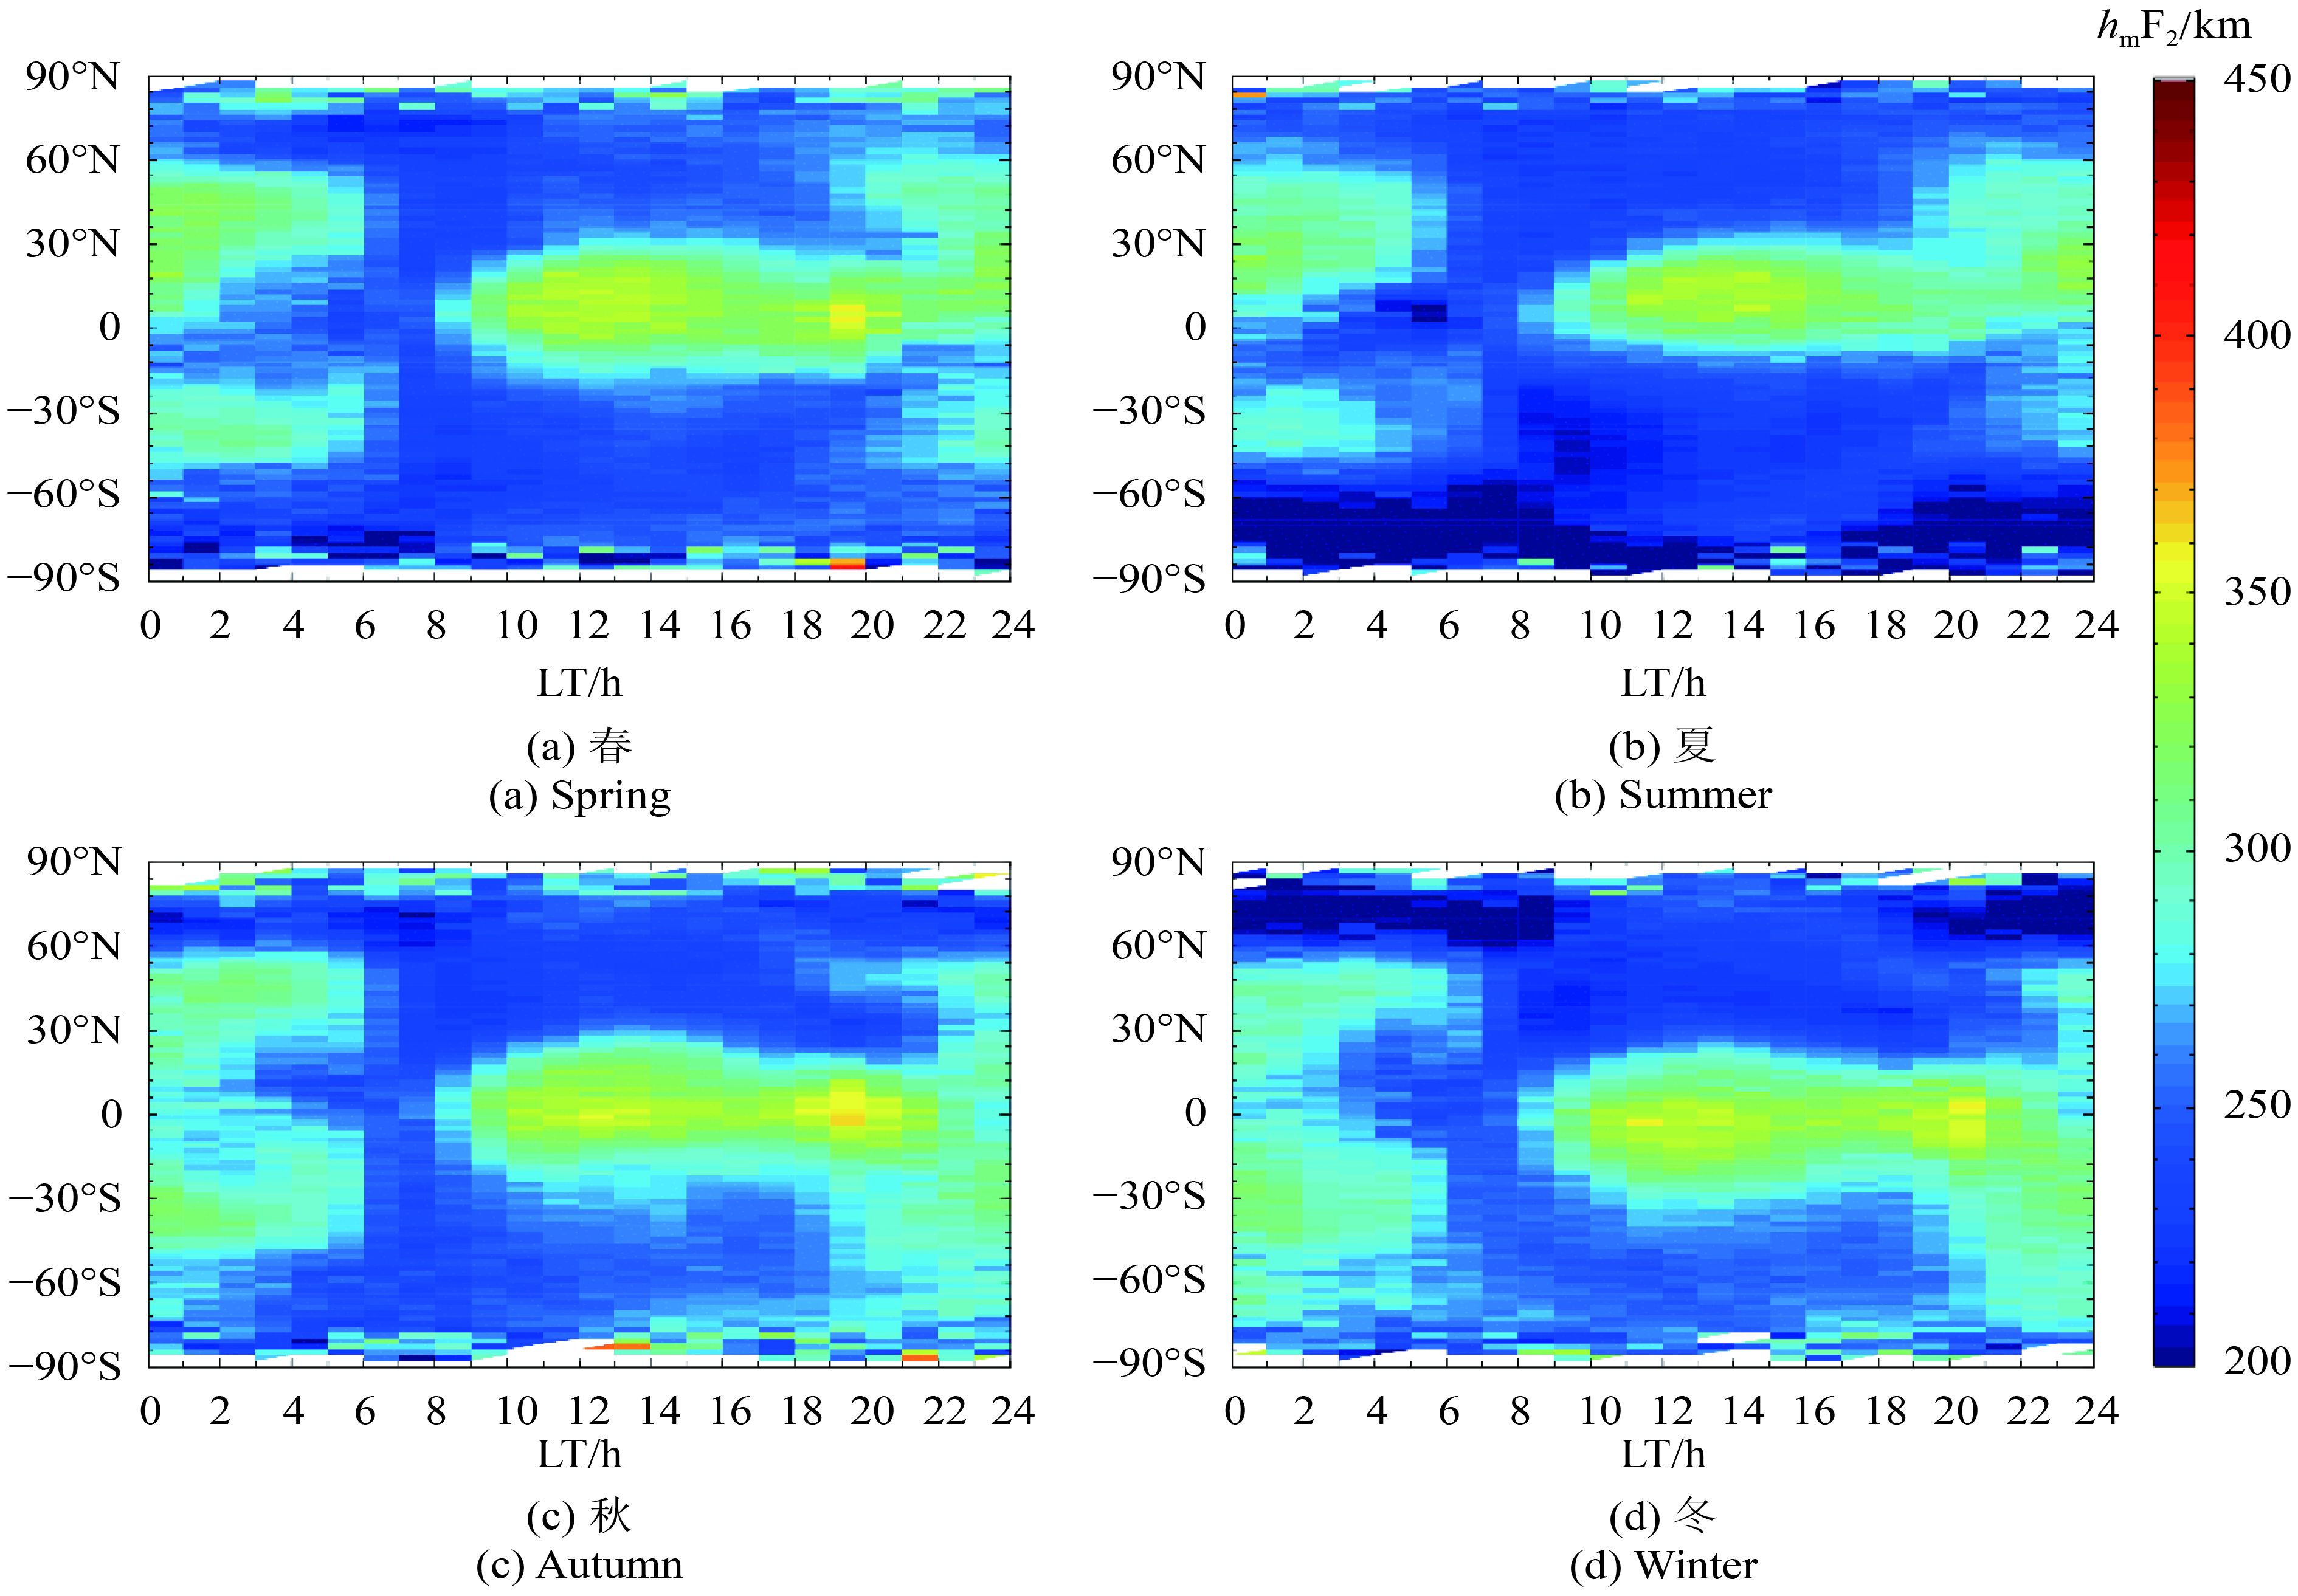
图6、图7分别为2002年—2016年全球f0F2和hmF2的季节分布。从图6、图7中可以看出f0F2存在明显的季节分布特性,f0F2最大峰值出现在春秋季的磁赤道两侧15°范围内,在夏冬季峰值较小,且在春秋两季,北半球驼峰处f0F2峰值较大于南半球驼峰处f0F2峰值。同时,f0F2分布存在冬季异常现象,即冬季f0F2峰值大于夏季峰值。hmF2季节分布相比f0F2并不明显,春秋季在磁赤道处较大,夏冬季较小。


图8、图9分别为2002年—2016年全球f0F2和hmF2季节分布的日变化。从图8、图9中可以看出在北半球f0F2白天存在较为明显的冬季异常,而在夜间f0F2值并不存在明显冬季异常现象。且在夏季f0F2日变化的峰值出现在地方时LT 12:00之后,而在冬季更接近于地方时中午。然而,hmF2分布并没有明显的季节分布特性。
3.2 测高仪f0F2探测与卫星探测结果相关性分析
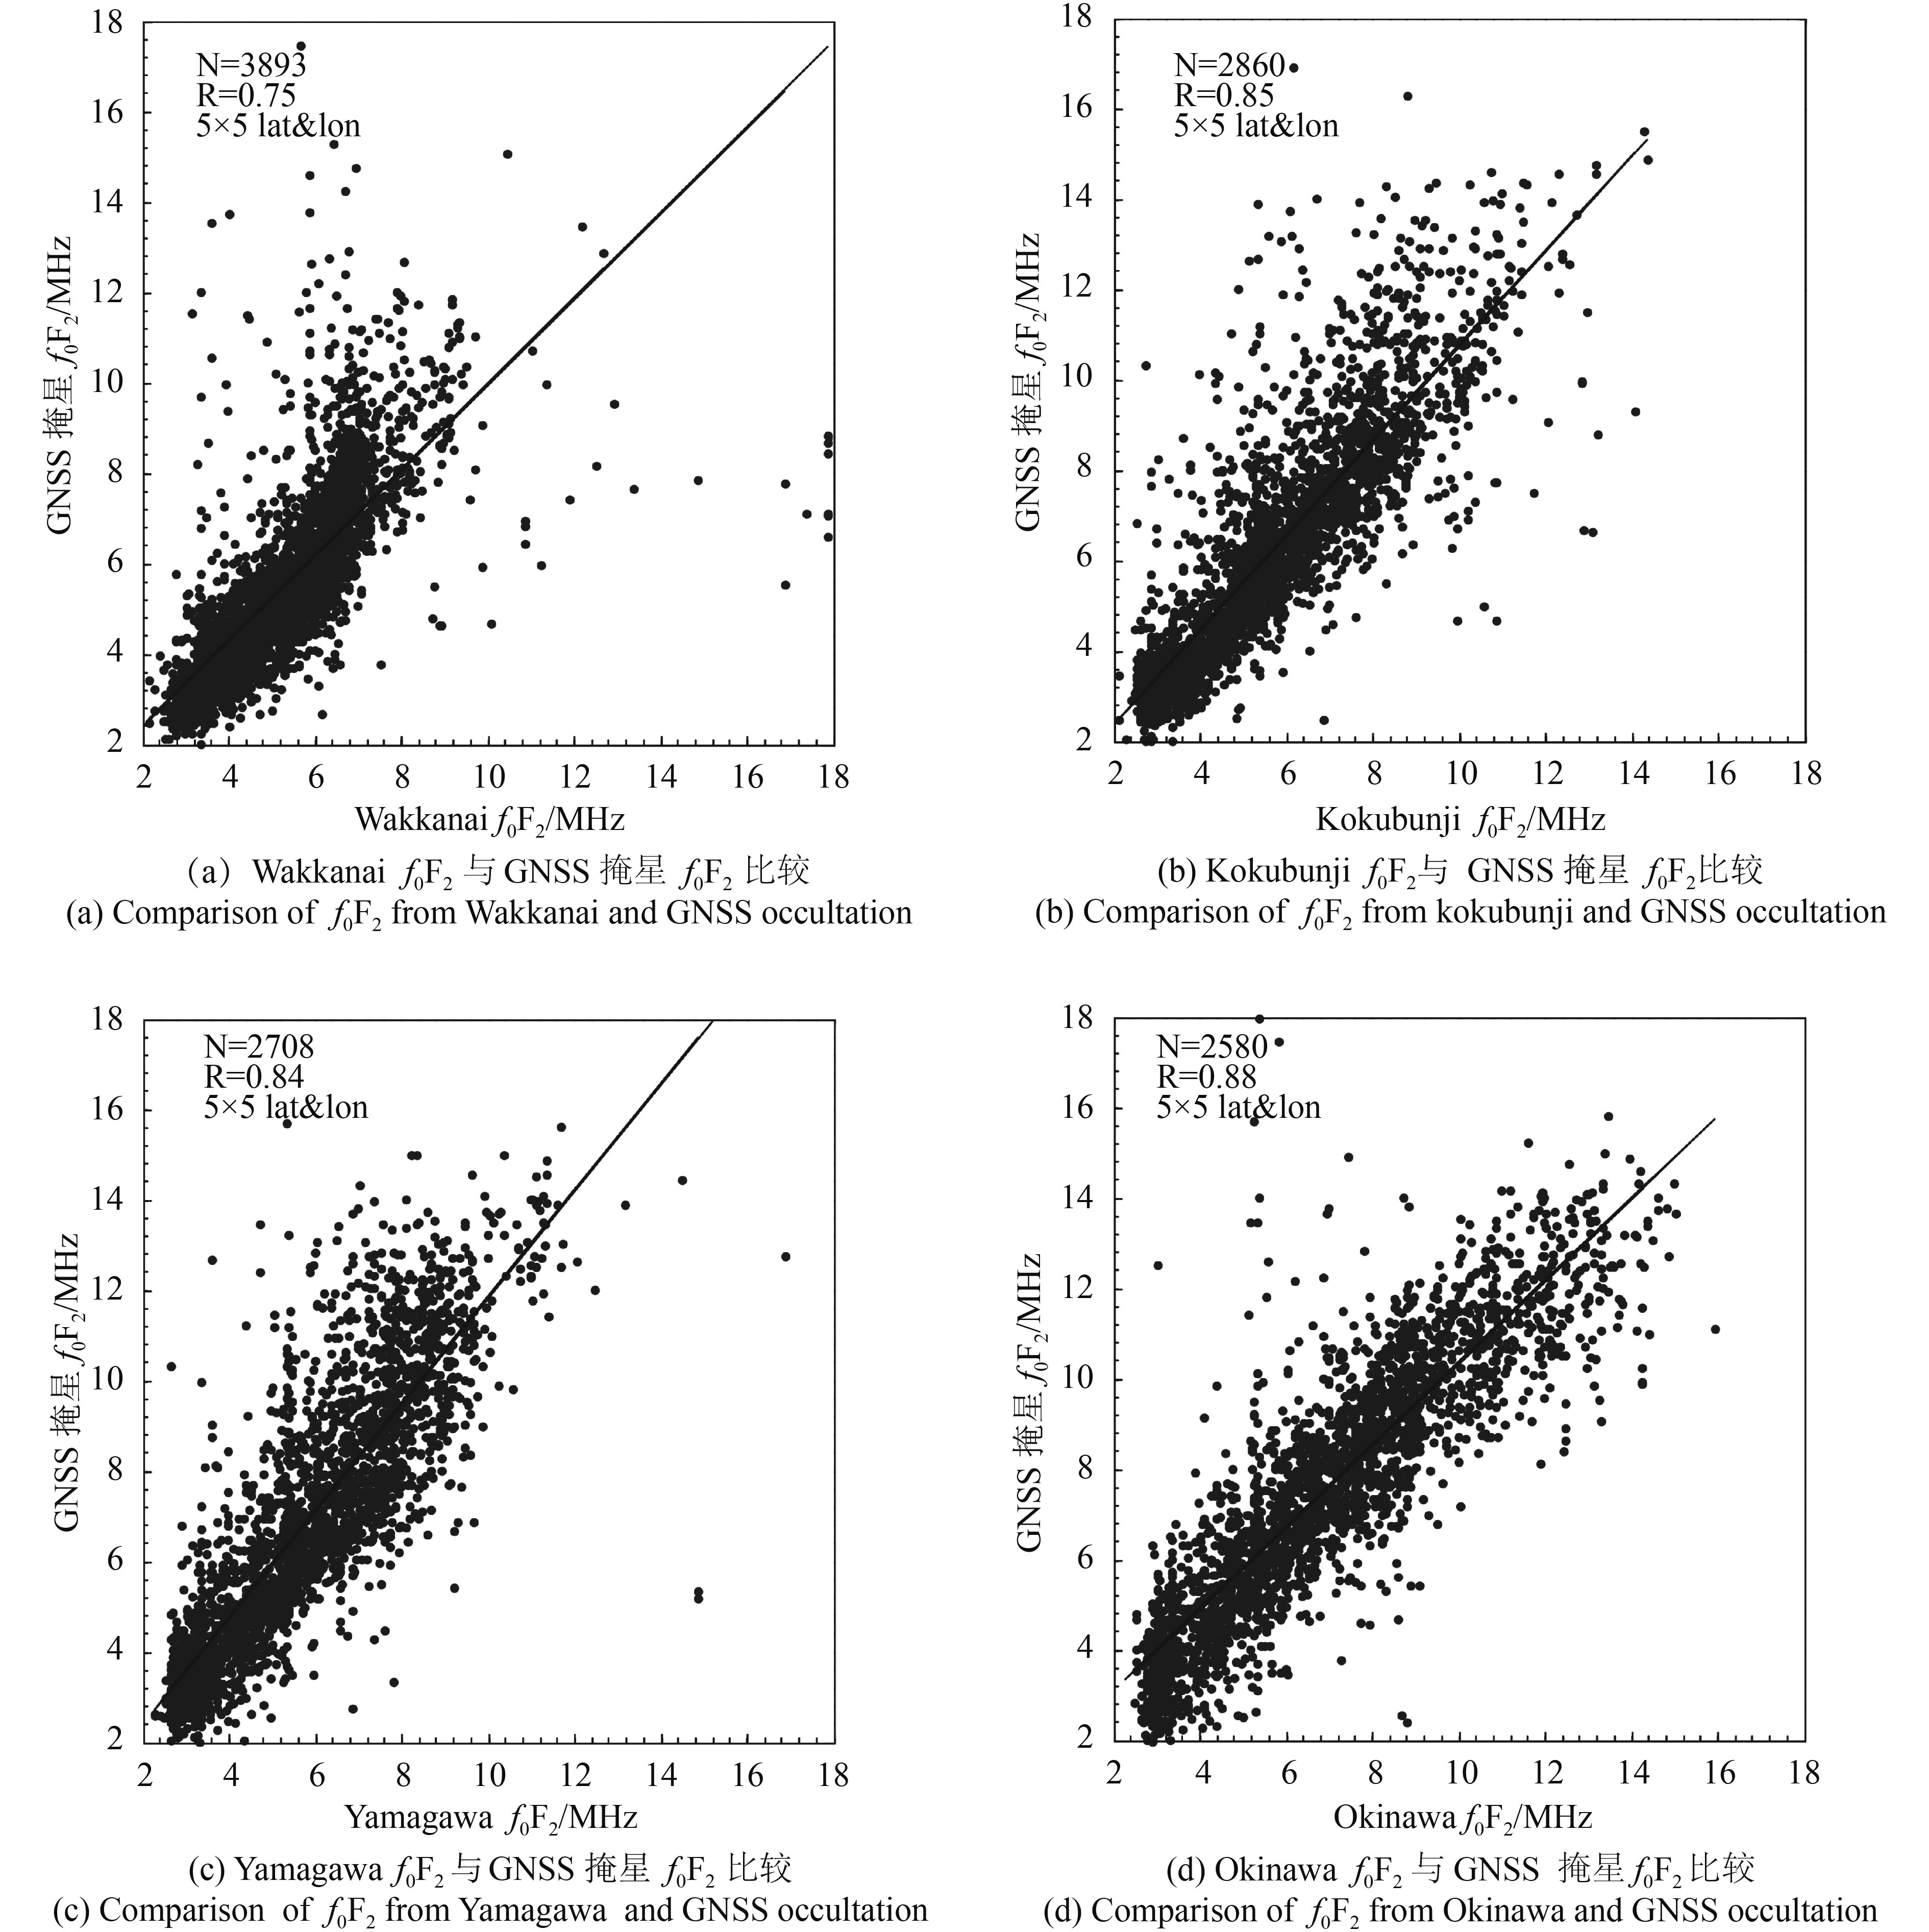
选取日本地区4个电离层测高仪站在2002年—2016年f0F2数据与对应时间段内COSMIC、GRACE和CHAMP数据进行对比,并对其相关性进行分析。表3为4个站的相关性信息。图10为日本地区Wakkanai、Kokubunji、Yamagawa、Okinawa测高仪站和GNSS掩星数据获取的f0F2参量的示意图;黑色斜线代表对应f0F2的拟合曲线,x轴和y轴分别代表测高仪和卫星获取的参量值;左上角给出了对应的f0F2点数N、相关系数R以及空间分辨率。从图10中可以看出Okinawa站的相关性最好,相关系数达到0.88,而Wakkanai站相关性较差,相关系数为0.75。Yamagawa站和Kokubunji站相关性接近。
表 3 测高仪站相关性信息
Table 3 Correlation of ionosondes
| 位置 | 点数 | 相关系数 |
| Wakkanai | 3893 | 0.75 |
| Kokubunji | 2860 | 0.85 |
| Yamagawa | 2708 | 0.84 |
| Okinawa | 2580 | 0.88 |
4 结果讨论
在电离层D层、E层和F1层,电子密度分布主要受光化学过程影响,而在F2层区域,随着高度增高,大气密度降低,控制作用从光化学过程逐渐向输运过程过渡。在中低纬地区,电离源主要为太阳紫外线辐射和X射线辐射,而在高纬和极区,沉降的高能粒子碰撞电离也是主要的电离源之一。因此,电离层参量包括f0F2和hmF2受到多种控制因素的影响,其中地磁活动和太阳活动是主要因素(Pulinets,1998;Rishbeth和Mendillo,2001;Mendillo 等,2002;Pulinets和Liu,2004)。图1—5可以看出f0F2和hmF2周年变化和太阳活动以及地磁活动有着明显的正相关性。在太阳活动高年,太阳辐射增强,提高了中性粒子光化学过程的反应速率,生成了大量的电子和离子,同时在地磁活动高峰期,大量的高能粒子沉降与中性粒子碰撞,生成电子和离子。此外离子扩散运动增强,在
从图2—10可以看出,f0F2和hmF2全球分布也具有明显的空间分布特性。在中低纬和赤道区域,白天与赤道电集流关联的电场沿着等势磁力线映射到F层区域,白天为东向电场。由于在磁赤道区域,磁力线方向是水平的,在电场和磁场的共同作用下,可以驱动F层等离子体向上运动,到达一定高度后,在重力的作用下,等离子体沿磁力线双极扩散,下降到磁赤道两侧,导致赤道地区NmF2减少,hmF2抬升以及磁赤道两侧NmF2增加,即造成了图2中的双驼峰现象(余涛 等,2008)。此外,从图3可以看出,南北半球峰高存在不对称性,这主要和半球间中性大气的子午风有关。由于磁赤道和地理赤道不重合,跨赤道子午风效应,导致在磁赤道逆风侧使F2峰高抬升,在顺风侧使F2峰高降低,造成南北半球峰高不对称性现象(Hanson和Moffett,1966;Titheridge和Buonsanto,1983)。
在夜间,由于光电离基本上不存在,因此夜间电离层电子密度随着时间逐渐衰减。然而,在F层区域,由于高能粒子沉降、星光以及共振散射的太阳辐射等都会造成中性粒子电离。此外,在子午风等的作用下,使夜间F层抬升,导致夜间f0F2和hmF2缓慢衰减的结果,造成图4、图5中f0F2和hmF2分布相对于中午不对称性。同时,在赤道区域,由于日落后会出现电场反转增强,导致F2层抬升效果增强,进而会导致在图5日落后赤道地区hmF2出现异常的升高(Yonezawa,1971)。
其次,f0F2具有比较明显的季节变化特性。在夏季高纬区域,由于太阳持续的辐射作用,会导致夏季风盛行,使低纬地区大气上升通过赤道在冬季半球下降,造成夏季电离层区域的分子含量大于春秋季,降低了氧原子/分子比例,而氧原子是F2层的主要电离成分,因此抑制了光化学反应,导致夏季NmF2的减小。同时在赤道地区,由于赤道电场存在半年周期性的变化,在春秋季电离层电场达到最大值,进而造成赤道地区的喷泉效应在春秋季更显著,造成更多的等离子体沿磁力线扩散到驼峰区域,增加了驼峰处的NmF2值,同时也提高了磁赤道处的hmF2。此外,大气环流将较轻的中性氧原子带入冬季区域,使冬季区域氧原子相对夏季区域较多,进而增大了冬季NmF2值,形成图6和图8中的冬季异常现象。(索玉成,1995;Rishbeth 等,2000;Fejer和Scherliess,2001;余涛 等,2008)。
从图10看出测高仪站f0F2数据与卫星探测结果具有很好的相关性,然而也存在着一些明显的差异,一般认为可能是由于电子密度的梯度造成的,其次也和卫星反演技术有很大关系(Lei 等,2007;Chuo 等,2011;Ely 等,2012)。
5 结 论
全球f0F2和hmF2分布对于无线电通信等有巨大影响,对全球f0F2和hmF2分布的研究有重要的意义。然而,目前对于全球f0F2和hmF2分布统计分析主要是通过利用单颗卫星的观测数据进行研究,这就造成统计结果的不准确性。因此,本文结合3颗掩星在2008年—2016年的观测数据,对全球f0F2和hmF2的时空变化进行研究,且与日本地区测高仪站f0F2资料进行了相关性分析。主要的结论如下:
(1)通过对一个完整太阳活动周年内f0F2和hmF2全球分布进行研究,发现f0F2和hmF2周年变化与太阳活动和地磁活动具有明显的正相关性,其次,f0F2最大值分布在磁赤道两侧大约15°的纬度区域,而hmF2最大值分布在赤道区域,且南北半球的峰高并不是对称的,表明了喷泉效应对f0F2和hmF2全球分布的影响以及跨赤道子午风效应对南北半球hmF2峰高的影响。
(2)f0F2和hmF2具有明显的地方时效应,峰值出现在LT 14:00—16:00期间,日变化相对于中午并不对称。表明了夜间F层区域存在着其他电离源包括高能粒子沉降以及星光等,导致夜间f0F2和hmF2缓慢衰减的结果。其次,在太阳活动峰年,出现较为明显的日落后赤道电离异常复苏现象,即在日落后LT 20:00处,hmF2出现异常的抬升,表明了日落后电场反转增强对hmF2峰高的影响。
(3)f0F2具有比较明显的季节变化特性,f0F2最大峰值出现在春秋季中低纬地区,在夏冬季较小,且出现比较明显的冬季异常现象,而hmF2季节分布相比f0F2并不明显。
(4)通过与日本地区测高仪站f0F2数据进行对比,发现两种探测手段获取的f0F2具有较好的相关性,其中Okinawa站的相关性最好,相关系数达到0.88,而Wakkanai站相关性较差,相关系数为0.75。Yamagawa站和Kokubunji站相关性接近,分别为0.84和0.85。造成差异性的原因一般主要是认为可能是由于电子密度的梯度造成的,其次也和卫星反演技术有很大关系。
本文主要是通过利用GNSS掩星观测数据对f0F2和hmF2全球分布进行了研究。在后续的工作中将进一步研究影响f0F2和hmF2全球分布的因素及其物理机制,并建立理论模型模拟f0F2和hmF2的全球分布特征,并和观测结果进行对比分析。
志 谢 本文所用掩星数据来自(http://cdaac-www.cosmic.ucar.edu/[2017-06-29]);日本地区测高仪站f0F2数据来自(http://wdc.nict.go.jp/IONO/index_E.html[2017-06-29]);F10.7以及Ap数据来自(ftp://ftp.ngdc.noaa.gov[2017-06-29]);太阳黑子数数据来自(http://sidc.be/silso/dayssnplot[2017-06-29])。在此表示衷心的感谢!
参考文献(References)
-
Amarante G M, Santamaría M C, De Gonázlez M M, Radicella S M and Ezquer R. 2004. Day-to-day changes in experimental electron density profiles and their implications to IRI model. Advances in Space Research, 34 (9): 1878–1886. [DOI: 10.1016/j.asr.2004.08.008]
-
Azpilicueta F, Altadill D, Brunini C, Torta J M and Blanch E. 2015. A comparison of the LPIM-COSMIC F2 peak parameters determinations against the IRI(CCIR). Advances in Space Research, 55 (8): 2012–2019. [DOI: 10.1016/j.asr.2014.08.008]
-
Balan N, Otsuka Y, Fukao S, Abdu M A and Bailey G J. 2000. Annual variations of the ionosphere: a review based on MU radar observations. Advances in Space Research, 25 (1): 153–162. [DOI: 10.1016/S0273-1177(99)00913-8]
-
Chuo Y J, Lee C C, Chen W S and Reinisch B W. 2011. Comparison between bottomside ionospheric profile parameters retrieved from FORMOSAT3 measurements and ground-based observations collected at Jicamarca. Journal of Atmospheric and Solar-Terrestrial Physics, 73 (13): 1665–1673. [DOI: 10.1016/j.jastp.2011.02.021]
-
Ely C V, Batista I S and Abdu M A. 2012. Radio occultation electron density profiles from the FORMOSAT-3/COSMIC satellites over the Brazilian region: a comparison with Digisonde data. Advances in Space Research, 49 (11): 1553–1562. [DOI: 10.1016/j.asr.2011.12.029]
-
Ezquer R G, Mosert M, Corbella R, Erazù M, Radicella S M, Cabrera M and De La Zerda L. 2004. Day-to-day variability of ionospheric characteristics in the American sector. Advances in Space Research, 34 (9): 1887–1893. [DOI: 10.1016/j.asr.2004.03.016]
-
Fejer B G and Scherliess L. 2001. On the variability of equatorial F-region vertical plasma drifts. Journal of Atmospheric and Solar-Terrestrial Physics, 63 (9): 893–897. [DOI: 10.1016/S1364-6826(00)00198-X]
-
Forbes J M, Palo S E and Zhang X L. 2000. Variability of the ionosphere. Journal of Atmospheric and Solar-Terrestrial Physics, 62 (8): 685–693. [DOI: 10.1016/S1364-6826(00)00029-8]
-
Hanson W B and Moffett R J. 1966. Lonization transport effects in the equatorial F region . Journal of Geophysical Research, 71 (23): 5559–5572. [DOI: 10.1029/JZ071i023p05559]
-
Kouris S S and Fotiadis D N. 2002. Ionospheric variability: a comparative statistical study. Advances in Space Research, 29 (6): 977–985. [DOI: 10.1016/S0273-1177(02)00045-5]
-
Krankowski A, Zakharenkova I, Krypiak-Gregorczyk A, Shagimuratov I I and Wielgosz P. 2011. Ionospheric electron density observed by FORMOSAT-3/COSMIC over the European region and validated by ionosonde data. Journal of Geodesy, 85 (12): 949–964. [DOI: 10.1007/s00190-011-0481-z]
-
Lei J H, Syndergaard S, Burns A G, Solomon S C, Wang W B, Zeng Z, Roble R G, Wu Q, Kuo Y H, Holt J M, Zhang S R, Hysell D L, Rodrigues F S and Lin C H. 2007. Comparison of COSMIC ionospheric measurements with ground-based observations and model predictions: preliminary results. Journal of Geophysical Research, 112 (A7): A07308 [DOI: 10.1029/2006JA012240]
-
Liu Z D, Fang H X, Weng L B, Ma Q and Zhang J B. 2016. Global model of ionospheric hmF2 based on CHAMPE, GRACE and COSMIC radio occultation . Chinese Journal of Geophysics, 59 (10): 3555–3565. [DOI: 10.6038/cjg20161003] ( 刘桢迪, 方涵先, 翁利斌, 马强, 张建彬. 2016. 基于CHAMP、GRACE和COSMIC掩星数据的全球电离层hmF2建模研究 . 地球物理学报, 59 (10): 3555–3565. [DOI: 10.6038/cjg20161003] )
-
Maruyama T, Ma G Y, Tsugawa T, Supnithi P and Komolmis T. 2017. Ionospheric peak height at the magnetic equator: comparison between ionosonde measurements and IRI. Advances in Space Research, 60 (2): 375–380. [DOI: 10.1016/j.asr.2016.10.013]
-
McNamara L F and Thompson D C. 2015. Validation of COSMIC values of f0F2 and M(3000)F2 using ground-based ionosondes . Advances in Space Research, 55 (1): 163–169. [DOI: 10.1016/j.asr.2014.07.015]
-
Mendillo M, Rishbeth H, Roble R G and Wroten J. 2002. Modelling F2-layer seasonal trends and day-to-day variability driven by coupling with the lower atmosphere . Journal of Atmospheric and Solar-Terrestrial Physics, 64 (18): 1911–1931. [DOI: 10.1016/S1364-6826(02)00193-1]
-
Pulinets S A. 1998. Seismic activity as a source of the ionospheric variability. Advance in Space Research, 22 (6): 903–906. [DOI: 10.1016/S0273-1177(98)00121-5]
-
Pulinets S A and Liu J Y. 2004. Ionospheric variability unrelated to solar and geomagnetic activity. Advance in Space Research, 34 (9): 1926–1933. [DOI: 10.1016/j.asr.2004.06.014]
-
Rishbeth H, Sedgemore-Schulthess K J F and Ulich T. 2000. Semiannual and annual variations in the height of the ionospheric F2-peak. Annales Geophysicae, 18 (3): 285–299. [DOI: 10.1007/s00585-000-0285-6]
-
Rishbeth H and Mendillo M. 2001. Patterns of F2-layer variability. Journal of Atmospheric and Solar-Terrestrial Physics, 63 (15): 1661–1680. [DOI: 10.1016/S1364-6826(01)00036-0]
-
Shen X H, Wu Y, Shan X J and Zhang J F. 2008. The frame of China satellite seismic application system and the progress of China seismic electromagnetic program. Recent Developments in World Seismology (11): 153 [DOI: 10.3969/j.issn.0253-4975.2008.11.154] ( 申旭辉, 吴云, 单新建, 张景发. 2008. 中国卫星地震应用系统框架与地震电磁卫星计划进展. 国际地震动态 (11): 153 [DOI: 10.3969/j.issn.0253-4975.2008.11.154] )
-
Sun L F, Zhao B Q, Yue X A and Mao T. 2014. Comparison between ionospheric character parameters retrieved from FORMOSAT3 measurement and ionosonde observation over China. Chinese Journal of Geophysics, 57 (11): 3625–3632. [DOI: 10.6038/cjg20141116] ( 孙凌峰, 赵必强, 乐新安, 毛田. 2014. 中国区域电离层垂测仪探测参量与COSMIC掩星反演结果比较研究. 地球物理学报, 57 (11): 3625–3632. [DOI: 10.6038/cjg20141116] )
-
Suo Y C. 1995. Seasonal Variation of f0F2. Chinese Journal of Radio Science, 10 (4): 83–89. [DOI: 10.13443/j.cjors.1995.04.015] ( 索玉成. 1995. f0F2的季节变化特征 . 电波科学学报, 10 (4): 83–89. [DOI: 10.13443/j.cjors.1995.04.015] )
-
Titheridge J E and Buonsanto M J. 1983. Annual variations in the electron content and height of the F layer in the northern and southern hemispheres, related to neutral composition . Journal of Atmospheric and Terrestrial Physics, 45 (10): 683–696. [DOI: 10.1016/S0021-9169(83)80027-0]
-
Xu S, Zhang B C, Liu R Y, Guo L X and Wu Y W. 2014. Comparative studies on solar activity variations of NmF2 at the arctic and Antarctic stations . Chinese Journal of Geophysics, 57 (11): 3502–3511. [DOI: 10.6038/cjg20141102] ( 徐盛, 张北辰, 刘瑞源, 郭立新, 武业文. 2014. 极区电离层F2层峰值电子浓度对太阳活动依赖性的共轭研究 . 地球物理学报, 57 (11): 3502–3511. [DOI: 10.6038/cjg20141102] )
-
Yonezawa T. 1971. The solar-activity and latitudinal characteristics of the seasonal, non-seasonal and semi-annual variations in the peak electron densities of the F2-layer at noon and at midnight in middle and low latitudes . Journal of Atmospheric and Terrestrial Physics, 33 (6): 889–907. [DOI: 10.1016/0021-9169(71)90089-4]
-
Yu T, Wan W X, Liu L B and Zhao B Q. 2004. Global scale annual and semi-annual variations of daytime NmF2 in the high solar activity years . Journal of Atmospheric and Solar-Terrestrial Physics, 66 (18): 1691–1701. [DOI: 10.1016/j.jastp.2003.09.018]
-
Yu T, Wan W X, Liu L B, Mao T, Wang Y G and Wang J S. 2008. Simulation of the Annual and Semi-annual Variation of F2 Region Ionosphere at Mid- and Low-latitudes . Science and Technology Review, 26 (19): 25–30. [DOI: 10.3321/j.issn:1000-7857.2008.19.005] ( 余涛, 万卫星, 刘立波, 毛田, 王云冈, 王劲松. 2008. 中低纬电离层F2区峰值参量周年和半年变化及电场影响模拟研究 . 科技导报, 26 (19): 25–30. [DOI: 10.3321/j.issn:1000-7857.2008.19.005] )
-
Zhang M L, Shi J K, Wang X and Radicella S M. 2004. Ionospheric variability at low latitude station: Hainan, China. Advances in Space Research, 34 (9): 1860–1868. [DOI: 10.1016/j.asr.2004.04.005]
-
Zhang S R, Oliver W L and Fukao S. 2001. MU radar ion drift model. Advances in Space Research, 27 (1): 115–120. [DOI: 10.1016/S0273-1177(00)00146-0]
-
Zou L, Rishbeth H, Müller-Wodarg I C F, Aylward A D, Millward G H, Fuller-Rowell T J, Idenden D W and Moffett R J. 2000. Annual and semiannual variations in the ionospheric F2-layer. I. Modelling. Annales Geophysicae, 18 (8): 927–944. [DOI: 10.1007/s00585-000-0927-8]