

|
收稿日期:
2017-08-30;
优先数字出版日期:
2017-11-01
基金项目:国家自然科学基金(编号:41275034,91338203)
第一作者简介: 冯绚(1979— ),女,副研究员,研究方向为大气辐射传输、定量遥感和遥感仪器在轨定标方法的理论和应用。E-mail:fengxuan@cma.cn
中图分类号: TP79
文献标识码: A
|
摘要
国外相关研究结果表明,月球表面的光度学稳定度可达10–8/年,是自由空间内稳定的辐射参考源,可用于星载遥感仪器的外定标。与基于地球表面目标观测的在轨定标方法相比,最大的优势在于在轨月球观测信息中没有大气辐射的贡献,大气窗区和非窗区处理方式几乎一致。同时,作为整体发射率稳定的自然天体,月球表面的温度范围在90—390 K之间,完全满足通常对地观测探测的动态范围要求。月球复杂的表面辐射特性,是制约对月定标技术发展的主要原因之一。月球表面辐射特性与月表发射率、月表温度密切相关。月表温度分布是月球重要的热物理参数之一,是月球表面热演化模型的必要边界条件,同时也是研究月球表面发射谱的关键参数。获取月表温度的方法大致可以分为两大类:直接测量温度数据和建立物理模型预测。直接测量温度数据又可以细分为下面3种方法:地基遥感测量、绕月探测卫星遥感测量、登陆月球直接测量表面温度。地基观测的空间分辨率很低,只能反映出一大片区域的平均温度;另外两种方法花费巨大,且不能对全月的温度变化进行长期的观测。月表温度物理模型基于热传导理论,结合月壤样本的热物理参数,将月球当成半无限固体,根据Stefan-Boltzmann定律和能量守恒定律,得到月表物理温度和太阳辐照度、月球内部热流的关系。太阳辐照度是月表温度分布的最重要的因素。本文以天文计算为基础,准确描述月表有效太阳辐照度与太阳常数、太阳辐射入射角以及日月距离之间的关系,建立一个可以计算任意时刻、任意经纬度坐标点的月表温度模型,从而有助于准确描述月表辐射特性。与风云二号G星的观测结果对比,该模型可以准确描述月相的变化。阿波罗15号首次开展了一系列探索月球的科学试验,其中在登月点附近开展的月表热流试验是ALSEP(Apollo Lunar Surface Experiments Package)的重要组成部分。月表热流试验提供了登月点附近长时间的月表温度数据,通过与阿波罗15号实测数据进行对比,当太阳高度角大于0°时,该模型可以准确描述月球表面的温度变化;当太阳高度角在一定范围内时,模型的温度误差在1 K以内。
关键词
月表, 物理温度, 实时模型, 辐射定标
Abstract
Lunar surface temperature may be of interest in the radiometric calibration of space-based sensors. It is an essential parameter for exploring the Moon and a necessary boundary condition for studying lunar thermal evolution. This study presents a real-time model of lunar surface temperature based on the lunar surface temperature steady-state model of Racca. The effective solar irradiance can be calculated accurately and in real time. The proposed model can nearly accurately describe variations in Moon phases based on qualitative comparisons with lunar infrared images provided by the FY-2G satellite. A heat flow experiment provides the time series of the lunar surface temperature at the Apollo 15 landing site since the experiment started until its end in 1974. Result from the temperature model fits well with the measurement when the solar elevation angle is greater than zero. Furthermore, the differences between the calculated and measured temperature results are within ±1 K for the fifth day up to the tenth day since the elevation angle of the Sun is above the surface.
Key words
lunar surface, temperature, real-time model, radiometric calibration
1 INTRODUCTION
The accurate calibration of space-based sensors is essential for interpreting the physical characteristics of observed objects. The accuracy demanded from data presents a challenge to the long-term stability of calibration. Onboard calibration systems for sensors are practically designed to achieve the highest stability; however, drifts of 1% to several percent over the lifetime of a sensor indicate limitations (Kieffer, et al., 1996).
The reflectance properties of the Moon are stable at the order of 10–8 yr–1 (Kieffer, et al., 2005). The intrinsic stability of the photometric properties of the lunar surface suggests that in-flight calibration can use the Moon as a long-term reference source (Kieffer, et al., 1998; 2003). Researchers at the U.S. Geological Survey have established the Moon as a viable calibration source in the visible and near-infrared spectral ranges (Buratti, et al., 2011; Stone, et al., 2006).
Lunar calibration and modeling are considerably less accurate when λ > 2.5 μm. Pugacheva, et al. (2001) derived an analytical expression that provided brightness temperature variations at any point on the Moon in the infrared (10—12 μm) spectral range as functions of albedo, phase angle, and the distance between the Sun and the Moon. Pugacheva, et al. (2001) used the model (Pugacheva, et al., 1999) to calibrate mid-infrared measurements from a geosynchronous satellite against the Moon. Extending this model to other infrared wavelengths is a challenging task because the brightness temperature of a specific location on the Moon depends on the wavelength. Thermal radiation is not only the function of surface emissivity but also of surface temperature. A sophisticated thermal model is required to predict the disk-resolved temperature of the Moon (Price, 2004).
This study aims to present a real-time model of lunar surface temperature, which may be of interest in the radiometric calibration of space-based sensors. Furthermore, lunar surface temperature is an essential parameter for exploring the Moon and a necessary boundary condition for studying lunar thermal evolution (Li, et al., 2010).
2 REAL-TIME MODEL OF LUNAR SURFACE TEMPERATURE
2.1 Model of Moon surface temperature
A physical model of lunar surface temperature is based on heat conduction theory. Racca (1995) developed a Moon surface temperature model by solving the heat conduction equation with the thermal-physical parameters of lunar regolith samples. His model aims to describe the lunar surface illuminated by the Sun at steady-state conditions, i.e., allowing sufficient time for the transient to vanish.
The following expression defines the Moon surface temperature model developed by Racca (1995)
|
$\small{\begin{array}{l}T\left({\phi, \psi } \right) = \\{\left[ {\displaystyle\frac{{\left({1 - \bar A} \right)}}{\varepsilon }\cos \phi \cos \psi \displaystyle\frac{{{E_{\rm{sun}}}}}{\sigma } + \displaystyle\frac{M}{\sigma }} \right]^{1/4}}\end{array}}$
|
(1) |
where ϕ and ψ denote the latitude and longitude, respectively, of a given lunar location computed from a subsolar point;
2.2 Effective solar irradiance model
The Sun is the sole energy source of the Moon. The lunar surface temperature is correlated with variations in the effective solar irradiance, which is a normal component of solar irradiance.
Most lunar surface temperature models, including Eq. (1), regard solar irradiance as invariable, and a variation in the effective solar irradiance is simply the cosine function of the solar incidence angle (Lawson, et al., 2000) or the selenographic coordinates of a location (Racca, 1995). The solar constant (integrated solar irradiance at 1 AU) varies with distance. When perihelion and aphelion distances are considered, the solar constant varies from 1418 W·m–2 to 1326 W·m–2, and a temperature variation of ±3 K is found at subsolar point ( Racca, 1995). Furthermore, when the trajectory of the Sun-Earth-Moon system is considered according to Kepler’s law and the rotation and revolution of the Moon, the relationship between the effective solar irradiance and solar irradiance is too simple and inaccurate to describe as a cosine function (Li, et al., 2008).
To improve the accuracy of the lunar surface temperature model, the effective solar irradiance should be described based on planetary theory VSOP82 and Chapront ELP-2000/82 lunar theory (Meeus, 1991).
The effective solar irradiance Eeff can be obtained from
|
$\small{{E_{\rm{eff}}} = {E_{\rm{sun}}} \cdot \cos i }$
|
(2) |
where Esun is the solar irradiance in W·m–2, and i is the solar zenith angle in degree.
As shown in Eq. (2), the effective solar irradiance is related to solar irradiance and the solar zenith angle. To accurately calculate the effective solar irradiance, solar irradiance and the solar zenith angle should be analyzed comprehensively.
First, solar irradiance Esun is calculated using the following formula
|
$\small{{E_{\rm{sun}}} = {S_0} \cdot R_{\rm{sm}}^{ - 2}} $
|
(3) |
where S0 is the solar constant, and Rsm is the distance from the Moon to the Sun in AU.
The geometric relationship among the Sun, the Earth, and the Moon is shown in Fig. 1. The distance Rsm is calculated by
|
$\small{{R_{\rm{sm}}} = {R_{\rm{em}}} \cdot \frac{{\sin {W_{\rm{em}}}}}{{\sin {W_{\rm{sm}}}}}}$
|
(4) |
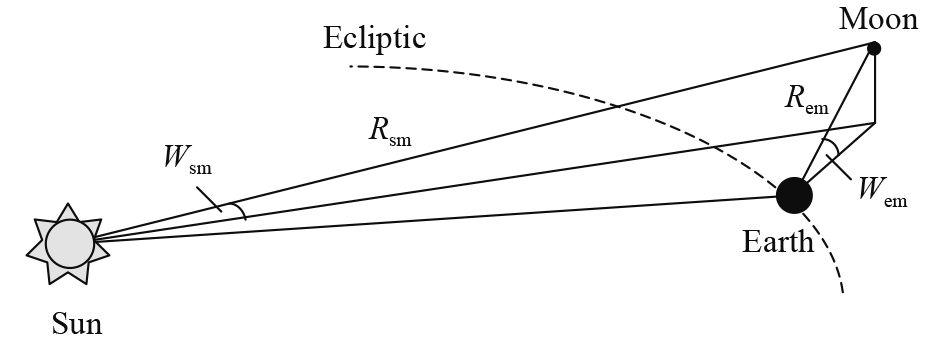

where Rem is the distance from the Earth to the Moon in AU, Wem is the geocentric latitude of the Moon, and Wsm is the ecliptic latitude of the Moon.
A relationship exists between Wem and Wsm, which can be expressed as
|
$\small{{W_{\rm{sm}}} = {W_{\rm{em}}} \cdot \frac{{{R_{\rm{em}}}}}{{{R_{\rm{se}}}}}}$
|
(5) |
where Rse is the distance from the Sun to the Earth in AU. When Eq. (3) is substituted into Eq. (5), solar irradiance is obtained from
|
$\small{{E_{\rm{sun}}} = \frac{{{S_0}{{\sin }^2}\left( {{W_{\rm{em}}}{R_{\rm{em}}}/{R_{\rm{se}}}} \right)}}{{R_{\rm{em}}^2{{\sin }^2}{W_{\rm{em}}}}}}$
|
(6) |
Second, the solar zenith angle i is determined from other known angles as below
|
$\small{i = {A_i} + {B_i}}$
|
(7) |
The relationship among angles i, Ai, and Bi (in degrees) is shown in Fig. 2. P and Q respectively denote the point directly under the Sun and the point of observation. Jp and Wp are the selenographic longitude and latitude of P, respectively. Jq and Wq are the selenographic longitude and latitude of Q, respectively.
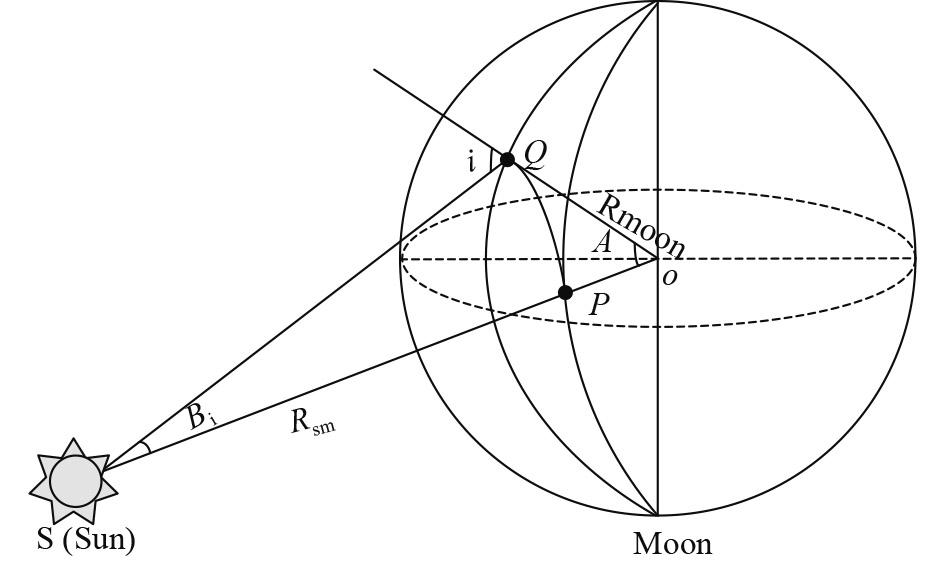
On the basis of spherical trigonometry, the cosine of Ai is given by
|
$\small{\begin{aligned}\cos {A_i} = & \sin {W_q}\sin {W_p} +\\ &{ \cos {W_q}\cos {W_p}\cos \left( {{J_q} - {J_p}} \right)}\end{aligned}}$
|
(8) |
Angle PQS between arc PQ and distance QS is obtained from
|
$\small{\angle PQS = {\tan ^{ - 1}}\left( {\frac{{\cos {A_i} - \displaystyle\frac{{{R_{moon}}}}{{{R_{moon}} + {W_{sm}}}}}}{{\sin {A_i}}}} \right)}$
|
(9) |
where Rmoon is the radius of the Moon in AU.
In triangle SQO, angle Bi is given by
|
$\small{\begin{aligned}{B_i} = &{180^ \circ } - {A_i} - \left( {{{90}^ \circ } + \angle PQS} \right)= \\&{ {{90}^ \circ } - ({A_i} + \angle PQS)}\end{aligned}}$
|
(10) |
The solar zenith angle i can be calculated as
|
$\small{i = {A_i} + {B_i} = {90^ \circ } - \angle PQS}$
|
(11) |
From Eq. (6) and Eq. (11), the effective solar irradiance is
|
$\small{\begin{aligned}{E_{\rm{eff}}} = & {E_{\rm{sun}}} \cdot \cos i =\\ &{ \displaystyle\frac{{{S_0}{{\sin }^2}\left( {{W_{\rm{em}}}{R_{\rm{em}}}/{R_{\rm{se}}}} \right)}}{{R_{\rm{em}}^2{{\sin }^2}{W_{\rm{em}}}}} \cdot \cos \left( {{{90}^ \circ } - \angle PQS} \right)}=\\ &{ \displaystyle\frac{{{S_0}{{\sin }^2}\left( {{W_{\rm{em}}}{R_{\rm{em}}}/{R_{\rm{se}}}} \right)}}{{R_{\rm{em}}^2{{\sin }^2}{W_{\rm{em}}}}} \cdot \cos }\angle PQS =\\ & \displaystyle \frac{{{S_0}{{\sin }^2}\left( {{W_{\rm{em}}}{R_{\rm{em}}}/{R_{\rm{se}}}} \right)}}{{R_{\rm{em}}^2{{\sin }^2}{W_{\rm{em}}}}} \cdot\\ & \cos \left[ {{{\tan }^{ - 1}}\left( { \displaystyle\frac{{\cos {A_i} - \displaystyle\frac{{{R_{\rm{moon}}}}}{{{R_{\rm{moon}}} + {W_{\rm{sm}}}}}}}{{\sin {A_i}}}} \right)} \right]\end{aligned}}$
|
(12) |
2.3 Real-time model of lunar surface temperature
The effective solar irradiance is obtained from Eq. (12). Parameters in Eq. (12), such as Wem, Rem, and Rse, can be calculated from astronomical algorithms for a given instant (dynamical time) (Meeus, 1991), which is beyond the scope of this study.
The surface temperature model of the Moon, which substitutes the effective solar irradiance in Eq. (12) into Eq. (1), is defined as below
|
$\small{\begin{aligned}T\left( {{J_q},{W_q}} \right) = & {\left[ {\displaystyle\frac{{\left( {1 - \bar A} \right)}}{\varepsilon }\displaystyle\frac{{{E_{\rm{eff}}}}}{\sigma } + \displaystyle\frac{M}{\sigma }} \right]^{1/4}} = \\ &{{{\left[ {\displaystyle\frac{{\left( {1 - \bar A} \right)}}{\varepsilon }\displaystyle\frac{{{E_{\rm{sun}}} \cdot \cos i}}{\sigma } + \displaystyle\frac{M}{\sigma }} \right]}^{1/4}}}\end{aligned}}$
|
(13) |
where T is the temperature of the observation point for a given instant (dynamical time); and Jq and Wq are the selenographic longitude and latitude of the observation point, respectively.
3 DISCUSSION
3.1 Simulation results of the real-time model
Through Eq. (13), Eq. (12), and Eq. (8), the surface temperature of the Moon can be obtained for a given instant (dynamical time). This section will present several simulation results of the real-time model of lunar surface temperature.
Fig. 3 shows the diurnal variation of solar irradiance at point (0°E, 0°N) in 2015. The maximum and minimum solar irradiance are 1415.911 W m–2 and 1321.065 W m–2, respectively. The largest solar irradiance difference is approximately 100 W m–2 between the perihelion and aphelion distances. Furthermore, the curve is not smooth in Fig. 3, where fluctuations are caused by the periodic revolution of the Moon around the Earth.
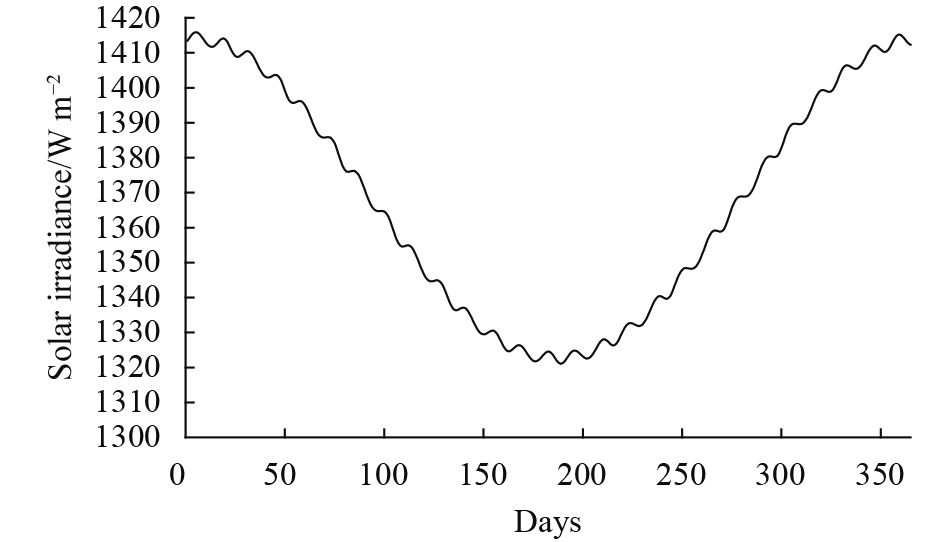
Fig. 4 and Fig. 5 show the diurnal variation in lunar surface temperature with the effective solar irradiance and the solar zenith angle at points (0°E, 0°N) and (0°E, 60°N), respectively. The maximum solar zenith angle at the determined point is nearly stable because the variation range of the subsolar selenographic latitude is only ±1.54242°, which is caused by the inclination of the mean lunar equator to the ecliptic latitude, that is, 1.54242°. The variation in the maximum lunar surface temperature at the determined point corresponds to the effective solar irradiance, which varies with the distance from the Earth to the Sun. Variation is more apparent at a higher latitude location; for example, it is approximately 6 K at 0°N and 12 K at 60°N.
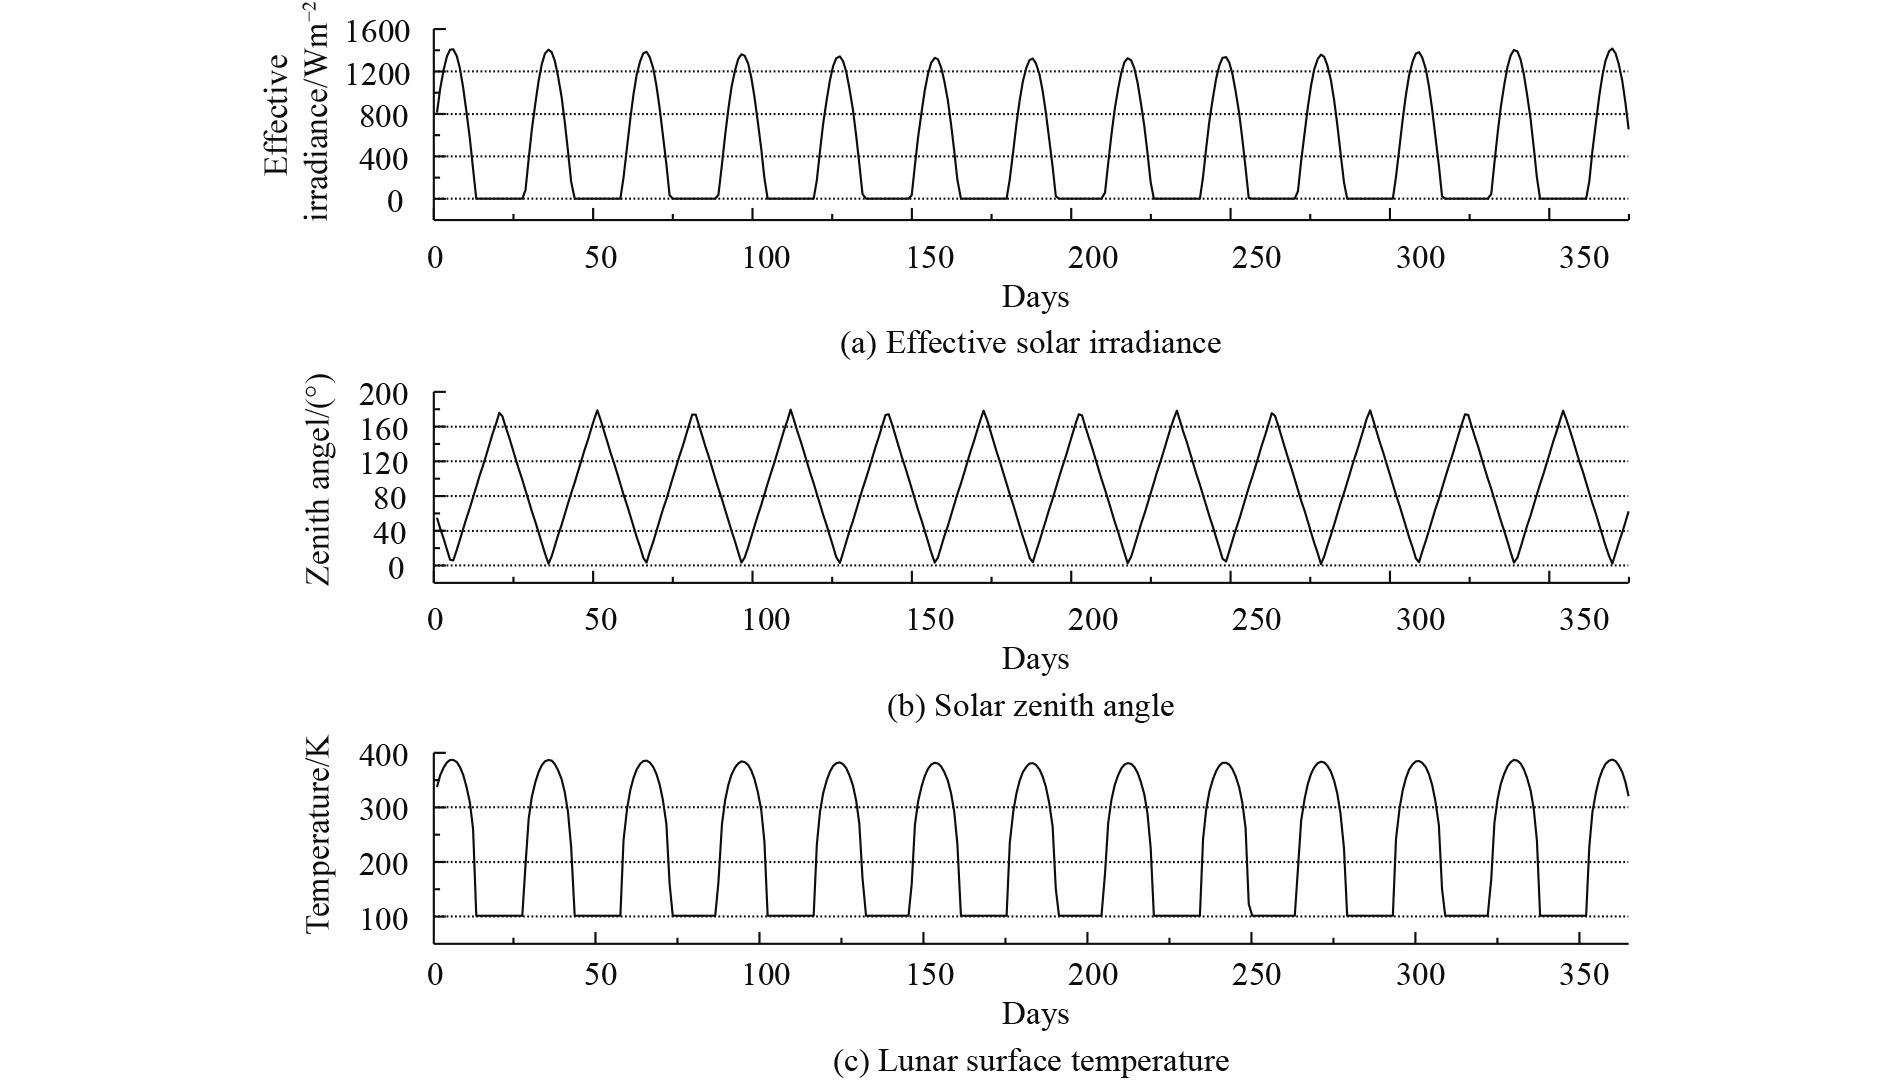

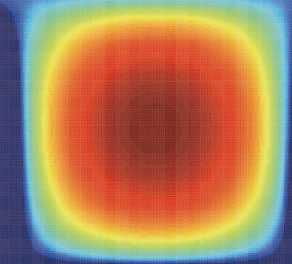
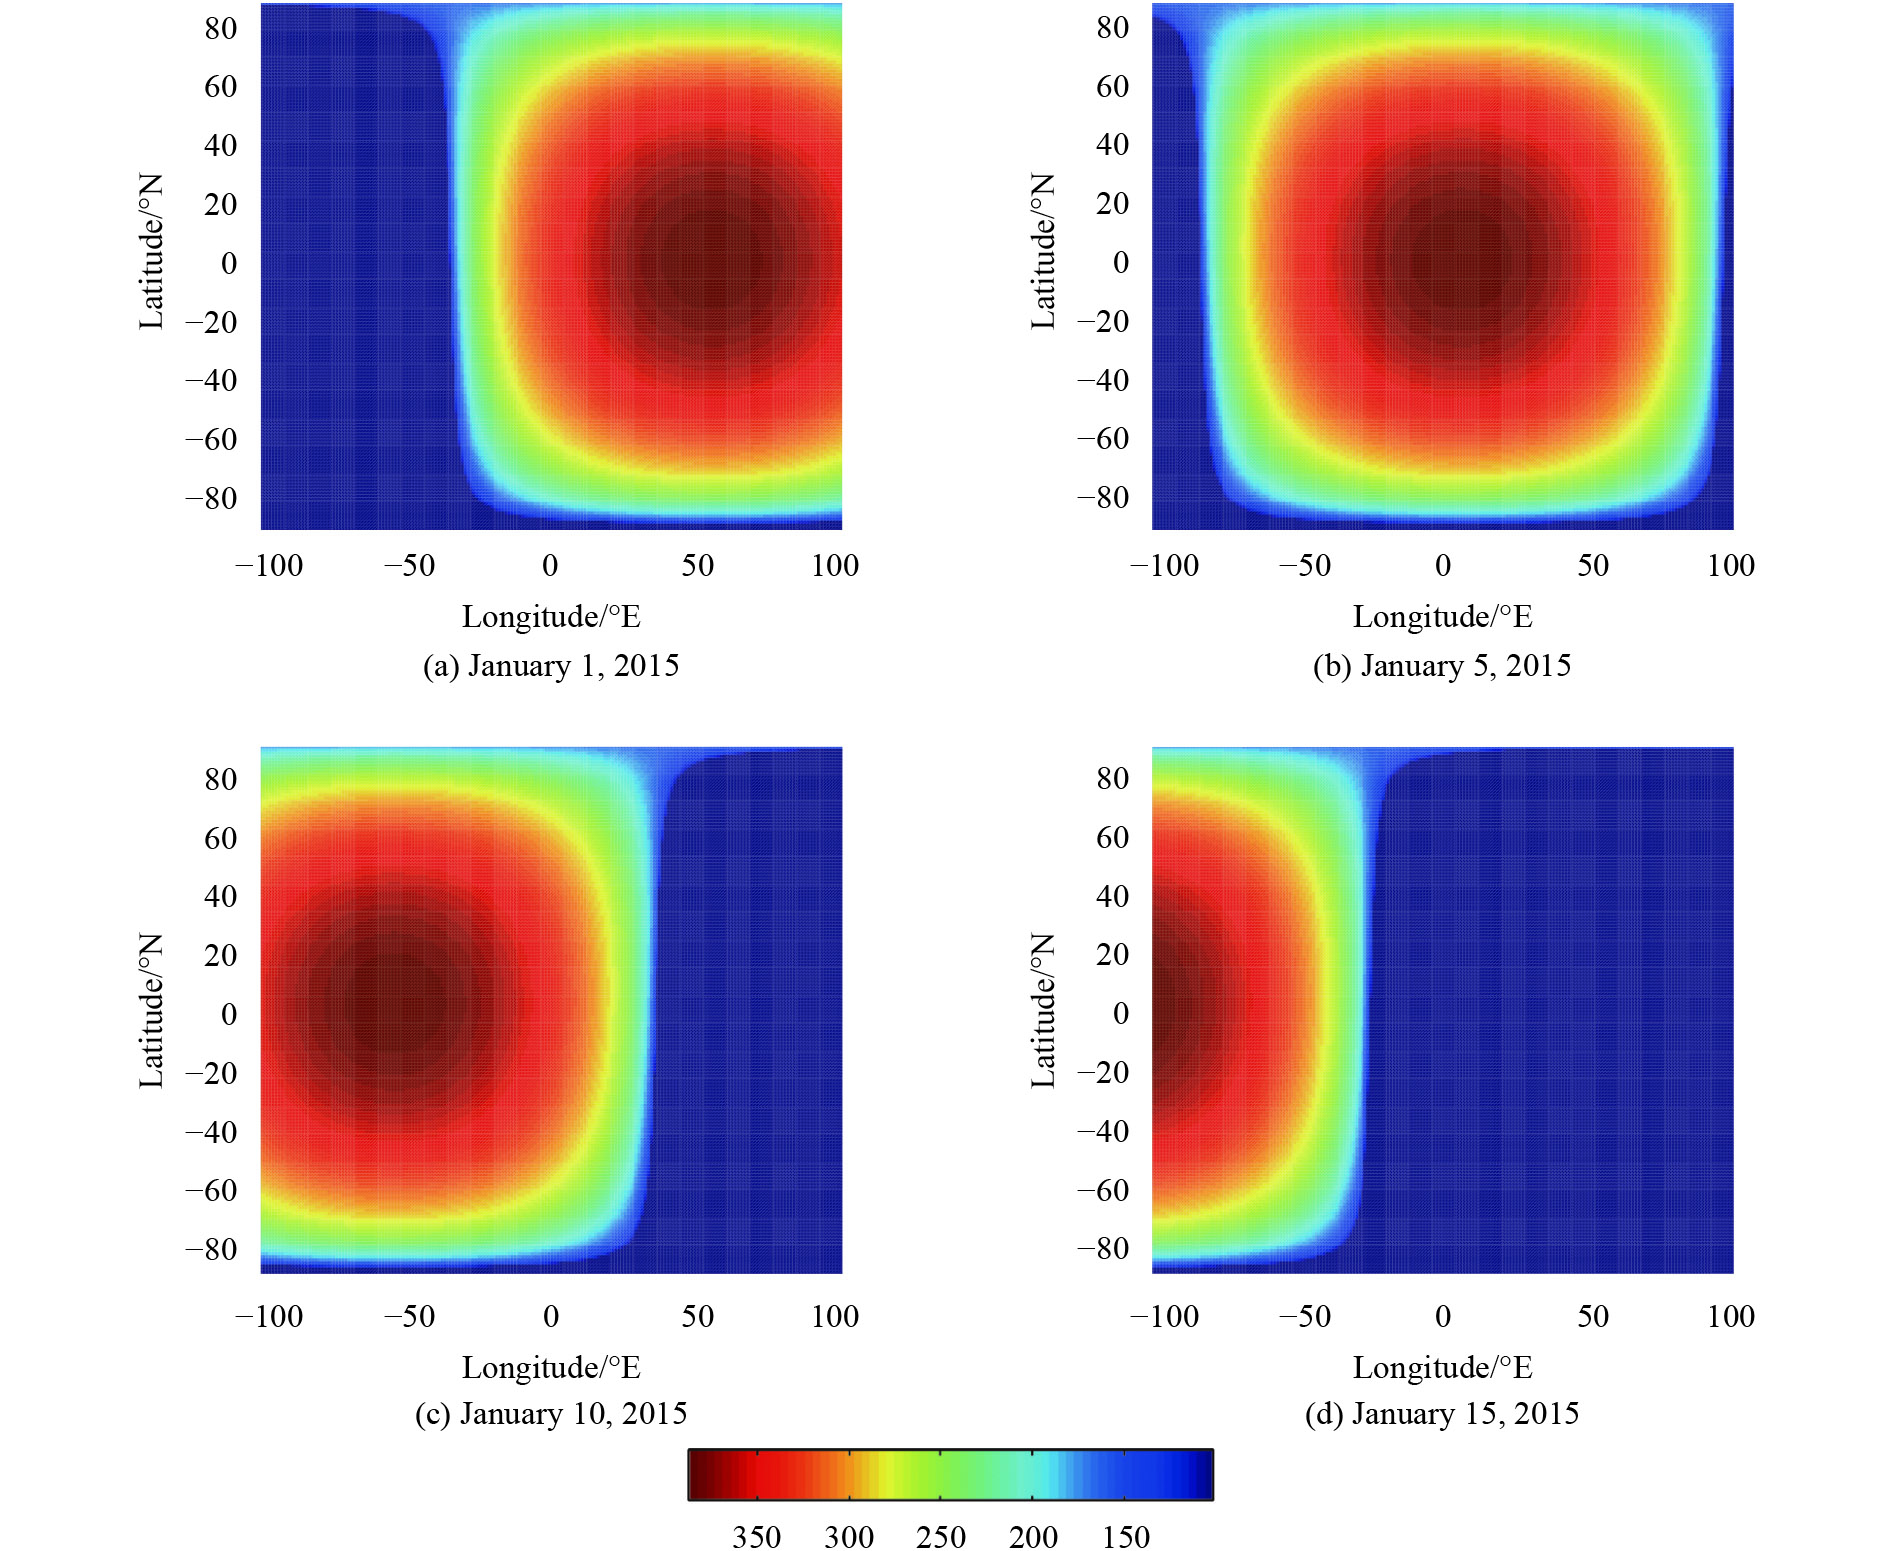
Fig. 6 presents the temperature distribution on the lunar surface at different times. In general, the same hemisphere of the Moon is always turned toward the Earth and only the illuminated fraction of the Moon’s disk is visible. The illuminated fraction changes due to the variation angle of the Sun as the Moon orbits the Earth. The navy blue part in Fig. 6 is not illuminated by the Sun. The subsolar selenographic latitude is nearly stable, whereas the longitude varies with time. Therefore, the temperature distribution along the longitude is asymmetrical, as shown in Fig. 6.
3.2 Comparisons with FY-2G satellite data
FY-2G is a Chinese geostationary meteorological satellite launched in 2014. It carries a visible and infrared spin scan radiometer. The FY-2G imager periodically captures images of the Moon in the corners and margins of a rectangular field of interest. Fig. 7 shows the infrared image of the Earth’s disk provided by FY-2G, with the Moon appearing at the top left corner of the image. Through the analysis of the stray light outside the Earth’s disk, lunar measurements will be compared with the lunar surface temperature model when the Moon appears at the bottom right corner outside of the Earth’s disk to reduce the stray light effect (Guo, et al., 2007).
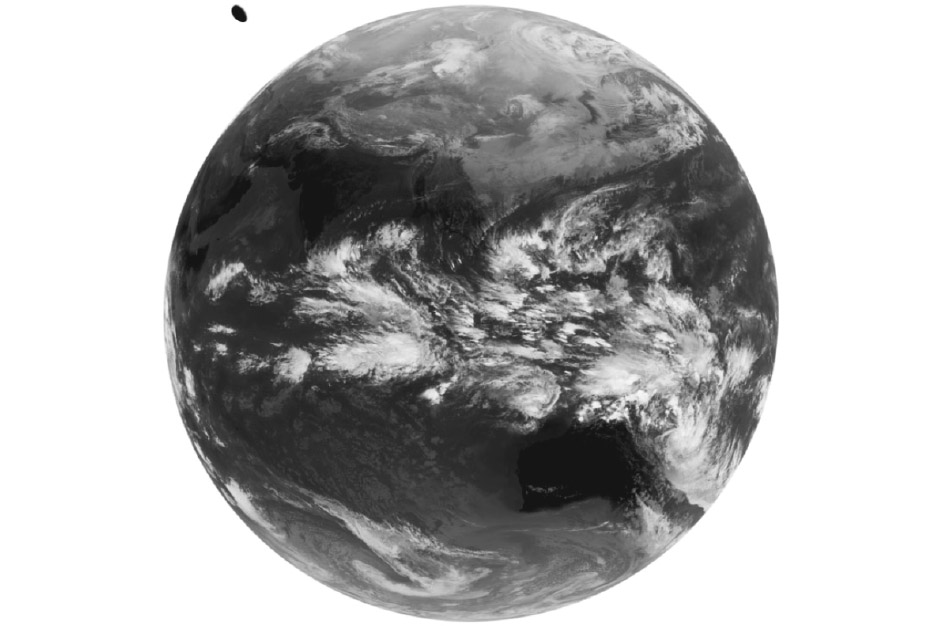
Fig. 8 presents the results from the lunar surface temperature model and the lunar infrared images provided by FY-2G at different times. Various lines correspond to different times. The results from the temperature model are in the first column, whereas the measurements provided by FY-2G are in the second column.
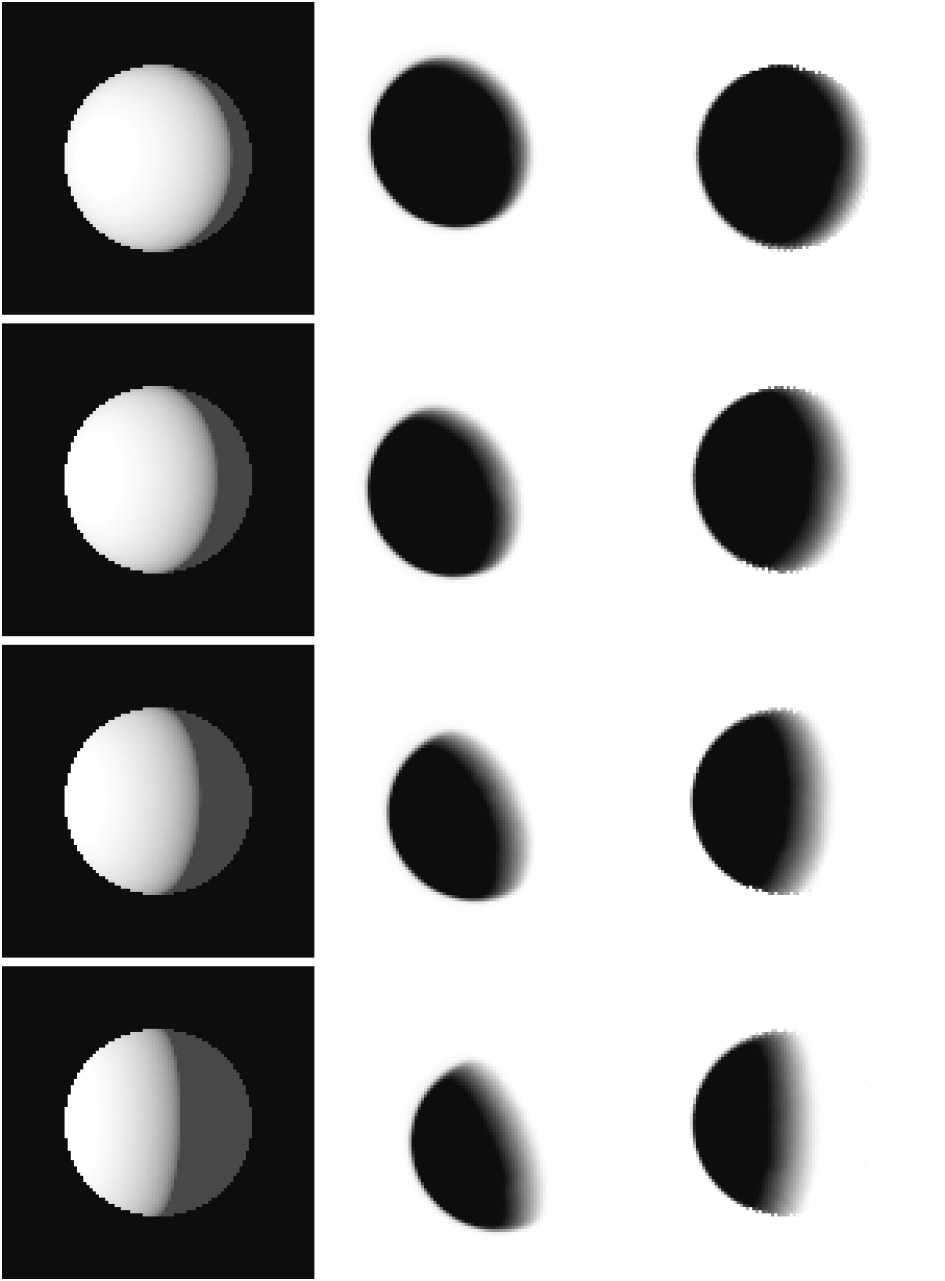
When the relative motion of the Moon and FY-2G is considered, including the moon phase and libration shown in Fig. 9, the lunar images in the field of view of FY-2G should be accurately reprojected to the selenographic coordinate system to compare with the results from the lunar temperature model. The reprojected lunar images are presented in the third column of Fig. 8.

Fig. 9 shows the diurnal variation of the librations in longitude and latitude in 2015. The mean center of the Moon’s apparent disk is the origin of the system of selenographic coordinates on the surface of the Moon. The displacement at any time of the mean center of the disk from the apparent center represents the libration amount and is measured using the selenographic coordinates of the apparent center of the disk at that time (Meeus, 1991).
3.3 Comparisons with APOLLO landing sites
Apollo 15 was the first in a series of missions designed to explore the Moon over longer periods, greater ranges, and using more instruments for scientific data acquisition (Huang, 2008). The heat flow experiment at the Apollo 15 landing site is an important component of the Apollo Lunar Surface Experiments Package (ALSEP). The essential measurements for determining heat flow were made by two slender temperature-sensing probes placed into predrilled holes in the regolith and spaced approximately 10 m apart. Four thermocouple junctions in the cables connected each probe to the electronic unit (Langseth, et al., 1972).
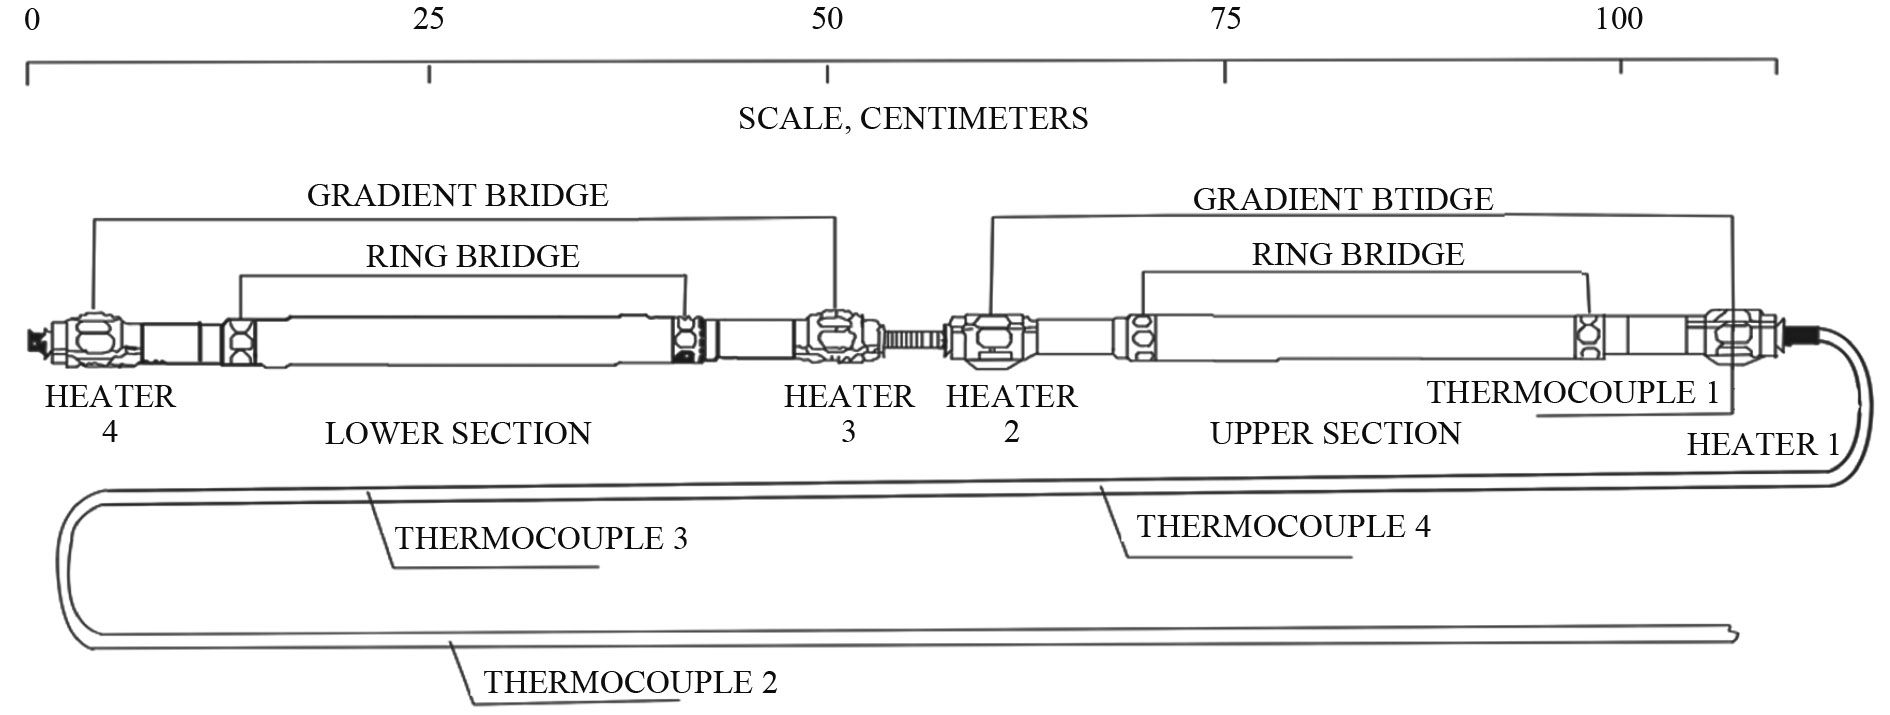
Lunar surface temperatures were provided from five of the eight thermocouples in the probe cables, which were immediately above or nearly on the lunar surface (Apollo 15 mission report). Fig. 10 shows the actual emplacements of two probes and five thermocouples, which provide lunar surface temperatures. Fig. 11 shows the schematic of the heat flow probe. As shown in the figure, lunar surface temperatures were provided by Thermocouples 1 and 2 on Probe 1 and Thermocouples 1, 2, and 3 on Probe 2.
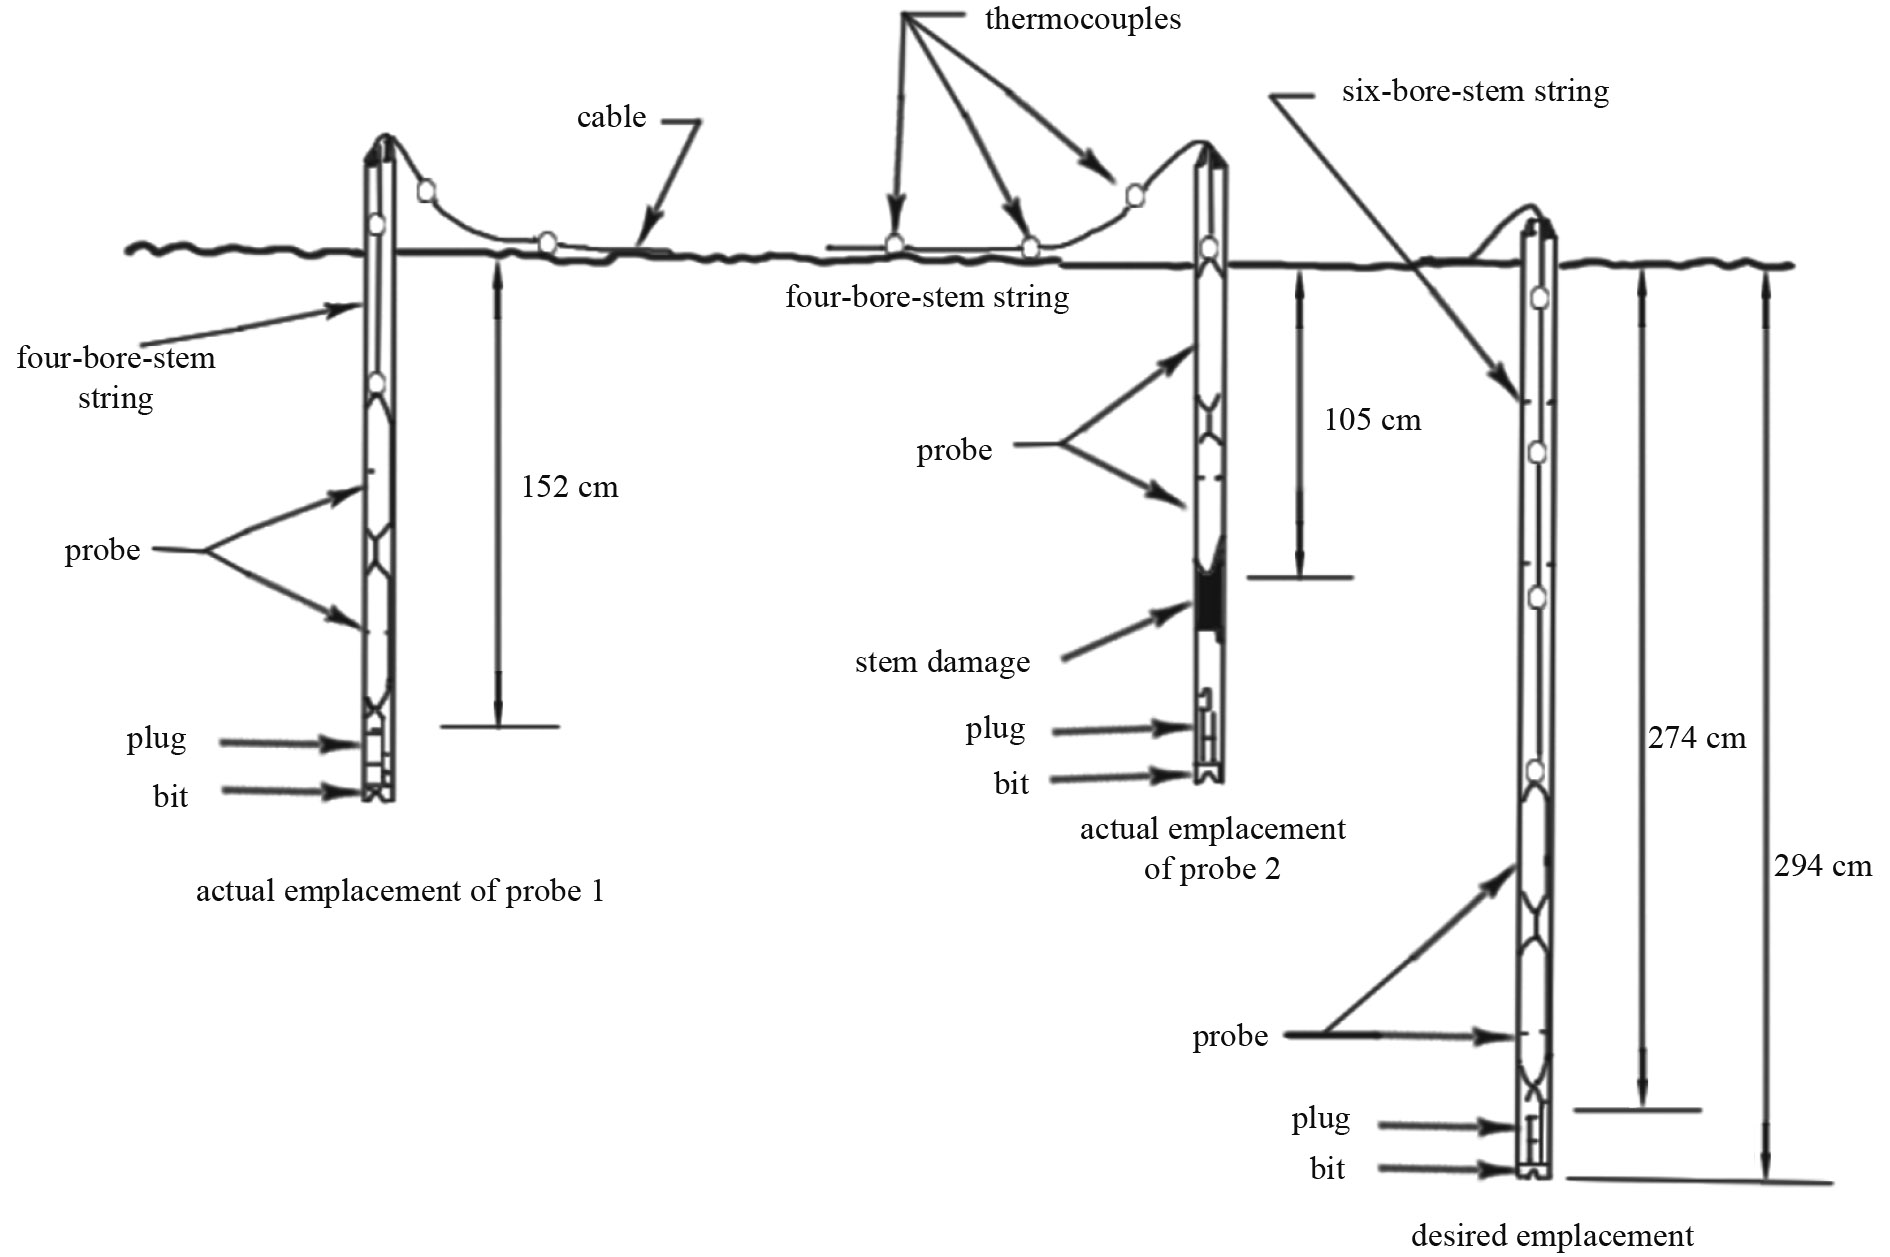
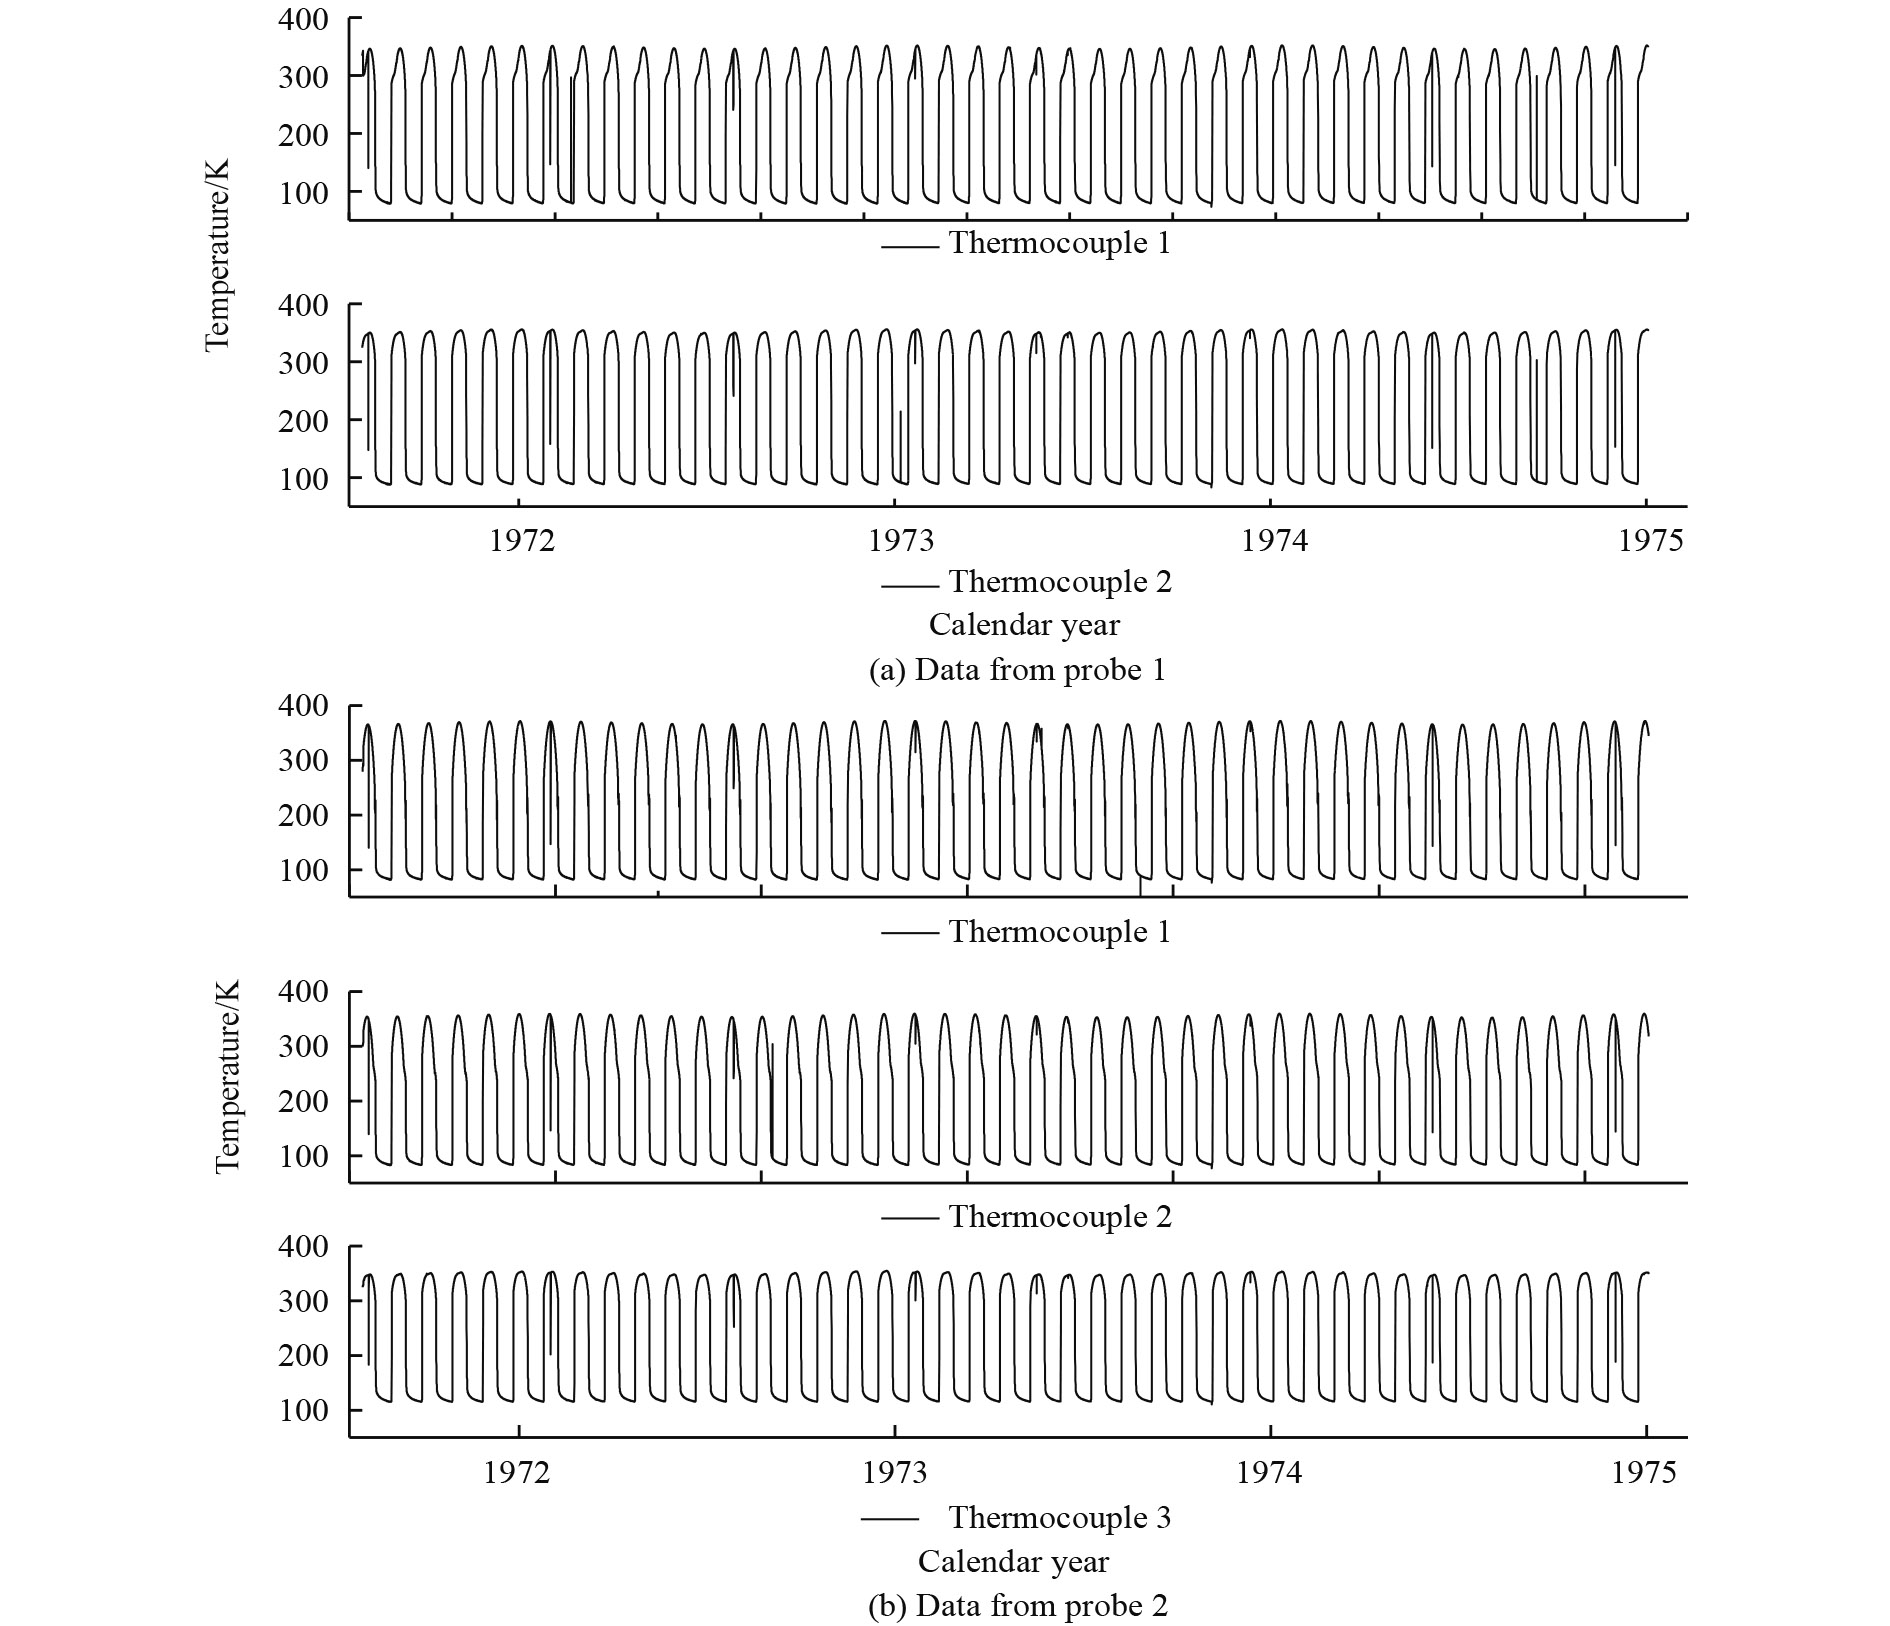
Five lunar surface temperature time series from the landing site of the Apollo 15 mission are shown in Fig. 12. The time series is part of the historical data archive PSPG-00093 of the U.S. National Space Science Data Center. The time series contains all the data from the time the Apollo 15 heat flow experiment started until its end in 1974 (description of Apollo heat flow experiment data tapes). The measured temperatures differ from one another probably due to specific settings, such as sensor orientation, detailed configuration of the regolith surface, and actual emplacements in the probe cables. All the aforementioned factors can affect the radiation imposed on a specific sensor, and consequently, the temperature of the sensor (Huang, 2008).
A sample temperature series obtained by the surface thermocouples with the elevation angle of the Sun above the surface is shown in Fig. 13. Several features are notable. First, the maximum temperature readings do not always correspond to the time of the solar zenith. This result can be attributed to the fact that the temperature of the thermocouples depends on the orientation of the cables where they are embedded. Second, irregularities are observed at specific time intervals that generally correspond to the shadowing of the sensor. Third, “bumps” in the temperature series after sunset correspond to solar radiation reflected off the surrounding terrain (Wieczorek, et al., 2006).
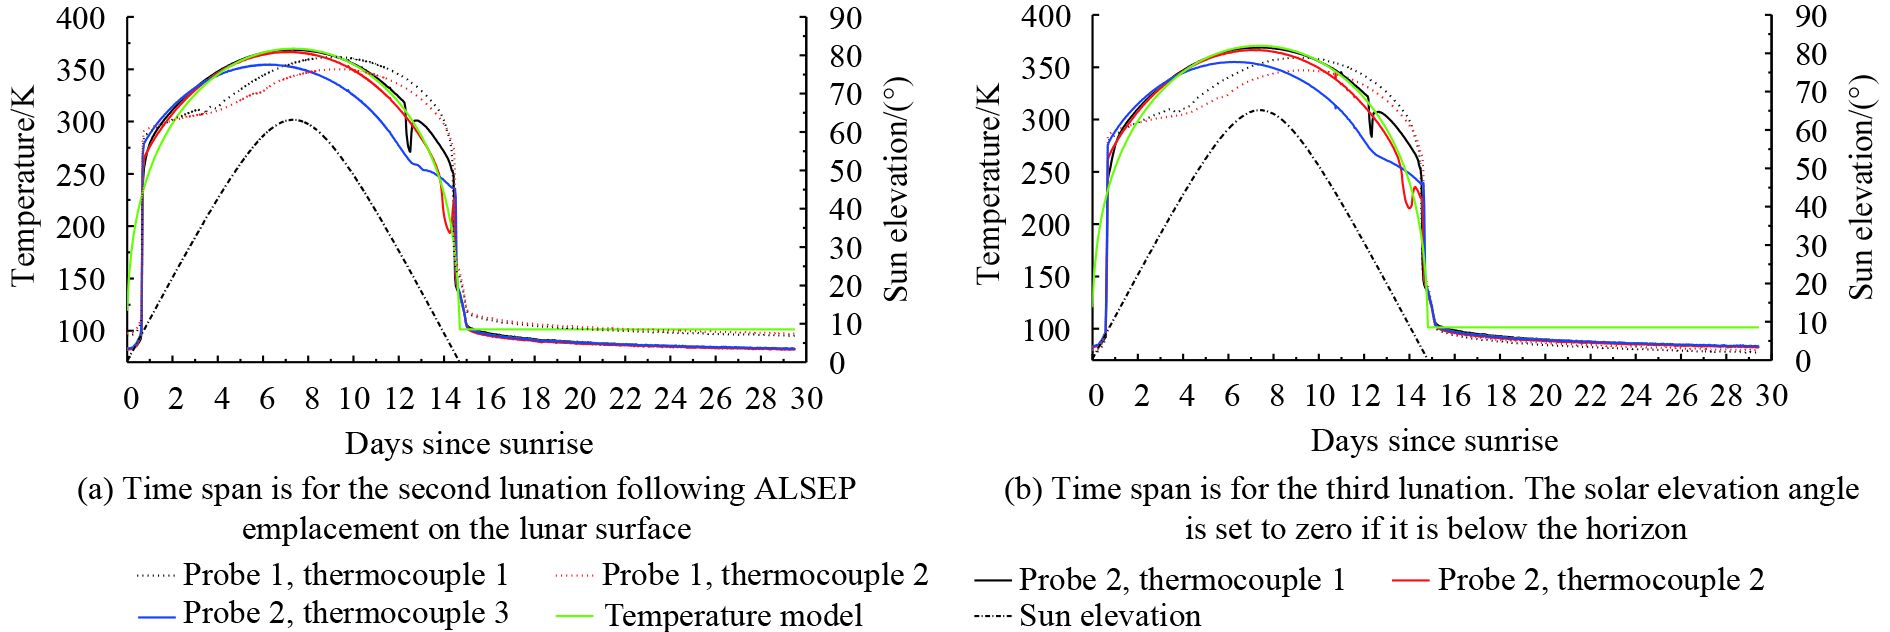
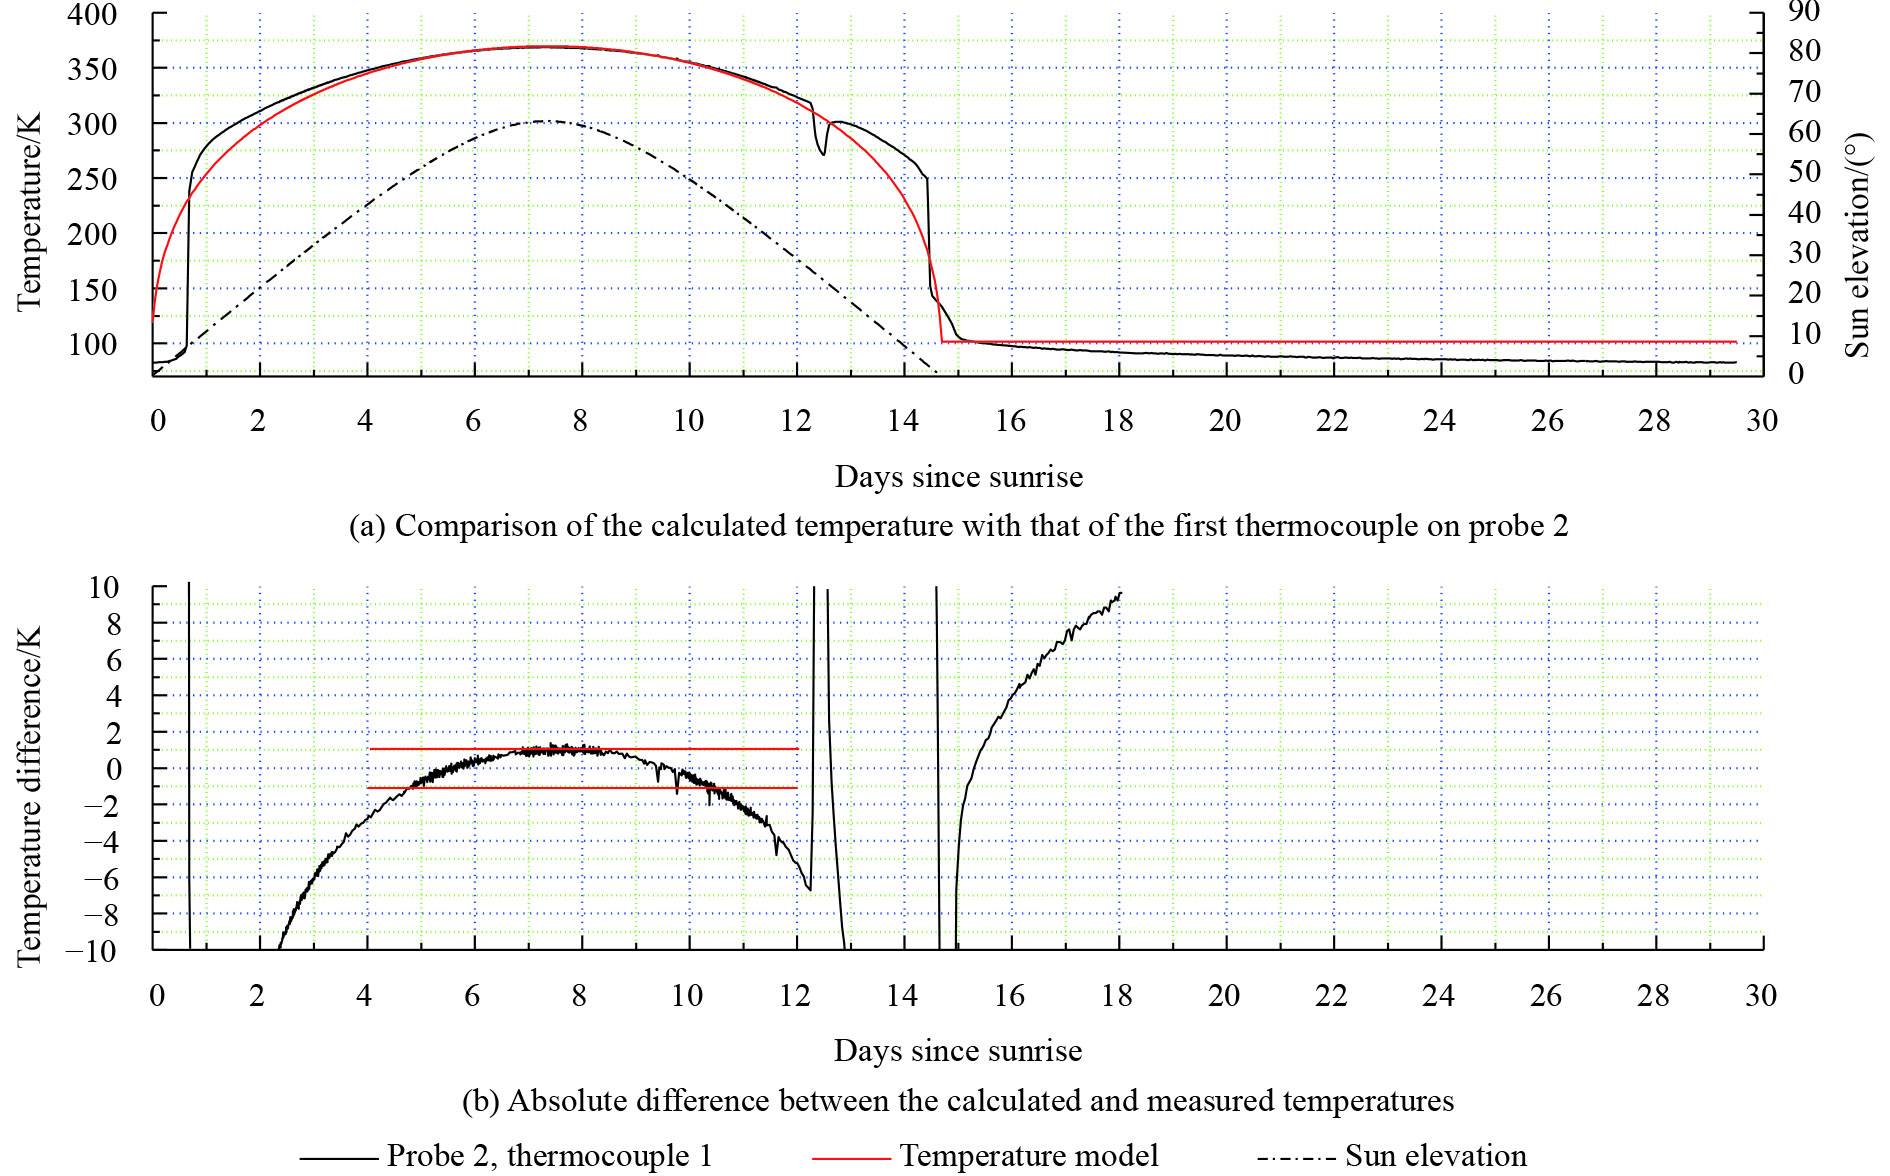
The response temperatures of Model (13) at the landing site of the Apollo 15 mission with an albedo of 0.148 and an infrared emissivity of 0.97, which correspond to the second and third lunations following ALSEP emplacement on the lunar surface, are plotted in the same graph with green lines. Despite irregularities and bumps, the calculated temperatures fit well with the measured data from Thermocouple 1 of Probe 2 when the solar elevation angle is greater than zero. From the analysis of the locations of the five thermocouples shown in Fig. 10, the first thermocouple on Probe 2 is closest to the lunar surface, and thus, its measured temperatures should approach lunar surface temperatures.
The comparison of the calculated temperature with that of the first thermocouple on Probe 2 for the second lunation following ALSEP emplacement on the lunar surface is shown in Fig. 14. From the fifth day to the tenth day since the elevation angle of the Sun was above the surface, the differences between the calculated and measured temperatures are relatively smaller and basically within ±1 K.
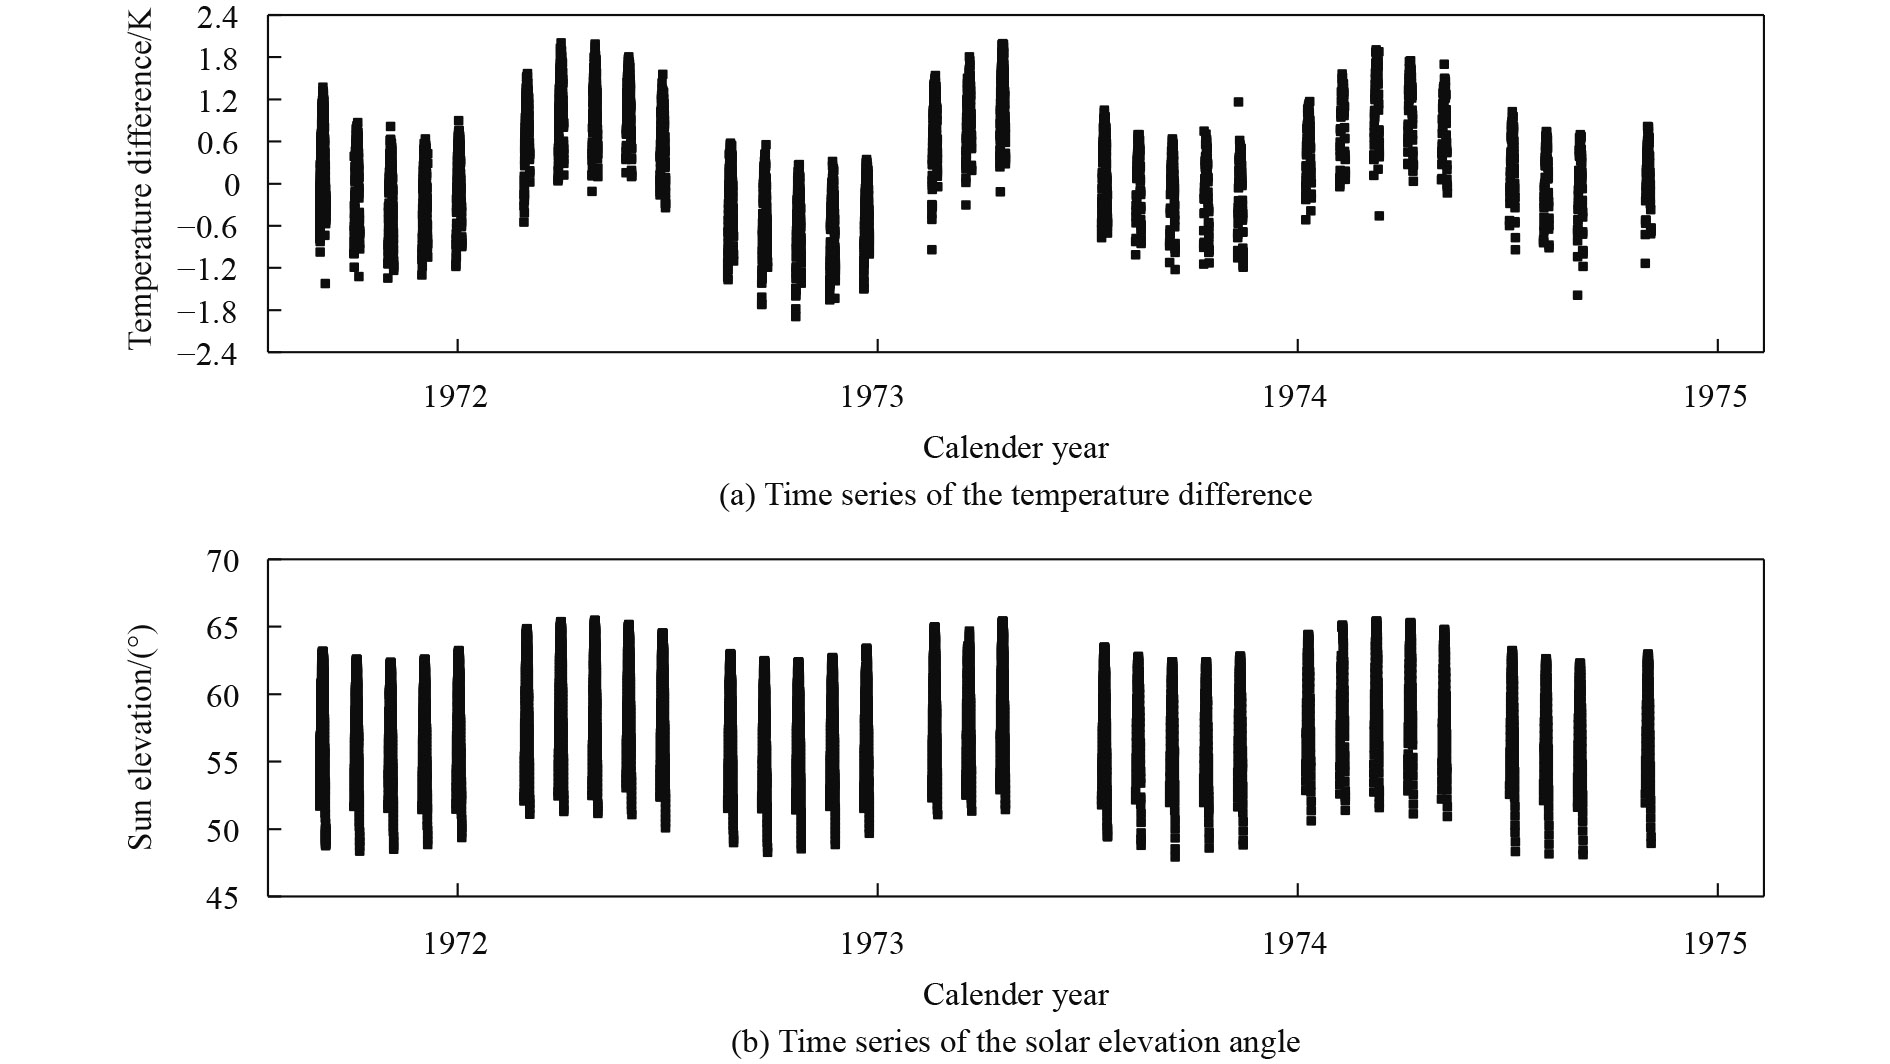
Fig. 15 shows the temperature differences in the four other lunations, and the same conclusion is obtained, that is, the differences between the calculated and measured temperatures are relatively smaller for the fifth day up to the tenth day since sunrise, and the differences are also within ±1 K.
Since the start of the Apollo 15 heat flow experiment until its end in 1974, 41 lunations occurred. The comparison of the calculated temperature with that of the first thermocouple on Probe 2 during this period is presented in Fig. 16, which only shows the fifth day up to the tenth day since the elevation angle of the Sun was above the surface. The elevation angle of the Sun is also shown in Fig. 16 for the aforementioned days. In the figure, the variation in temperature difference is approximately periodic and basically consistent with the variation in solar elevation angle.

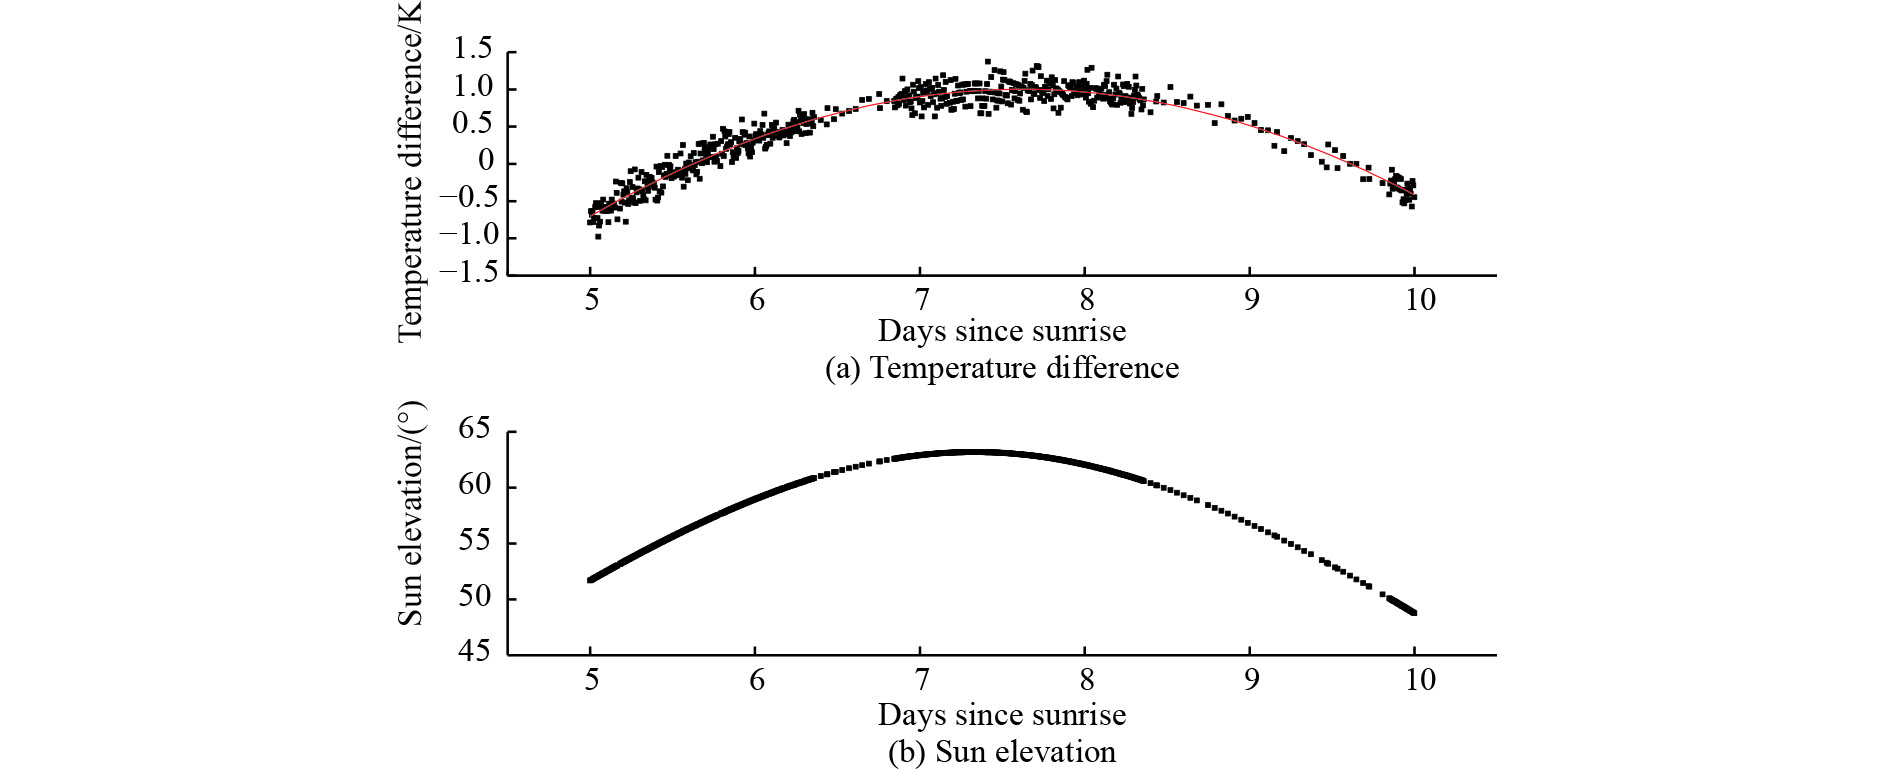
To further analyze the relationship between temperature difference and solar elevation angle, these factors are shown in Fig. 17 from the fifth day to the tenth day since the sunrise for the second lunation following ALSEP emplacement on the lunar surface. As shown in the figure, the variation in temperature difference is nearly consistent with that of the solar elevation angle, thereby implying that the temperature difference is linear with the solar elevation angle.
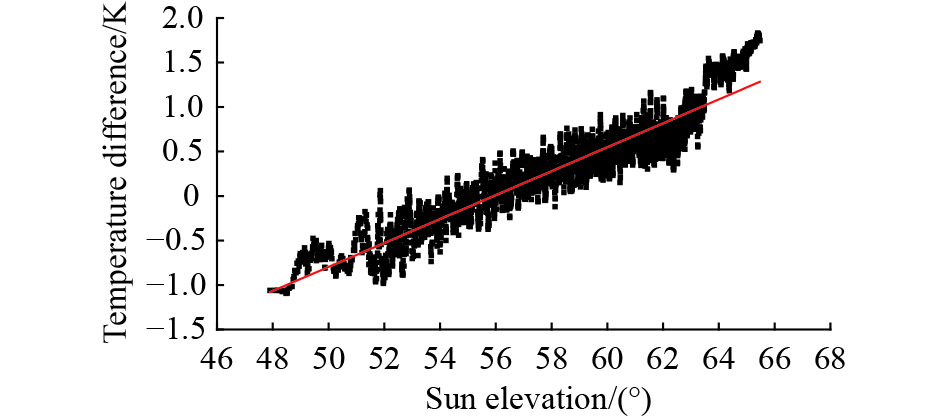
In all the 41 lunations that occurred during the entire period of the Apollo 15 heat flow experiment, a linear relationship existed between temperature difference and solar elevation angle during each period of the fifth day up to the tenth day since sunrise, as shown in Fig. 18. The differences between the calculated and measured temperatures are mostly within ±1 K.
4 CONCLUSIONS
Most of the lunar surface temperature models regard solar irradiance as invariable, and the variation in the effective solar irradiance is simply the cosine function of the solar incidence angle or the selenographic coordinates of the location. The relationship between the effective solar irradiance and solar irradiance as a cosine function is not sufficiently accurate.
This study considers the real-time variation in the effective solar irradiance of the lunar surface and establishes a real-time model of lunar surface temperature based on Racca’s lunar surface temperature steady-state model. In Racca’s model, the parameter of the effective solar irradiance can be calculated accurately and in real time.
The lunar surface temperature provided by the proposed real-time model can nearly accurately describe the variation in Moon phases based on qualitative comparisons with lunar infrared images provided by the FY-2G satellite.
The heat flow experiment provides the lunar surface temperature time series at the Apollo 15 landing site from the time the experiment started until its end in 1974. Despite the presence of irregularities and bumps, the result from the temperature model fits well with the measurement when the solar elevation angle is greater than zero. Furthermore, the differences between the calculated and measured temperature results are basically within ±1 K for the fifth day up to the tenth day since the elevation angle of the Sun was above the surface.
参考文献(References)
-
Apollo 15 mission report. Apollo 15 Lunar Surface Journal, https://www.hq.nasa.gov/alsj/a15/a15mr.htm [2017-08-30]
-
Description of Apollo heat flow experiment data tapes. https://nssdc.gsfc.nasa.gov/planetary/lunar/apollo15info.html [2017-08-30]
-
Buratti B J, Hicks M D, Nettles J, Staid M, Pieters C M, Sunshine J, Boardman J and Stone T C. 2011. A wavelength-dependent visible and infrared spectrophotometric function for the Moon based on ROLO data. Journal of Geophysical Research, 116 (E6): E00G03 [DOI: 10.1029/2010JE003724]
-
Guo Q, Xu J M and Zhang W J. 2005. Stray light modelling and analysis for the FY-2 meteorological satellite. International Journal of Remote Sensing, 26 (13): 2817–2830. [DOI: 10.1080/01431160500034292]
-
Huang S P. 2008. Surface temperatures at the nearside of the Moon as a record of the radiation budget of Earth’s climate system. Advances in Space Research, 41 (11): 1853–1860. [DOI: 10.1016/j.asr.2007.04.093]
-
Kidder S Q and von der Haar T H. 1995. Satellite Meteorology. London: Academic Press
-
Kieffer H H and Wildey R L. 1996. Establishing the moon as a spectral radiance standard. Journal of Atmospheric and Oceanic Technology, 13 : 360–375. [DOI: 10.1175/1520-0426(1996)013<0360:ETMAAS>2.0.CO;2]
-
Kieffer H H and Anderson J M. 1998. Use of the moon for spacecraft calibration over 350 to 2500 nm//Proceedings Volume 3498, Sensors, Systems, and Next-Generation Satellites II. Barcelona, Spain: SPIE: 325–336 [DOI: 10.1117/12.333646]
-
Kieffer H H, Stone T C, Barnes R A, Bender S C, Eplee R E, Mendenhall J A and Ong L. 2003. On-orbit radiometric calibration over time and between spacecraft using the moon//Proceedings Volume 4881, Sensors, Systems, and Next-Generation Satellites VI. Crete, Greece: SPIE: 287–298 [DOI: 10.1117/12.462611]
-
Kieffer H H and Stone T C. 2005. The spectral irradiance of the moon. The Astronomical Journal, 129 (6): 2887–2901. [DOI: 10.1086/430185]
-
Langseth M G Jr, Clark S P Jr, Chute J L Jr, Keihm S J and Wechsler A E. 1972. The Apollo 15 lunar heat-flow measurement. Moon, 4 (3/4): 390–410. [DOI: 10.1007/BF00562006]
-
Lawson S L, Jakosky B M, Park H S and Mellon M T. 2000. Brightness temperatures of the lunar surface: calibration and global analysis of the Clementine long-wave infrared camera data. Journal of Geophysical Research, 105 (E2): 4273–4290. [DOI: 10.1029/1999JE001047]
-
Li Y, Wang Z Z and Jiang J S. 2010. Simulations on the influence of lunar surface temperature profiles on CE-1 lunar microwave sounder brightness temperature. Science China Earth Sciences, 53 (9): 1379–1391. [DOI: 10.1007/s11430-010-4021-0]
-
Li X Y, Wang S J and Cheng A Y. 2008. A lunar surface effective solar irradiance real-time model. Chinese Journal of Geophysics, 51 (1): 25–30. [DOI: 10.1002/cjg2.v51.1]
-
Meeus J H. 1991. Astronomical Algorithms. Richmond, VA: Willmann-Bell, Incorporated
-
Price S D. 2004. Infrared irradiance calibration. Space Science Reviews, 113 (3/4): 409–456. [DOI: 10.1007/s11214-005-1700-9]
-
Pugacheva S G, Shevchenko V V, Yakovlev S G and Kibardin V M. 1999. Calibration of the Moon’s infrared images from geostationary satellite GOMS//30th Annual Lunar and Planetary Science Conference. Houston, TX: [s.n.]
-
Pugacheva S G and Shevchenko V V. 2001. The spatial angular function of thermal emission of the moon. Solar System Research, 35 (3): 181–189. [DOI: 10.1023/A:1010418620284]
-
Racca G D. 1995. Moon surface thermal characteristics for moon orbiting spacecraft thermal analysis. Planetary and Space Science, 43 (6): 835–842. [DOI: 10.1016/0032-0633(95)00067-F]
-
Stone T C and Kieffer H H. 2006. Use of the Moon to support on-orbit sensor calibration for climate change measurements//Proceedings Volume 6296, Earth Observing Systems XI. San Diego, California: SPIE [DOI: 10.1117/12.678605]
-
Wieczorek M A and Huang S. 2006. A reanalysis of Apollo 15 and 17 surface and subsurface temperature series//37th Annual Lunar and Planetary Science Conference. League City, Texas: [s.n.]