
|
收稿日期: 2018-02-02
基金项目: 财政部专项“全球空间遥感信息报送和年度报告工作专项”(编号:1061302600001)
第一作者简介: 牛铮,1965年生,男,研究员,研究方向为遥感机理和全球环境变化遥感研究。E-mail:niuzheng@radi.ac.cn
通信作者简介: 李加洪,1963年生,男,曾任国家遥感中心总工程师,现任国家科技基础条件平台中心副主任。E-mail:lijiahong@most.cn
中图分类号: TP701
文献标识码: A
|
摘要
介绍《全球生态环境遥感监测年度报告》(以下简称年报)工作的背景、内容和最新动态,以及年报工作的组织和管理流程。分析2012年—2017年报选题,概述年报围绕土地利用/土地覆盖、植被生长状态、作物产量、水域面积、建设用地分布、湿地保护等领域开展的研究和取得的成果。总结年报迄今产生的影响,并对年报选题规划、国产遥感数据应用、成果共享与宣传等方面的后续工作进行展望。
关键词
生态环境遥感, 年度报告, GEOARC, 综述, 展望
Abstract
The background, contents, recent developments, organization, and management processes of the Annual Report on Remote Sensing Monitoring of Global Ecosystem and Environment (hereafter called annual report) are reviewed. Themes present in the 2012—2017 annual reports are analyzed. Research on land use/land cover, vegetation growth, crop yield, water area, construction land distribution, and wetland protection is summarized. The annual reports’ achievements and influences are reviewed, and the required future work on theme planning, application of domestic remote sensing data, and distribution of results is highlighted.
Key words
remote sensing, ecosystem, environment, GEOARC, China
1 引 言
全球生态环境与人类的生存和发展息息相关,涉及全球气候变化、生态系统演变、人类活动影响等重大科学问题,关乎21世纪全球经济、社会的可持续发展,已受到国际社会的高度关注(Siepielski 等,2017;Craw 等,2016)。遥感技术在监测全球生态环境方面具有突出且不可替代的优势,可以及时、准确、直观地从全球、区域、国家等层面了解多种生态环境要素及其变化(Stavrakou 等,2011;徐冠华 等,2016)。
随着全球生态环境问题的日益突出,全球生态环境遥感监测越来越受到国际社会的重视(Murray 等,2018;Turpie 等,2015;Fernández 等,2010)。随着技术的不断进步,卫星遥感技术在全球生态环境监测领域的作用越发凸显,总体趋势是:卫星遥感获取数据的来源越来越多;全球生态环境遥感监测的要素从单一要素向多元化发展;监测的尺度逐渐从区域向全球尺度拓展(Yue 等,2018;Kim 等,2017;Brown 等,2017)。经过长达30年的努力,中国在地球观测领域已经取得长足进步,建立了气象、资源、环境、海洋、高分等地球观测系列卫星及应用系统,为开展全球生态环境遥感监测工作奠定了坚实基础(Meng 等,2017;Chen 等,2005;李德仁,2001)。
从2012年2月开始,科学技术部对全球生态环境遥感监测工作进行了总体部署,形成了年度报告制度。2012年—2017年,已对外公开发布6期年报。2012年—2014年的年报英文名称是“(Annual)Report on Remote Sensing Monitoring of Global Ecosystem and Environment”,2015年之后的各期年报英文名称均改为“Global Ecosystems and Environment Observation: Annual Report from China (GEOARC)”。目前,年报已经成为中国参加地球观测组织(GEO)工作的重点内容,是引领、带动全球地球观测领域技术发展的重要举措之一。
2 年报工作组织
年报工作由科技部国家遥感中心(GEO中国秘书处)牵头组织,由遥感科学国家重点实验室协助运行与管理。在国家相关科技计划项目成果的基础上,跨部门协调国内顶尖的科研团队,发挥遥感技术优势,在全球、重点区域和国家等尺度上分析生态环境变化规律和驱动因子,编制年报并发布数据集。
年报工作汇集了国内从事相关领域研究的高水平科研人员和管理人员,组建了专家组和顾问组。专家组的职责是开展全球生态环境遥感监测工作的发展战略研究,制定长期的工作计划,提出生态环境监测指标选取建议,评估技术实施方案,对年报写作和数据生产进行全过程跟踪和学术指导;顾问组的职责是为年报工作的运行管理、年报定稿出版、数据发布提供全方位、高层次的咨询。
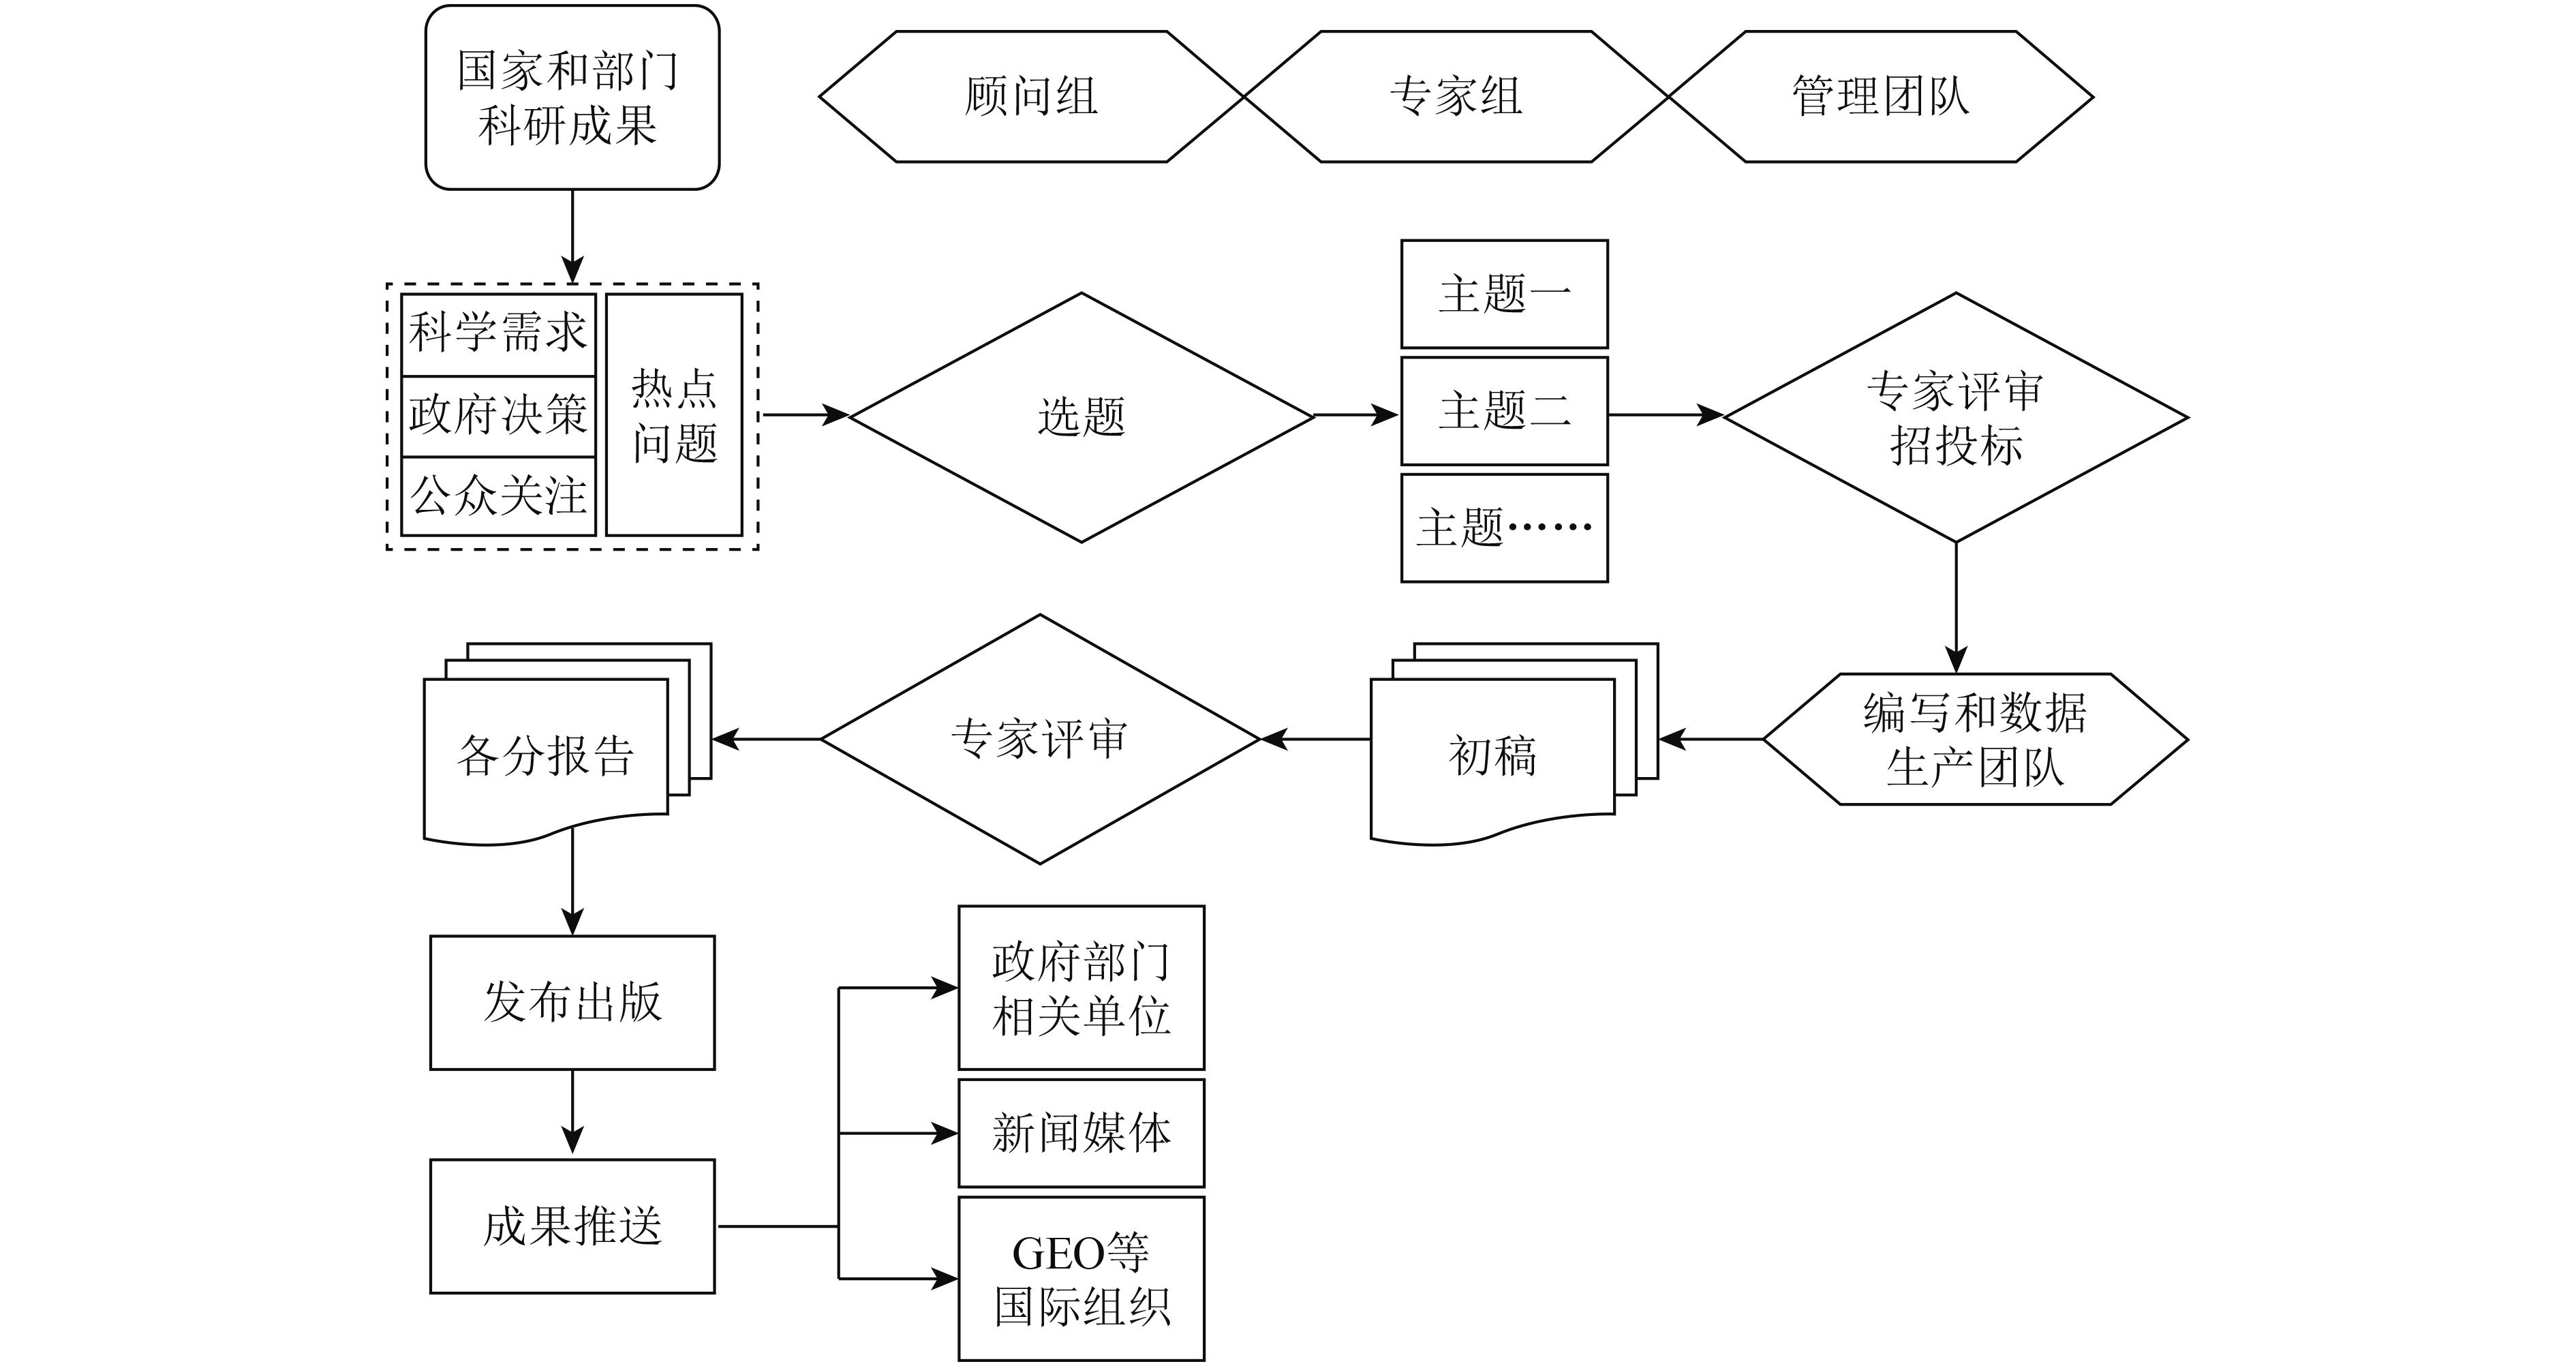
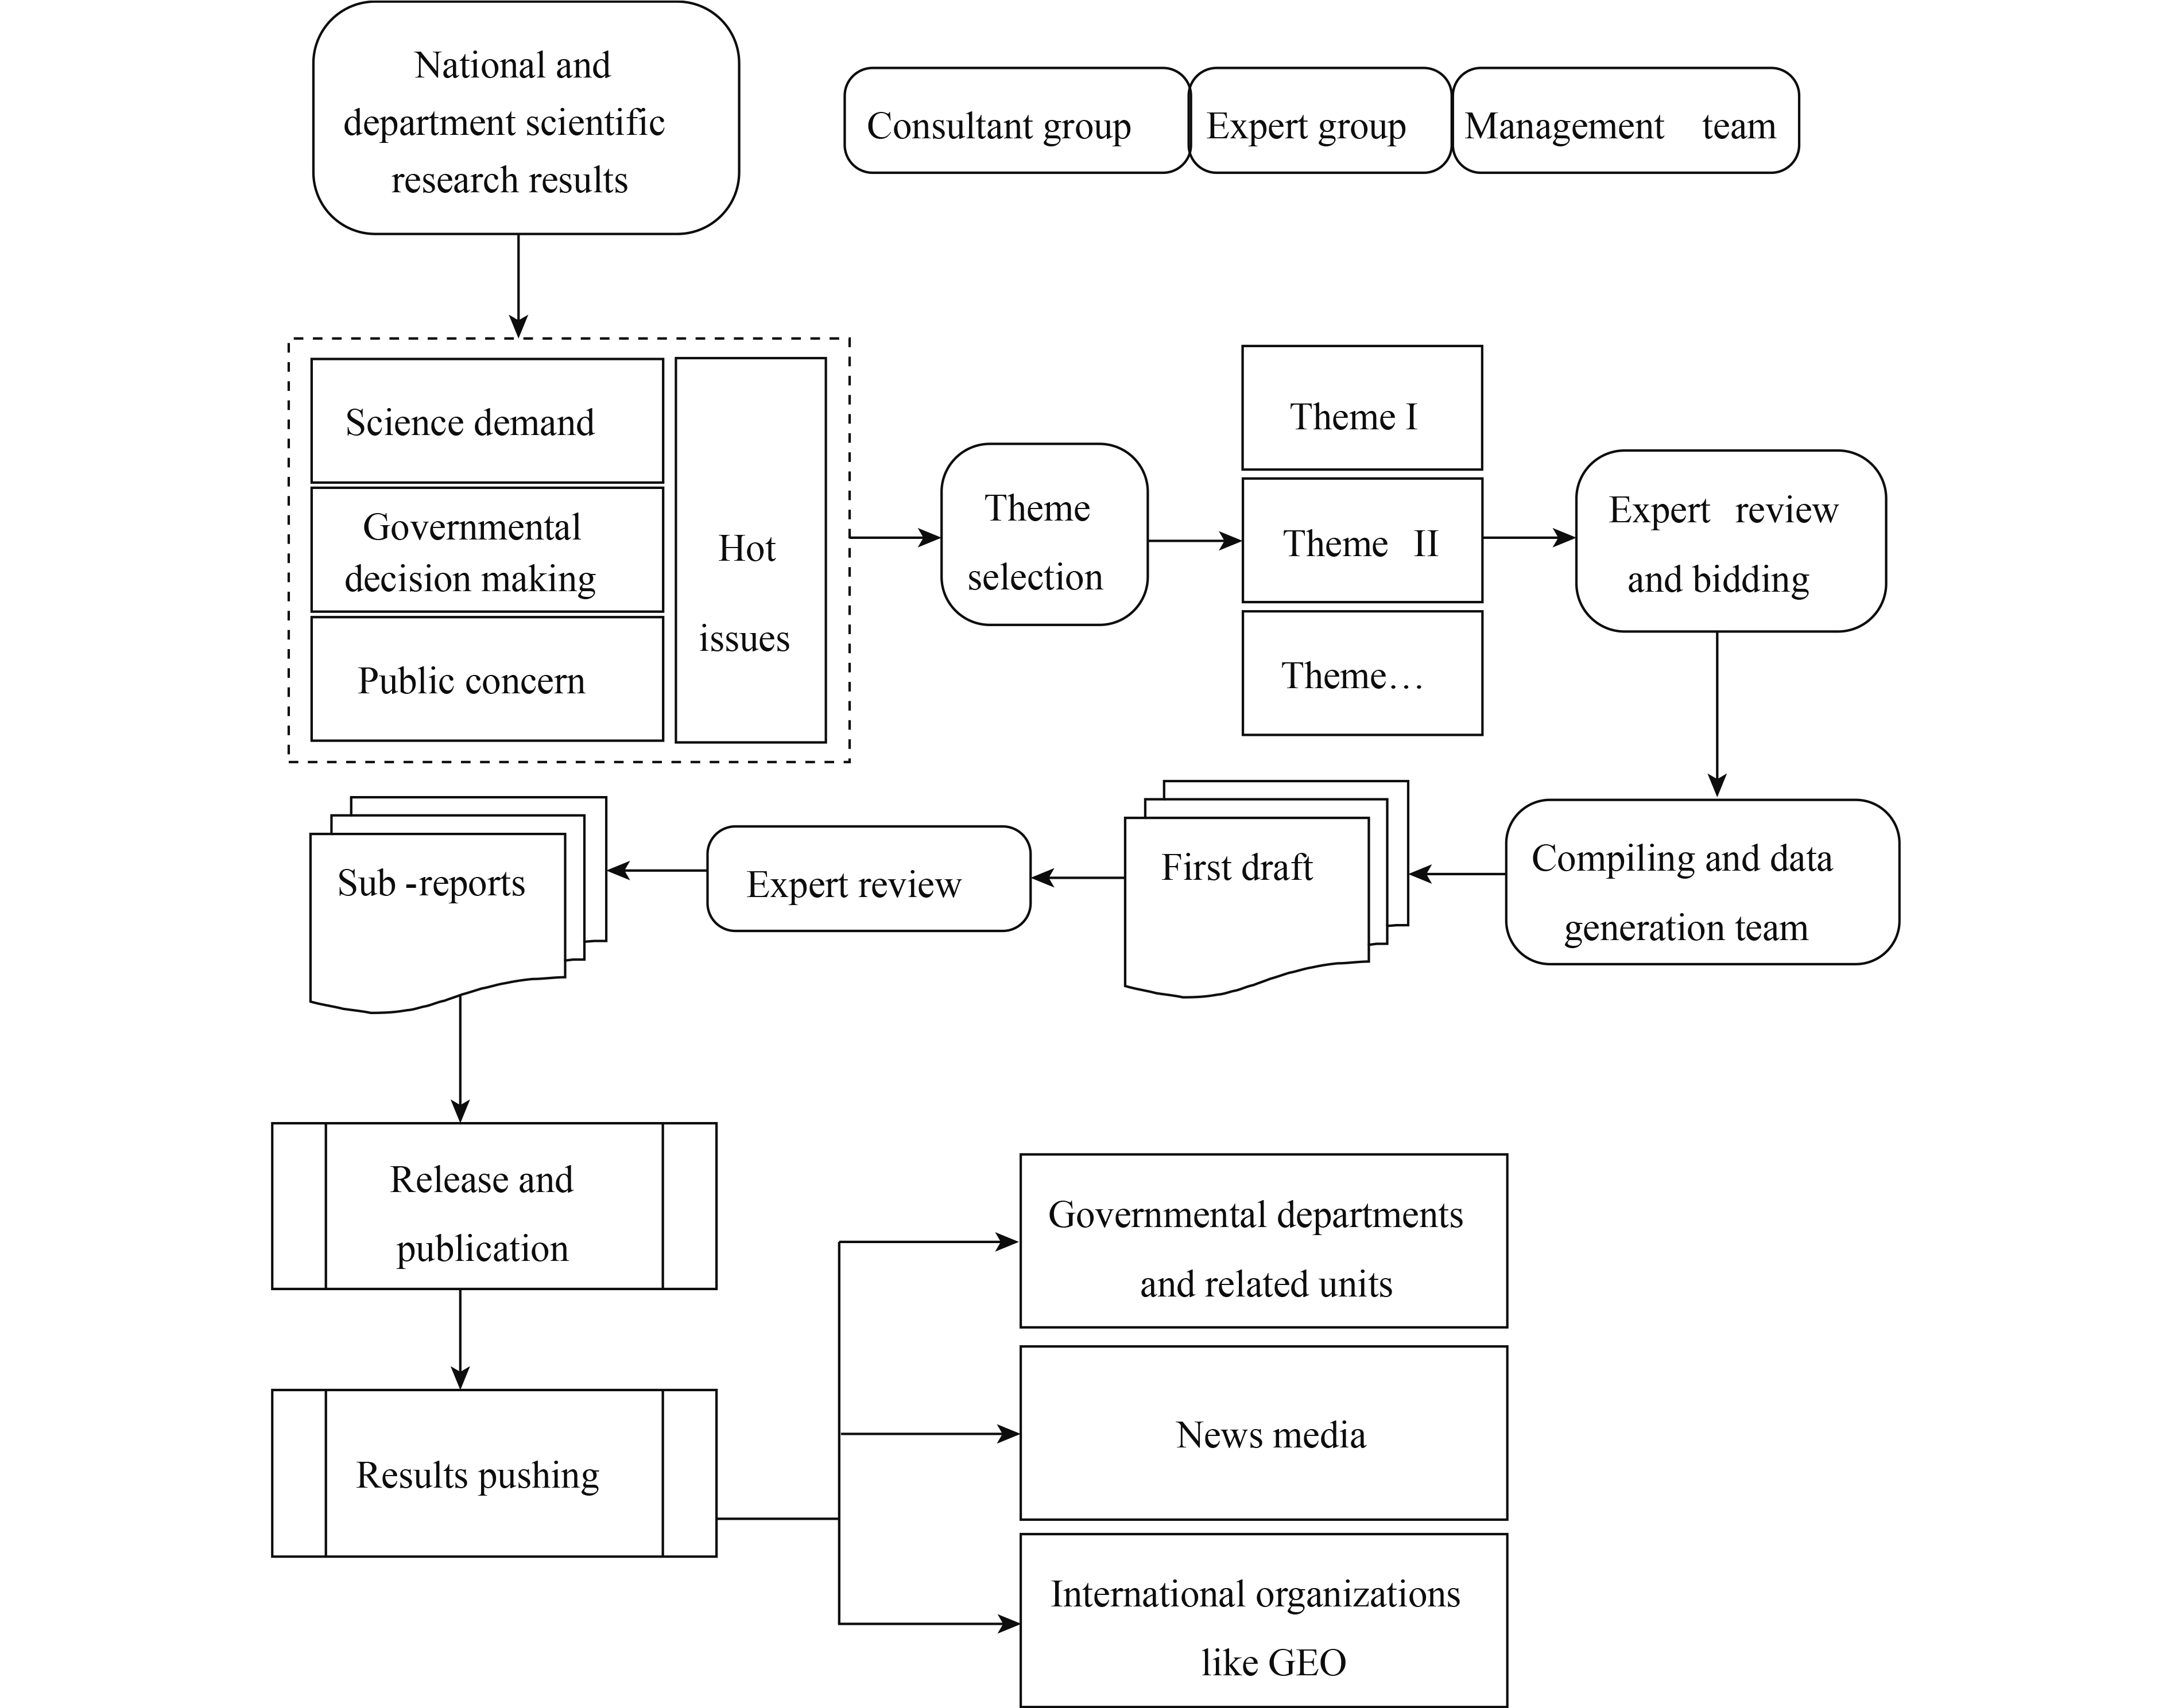
年报运行管理工作由选题、编写团队筛选、初稿修订、定稿发布、出版宣传等环节构成(图1)。“世界环境日”(6月5日)前后是年度报告和数据产品的发布日期,每期年报均在次年通过新闻发布会形式公开对外发布。为配合GEO工作,从2017年度报告开始,年报发布日期改为当年的9月。

3 历年年报回顾
2012年以来,年报相继聚焦于土地利用/土地覆盖、植被生长状态、作物产量、水域面积、建设用地分布、湿地保护等受到政府、科技界、公众广泛关注的领域。
3.1 2012年报
2012年报(廖小罕和施建成,2013)包括“陆表水域面积分布状况”和“陆地植被生长状况”共2个主题。
“陆表水域面积分布状况”主题基于遥感影像解译生成的全球2010年30 m分辨率陆表水域数据集及全球典型湖泊2001年—2011年500 m分辨率每8天动态监测数据集,定量地分析了全球及各大洲陆表水域的空间分布特征,并系统地统计了各国水域面积、水域率和水域率空间差异,剖析了全球7个典型湖泊在2001年—2011年的水面波动趋势。
“陆地植被生长状况”主题基于遥感影像解译生成的反映全球1982年—2011年共30年植被状况变化的叶面积指数遥感监测数据集,空间分辨率达1—5 km,时间分辨率为8天,对全球陆地植被背景状况(1982年—2011年植被生长的平均状态)、现状(2011年植被生长状况)及30年时空变化进行了分析,揭示了全球、各大洲、中国等不同尺度陆地植被的分布特征和变化趋势。
3.2 2013年报
2013年报(廖小罕和施建成,2014)包括“全球陆地植被生长状况”、“全球大型陆表水域面积时空分布”、“全球大宗粮油作物生产形势”和“全球城乡建设用地分布状况”共4个主题,以及“中国主要城市扩展”内部报告。
“全球陆地植被生长状况”和“全球大型陆表水域面积时空分布”主题是对2012年报的继承。继承性体现为在上年度陆地植被和水域面积监测成果的基础上,进一步分析全球植被生长变化对全球变化和重大事件的响应以及对全球水循环和供水安全更为重要的大型水体变化的监测。
“全球大宗粮油作物生产形势”主题以全球农情遥感监测系统(CropWatch)为基础,结合多源遥感与农业气象数据,对2013年度全球65个农业生态区的农业气象条件、全球7个农业主产区及中国7个农业分区粮油作物种植与胁迫状况、全球粮食产量与供应形势进行了遥感监测和分析,产量监测覆盖全球31个主产国,中国产量细化到主产省份,并对2014年全球粮油生产形势进行了展望。
“全球城乡建设用地分布状况”主题利用世界上第一套全球地表覆盖30 m分辨率遥感数据制图成果(GlobalLand 30),包括2000年及2010年两期,提取全球城乡建设用地的空间分布信息,进行空间格局解读与时空变化分析。具体分析内容包括2010年全球城乡建设用地空间分布现状、地域分布差异;2000年—2010年全球城乡建设用地变化量及分布;全球城乡建设用地空间分布与社会经济发展的关联分析与区域对比分析。
“中国主要城市扩展”内部报告利用1972年—2012年的遥感数据,选择中国60个城市开展了40年左右城市扩展过程的系统监测,监测对象为60个城市的中心建成区,反映了这些城市中心建成区在各时期的扩展过程、用地规模变化和占用耕地的情况。
3.3 2014年报
2014年报(廖小罕和施建成,2015)包括“大宗粮油作物生产形势”、“大型国际重要湿地”、“非洲土地覆盖制图”、“中国—东盟生态环境”共4个主题,在前两期年报发布的基础上有了进一步的继承和创新。继承性体现为继续关注2014年度全球大宗粮油作物生产形势,创新性体现为第一次针对重点地区开展生态环境遥感监测工作。此外,湿地作为气候变化和人类活动的重要影响和响应因子,也第一次列入年报监测工作。
“大型国际重要湿地”主题利用250 m分辨率的卫星遥感数据,对2001年和2013年全球100处大型国际重要湿地以及中国20处国际重要湿地的状况及变化进行了独立客观的评价,是中国首次、也是国际上第一次利用遥感技术在全球范围对大型国际重要湿地进行监测,体现了中国在保护国际重要湿地方面的贡献。
“非洲土地覆盖”主题在联合国环境规划署和美国联邦地质调查局的辅助以及包括南非在内的近20个非洲国家和组织的响应下,基于多种卫星遥感数据,建立了目前现势性最强的30 m分辨率的非洲土地覆盖数据库,并针对重点土地覆盖类型和重点区域的变化开展了监测。欧盟联合研究中心也参与了该项工作。
“中国—东盟区域生态环境状况”主题利用1 km空间分辨率遥感产品,对中国—东盟区域光、温、水条件与自然植被生长状态,以及森林、农田等典型植被生态系统特征进行了大尺度监测分析;利用30 m空间分辨率数据,对大湄公河次区域自然灾害及人类活动对植被生态系统的扰动进行了典型性分析;此外,还监测模拟了澜沧江—湄公河流域水资源状况。
3.4 2015年报
2015年报(李加洪和施建成,2016)包括“‘一带一路’生态环境状况”和“大宗粮油作物生产形势”2个主题。其中为响应中国政府关于“丝绸之路经济带”和“21世纪海上丝绸之路”的合作倡议,第一次针对“一带一路”覆盖区域开展生态环境遥感监测工作,而“大宗粮油作物生产形势”则继续关注2015年度的全球粮食产量与供应形势。
“‘一带一路’生态环境状况”主题秉承“一带一路”倡议提出的可持续发展和合作共赢理念,针对“一带一路”沿线区域,主要利用2014年国内外卫星遥感数据,系统地生成了监测区域陆域与海域现势性较强的土地覆盖、植被生长状态、农情、海洋环境等方面的31个生态环境遥感专题数据产品。根据上述数据产品,本专题就陆域7大区域、6个经济走廊及26个重要节点城市的生态环境基本特征、土地利用程度、约束性因素等,以及12个海区、13个近海海域和25个港口城市的生态环境状况进行了系统分析,取得了系列且非常有意义的监测结果。
3.5 2016年报与2017年报
2016年报与2017年报分别于2017年6月和9月对外公开发布。2016年报包括“大宗粮油作物生产形势”1个主题,以及“‘一带一路’陆路交通与重要经济区生态环境状况”和“‘一带一路’重点区域水资源状况”两个内部报告;2017年报包括“‘一带一路’生态环境状况”和“全球重大灾害对陆地植被影响分析”共两个主题。作物生产形势和“一带一路”主题以及内部报告是前期工作的延续和深化。
“全球重大灾害对陆地植被影响分析”主题利用1982年—2015年的叶面积指数、植被覆盖度、总初级生产力、土地覆盖、反照率等遥感反演产品,选择全球范围内曾产生重大影响的灾害案例进行典型性分析,研究历史上全球旱灾、洪灾、森林火灾、地震等重大灾害的植被响应,以及灾后植被恢复状况和生态系统演替规律。
4 后续工作展望
年报工作在专家队伍建设、管理人才培养、业务流程建立、编写队伍组织等方面取得了丰富的经验。迄今为止,年报编写从内部指派转为公开招标,年报发布从次年发布转为当年发布,历经多次改革,正逐步走向成熟。今后需要进一步在年报选题规划、国产遥感数据应用、成果共享与宣传等方面加强工作。
4.1 明确选题原则、加强战略研究
根据年报工作开展的经验,确立如下选题思路:
(1)重视全球和区域分析,不考虑只局限于中国的主题;
(2)重视多因子综合分析,对单因子分析选题要慎重;
(3)重视地学规律性分析,不能只做遥感参数反演;
(4)重视决策层和大众关心的热点问题;
(5)满足科技部工作的需求,加强与GEO工作的协调。
年报选题依据可以概括为3个方面:
(1)重要主题。针对政府、企业以及全球各国对能源、矿产、森林、水、粮食、湿地等自然资源亟需了解的需求,围绕某一重要主题(如,陆地植被生长状况、陆表水域面积分布状况,和大宗粮油作物生产形势等),分析能源、矿产、森林、水、粮食、湿地等自然资源的生态环境、时空分布和发展形势等状况。
(2)热点区域。从辅助政府制定政策和实施规划的角度,针对热点区域开展全球生态环境遥感监测工作(如,非洲土地覆盖制图和中国-东盟生态环境),分析区域生态环境和自然资源的时空变异,以及人类活动和气候变化对区域生态环境带来的影响。
(3)热点事件。为满足生态文明建设、新型城镇化、智慧城市和“走出去”、“一带一路”等国家战略的需要,针对某一热点事件开展生态环境遥感监测工作(如“一带一路”生态环境状况),围绕这些国家关注的热点事件开展生态环境状况的监测和分析,重点评估区域生态环境状况对国家战略实施可能带来的影响。
年报工作是一项长期的任务,需要加强对年报发展的战略性研究,通过综合咨询、比较分析,明确需要遥感监测的全球生态环境因子和重点区域,及时跟进制订未来几年的年报工作规划。同时,通过GEO平台,开展国际合作,在全球范围内对现有数据产品开展广泛的验证与完善。
4.2 重视国产卫星数据应用
相比于常用的国外卫星数据,国产卫星数据在数据精度、可靠性、尤其是系列化和易获取性方面存在一定的差距。在已发布的年报中,国产卫星数据的使用率不到20%,这与中国作为航天遥感大国的身份很不匹配,也限制了年报所应有的特色和国际影响力。
国家遥感中心将通过“小核心,大网络”运行模式,调动联系的业务部,尤其是具有接收、处理、分发国产卫星数据的单位,积极为年报工作提供相关遥感数据,鼓励年报编写和产品生产队伍使用国产卫星数据,提高使用率,促进气象、资源、环境、海洋、高分等国产系列卫星事业的发展。
4.3 加强年报工作宣传与成果共享
年报和相关数据集产品均提供网络在线服务,发布地址:国家遥感中心门户网站(http://www.nrscc.gov.cn[2018-02-02])、国家综合地球观测数据共享平台(http://www.chinageoss.org[2018-02-02])和中国搜索门户网站(http://www.chinaso.com[2018-02-02])。
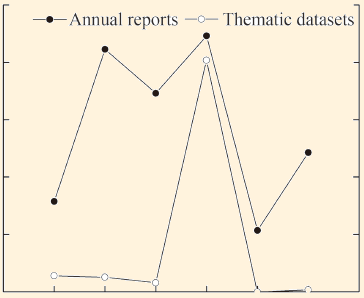
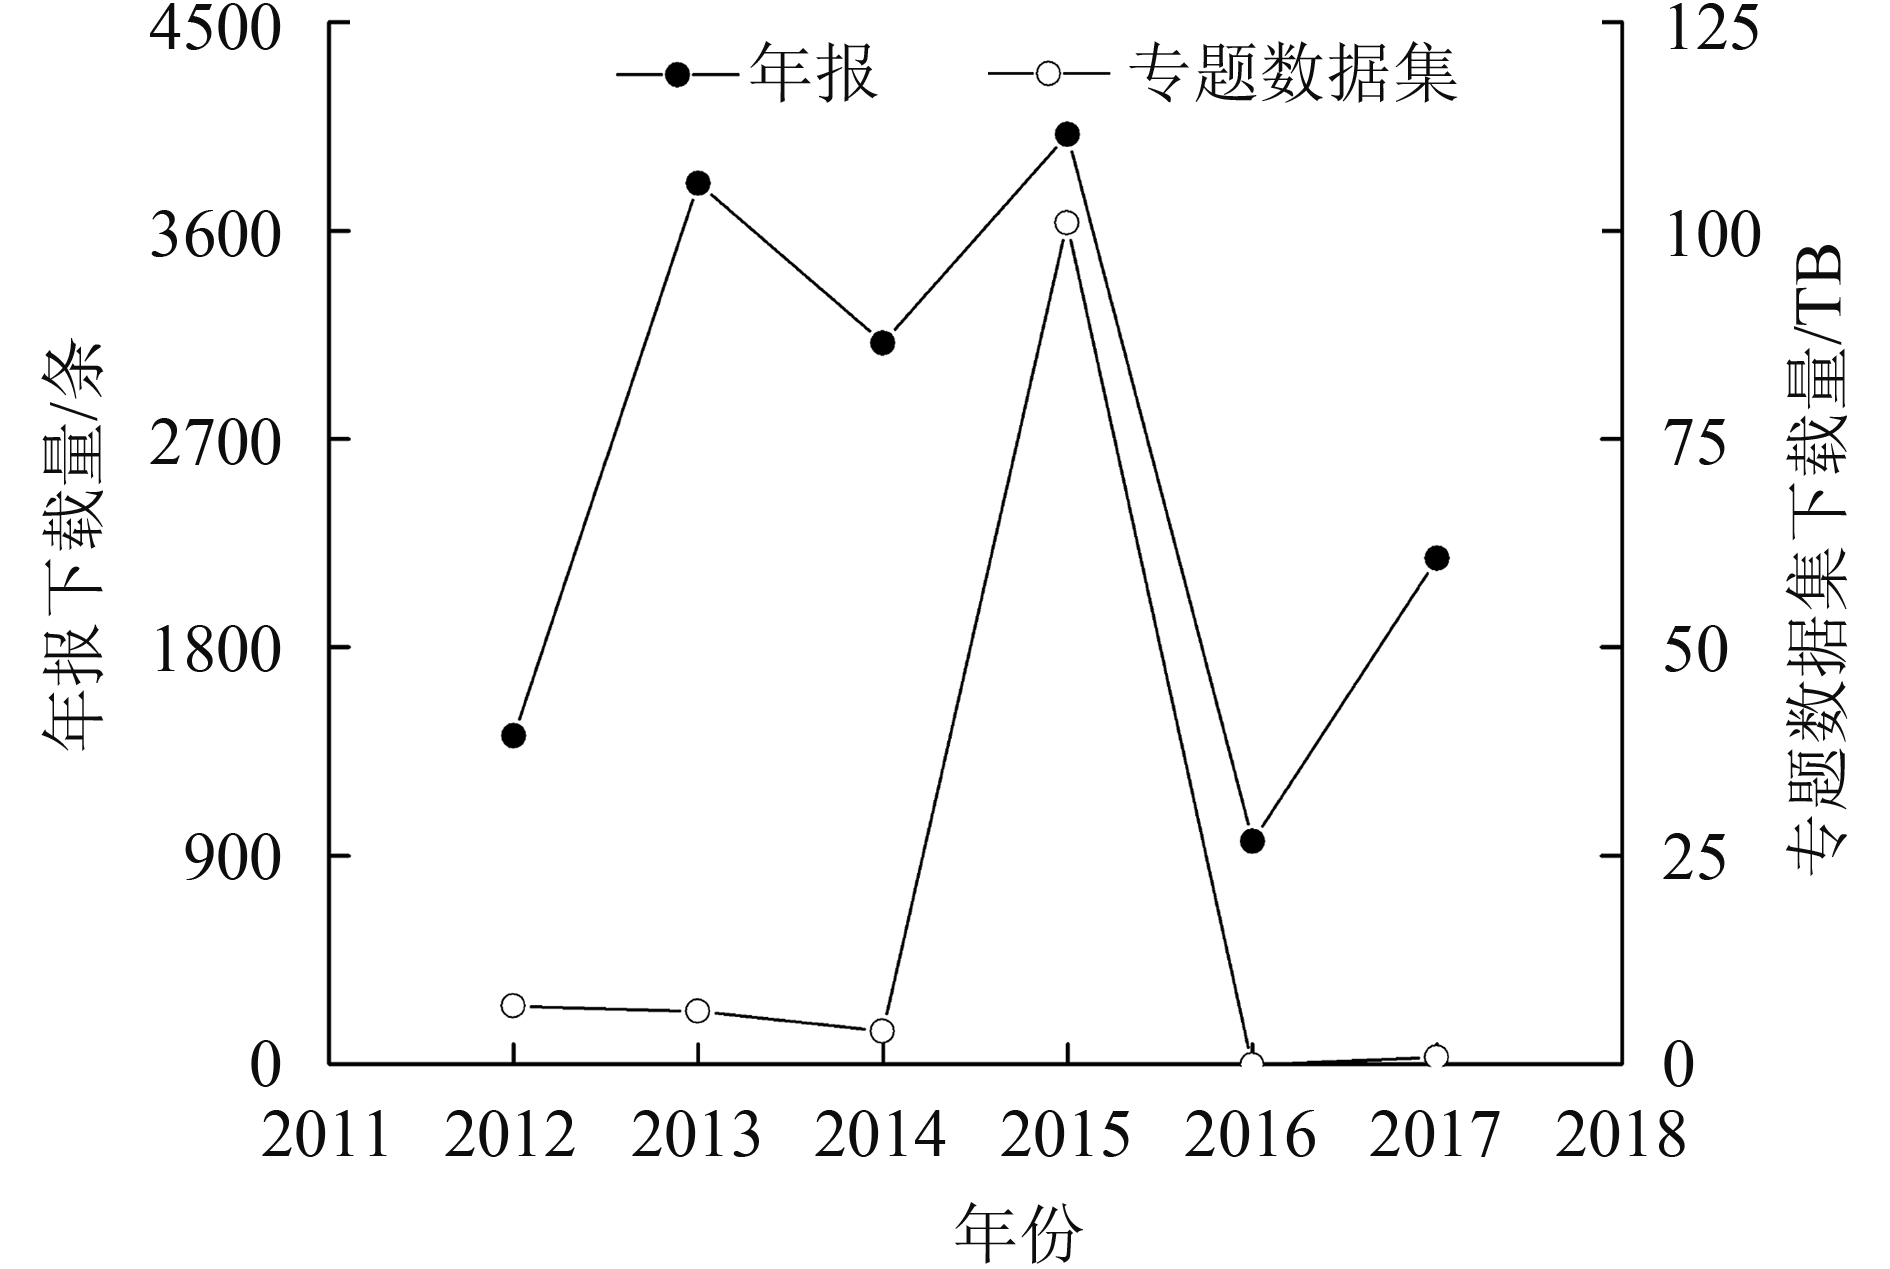
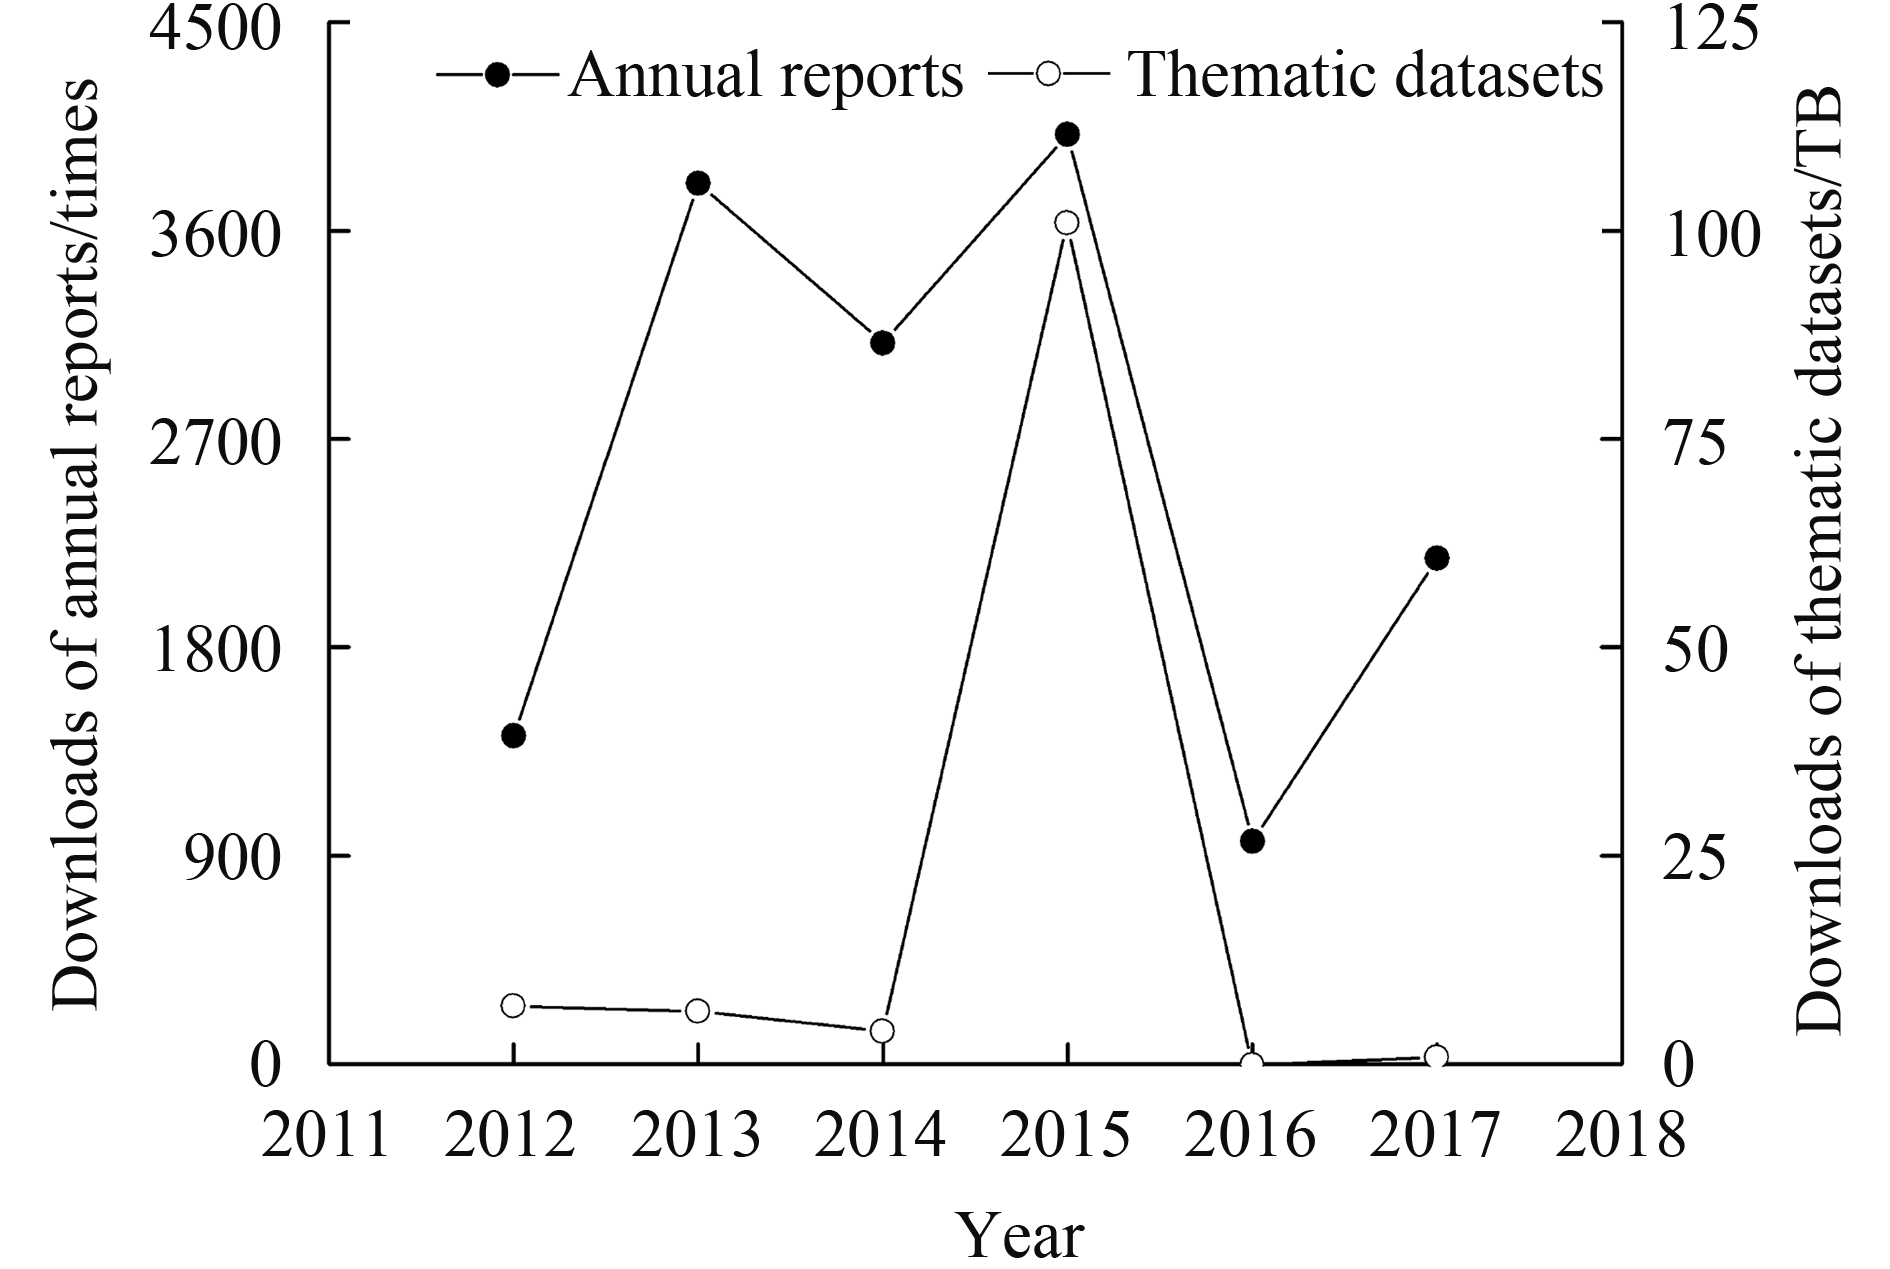
年报在国内外已产生了积极影响,引起了业界、公众及媒体的广泛关注。截至2018年1月31日,年报下载量就接近16000余次,专题数据集下载量超过120 TB。已经发布的6期年报中,2015年年报的下载量最大,其次是2013年(图2)。基于年报相关的数据集,发表国际期刊论文10篇,他引25次。年度报告工作在国际上也引起了广泛反响,粮农组织、亚太经社会、环境规划署等联合国相关机构均表示了关注,GEO秘书处主任Barbara J. Ryan来函感谢,高度评价了中国发布的年度报告在农业、生物多样性、土地覆盖、水资源的全球性调查方面作出的重要贡献。人民日报、光明日报、经济日报、科技日报、中央电视台等国家级媒体,以及新华网、中国搜索、中国科技网、新浪微博等新媒体对年报内容都曾进行深入报道和专家解读。
今后将进一步关注年报引用情况和数据产品使用分析情况,并借助国内外各种学术或公众场合宣讲年报的特点和侧重点。同时,扩大年报选题范围,充实编写后备力量,积极与国家遥感中心各业务部联系,请他们推荐和报送年报相关选题和编写队伍;与承担过科技部遥感项目的科研队伍直接联系,希望他们支持年报工作。
5 结 论
(1)年报第一次在全球生态环境遥感监测领域向世界发出了中国的声音。年度报告内容对于全球生态与粮食安全和环境政策制定等具有重要参考价值,是中国遥感科技领域对全球生态环境研究的实质贡献,是中国参与全球问题研究的重要一步。
(2)编制并发布《全球生态环境遥感监测年度报告》是国家遥感中心和遥感科学国家重点实验室的一项重要常规性工作,将长期、持续地开展下去,为此需要加强有针对性的战略研究,根据国家发展战略和科学研究需要,及时更新调整规划。
(3)拓展渠道,加强媒体宣传和科普传播力度,扩大年报影响力,促进数据产品共享,提高国产卫星数据使用率。通过国际合作渠道,在GEO框架下推广年报和数据产品。
(4)促进国家科技项目与年报工作对接。
1 INTRODUCTION
Human survival and development depend on the global ecosystem and environment. These factors are influenced by global climate change, ecosystem change, and human activity. Hence, sustainable economic and social developments are of significant importance to the international society (Siepielski, et al., 2017; Craw, et al., 2016). Satellite-based remote sensing techniques have unique advantages in monitoring the global ecosystem and environment. These methods can accurately measure environmental elements and monitor their changes at the global, national, and regional levels (Stavrakou, et al., 2011; Xu, et al., 2016).
With the increasing severity of global eco-environmental problems, remote sensing monitoring of the global ecological environment has been gaining considerable attention from the international community (Murray, et al., 2018; Turpie, et al., 2015; Fernández, et al., 2010). With the continuous advancement of technology, the role of satellite remote sensing in global environmental monitoring is becoming increasingly prominent. The overall trends are as follows: (1) satellite remote sensing data sources have increased; (2) the global ecological environment has been monitored from a single element to multiple factors; (3) the monitoring scale has gradually expanded from regional to global (Yue, et al., 2018; Kim, et al., 2017; Brown, et al., 2017). China has significantly progressed after 30 years of work on earth observation. The establishment of Earth observation satellites, such as in meteorology, resources, environment, oceans, Gaofen, and the application system, has provided a solid foundation for the remote sensing monitoring of the global ecological environment (Meng, et al., 2017; Chen, et al., 2005; Li, 2001).
Since February 2012, the Ministry of Science and Technology (China) has deployed a remote sensing system to monitor the environment and devised an annual reporting system. In 2012—2017, six annual reports were published and publicized. In 2012—2014, the annual reports were named Annual Report on Remote Sensing Monitoring of the Global Ecosystem and Environment. In 2015, the title was modified to Global Ecosystems and Environment Observation: Annual Report from China (GEOARC). The annual report has become a key contribution of China to the Group on Earth Observations (GEO) and an important gauge of technological development in global earth observation.
2 ORGANIZATION OF ANNUAL REPORTING WORK
The annual reporting work is organized by the National Remote Sensing Center (Secretariat of GEO in China) at the Ministry of Science and Technology. Report operation and management are facilitated by the State Key Laboratory of Remote Sensing Science. China’s top scientific research teams perform multidisciplinary work and use their achievements from related national science and technology planning projects to exploit the advantages of remote sensing technologies. Eco-environmental changes and their driving factors are analyzed at the global, national, and regional levels, and the annual reports and datasets are published. Annual reporting work requires the collaboration of China’s top scientific researchers and administrators from relevant fields and the creation of groups of experts and consultants. The expert group studies development strategies for the remote sensing monitoring of the global ecosystem and environment, formulates long-term work plans, proposes for ecosystem and environmental monitoring, evaluates technical implementation schemes, and provides overall tracking and academic guidance for annual report writing and data production. The consultant group offers comprehensive high-level consultation for the conduct and management of annual reporting and finalizes and publishes the annual reports and associated data.
Annual reporting work involves several tasks, such as theme selection, compiling team screening, first draft revision, final draft release, and publication and distribution (Fig. 1). The annual reports and data products were originally released on or before World Environment Day (June 5), and each annual report was publicly released in the following year during a press conference. To coordinate with the work of the GEO, the annual report release date was changed in 2017 to September.
3 REVIEW OF ANNUAL REPORTS IN PAST YEARS
Since 2012, the annual report has focused on fields of interest to the government, scientific and technological circles, and the public, such as land use/land cover, vegetation growth status, crop yield, water area, construction land distribution, and wetland protection.
3.1 2012 annual report
The 2012 annual report (Liao & Shi, 2013) included two themes, namely, (1) global land surface water in 2010 and dynamic changes of sample lakes in 2001—2011 and (2) dynamics of global vegetation Leaf Area Index (LAI) from 1982 to 2011.
Data for the theme “land surface water area distribution” were based on global 30 m resolution land surface water area datasets from 2010. These datasets were derived from remotely sensed images and 500 m resolution dynamic monitoring datasets of typical lakes around the world made every eight days during 2001—2011. The spatial distribution of terrestrial surface water areas on the major continents was quantitatively analyzed. Water areas, land proportion covered by water, and international differences in these variables were calculated. The water surface fluctuations of seven typical lakes were analyzed over 2001—2011.
The theme “terrestrial vegetation growth status” used 30 years (1982—2011) of LAIs derived from remotely sensed images to monitor changes in vegetation status. The spatial resolution was 1—5 km, and the temporal resolution was eight days. Global terrestrial vegetation background levels (average vegetation growth during 1982—2011), current status (in 2011), and 30-year temporal–spatial changes were analyzed. The distribution and variation of terrestrial vegetation were assessed at the global, continental, and domestic (Chinese) levels.
3.2 2013 annual report
The 2013 annual report (Liao & Shi, 2014) included four themes, namely, (1) growth conditions of global terrestrial vegetation, (2) large terrestrial surface water areas, (3) supply situation of maize, rice, wheat, and soybean, and (4) urban and rural resident land cover distributions between 2000 and 2010. This report also included an internal report on the expansion of major cities in China.
The themes “growth conditions of global terrestrial vegetation” and “large terrestrial surface water areas” used data from the 2012 annual report. The response of global vegetation growth to global climate change and major events, and the change monitoring of large-scale water bodies that were important to the global water supply were analyzed. These processes were based on monitoring results from the previous year regarding terrestrial vegetation and land water areas.
The theme “supply situation of maize, rice, wheat, and soybean” was based on (1) remote sensing monitoring and analysis of agro-meteorological data from 65 global agro-ecological regions, (2) crop plantation and stress status in seven main global agricultural production areas and seven agricultural sub-areas in China, and (3) the 2013 global grain yield and supply. The third factor was based on a remote sensing monitoring system for global agricultural conditions (CropWatch) and multisource remote sensing and agro-meteorological data. Yield monitoring covered 31 main global production countries. Yields in China were categorized according to the main producing provinces. Global crop and oil production for 2014 was estimated.
The theme “urban and rural resident land cover distribution between 2000 and 2010” used 30 m resolution remote sensing data from 2000 and 2010. Global spatial distribution data for urban–rural construction land were extracted for the interpretation of spatial layout and analysis of temporal–spatial changes. The analysis included the spatial distribution status and regional distribution differences in global urban–rural construction land in 2010, variability in the quantity and distribution of global urban–rural construction land during 2000—2010, relationships between the spatial distribution of global urban–rural construction land and socioeconomic development, and comparative analyses among regions.
Remote sensing data obtained from 1972—2012 were used for an internal report on the “expansion of major cities in China”. This report monitored the urban expansion in the central built-up areas of 60 Chinese cities over 40 years. Expansion processes, changes in land use scale, and occupation of arable land were assessed in these cities over different periods.
3.3 2014 annual report
The 2014 annual report (Liao & Shi, 2015) included four themes, namely, (1) supply situation of maize, rice, wheat, and soybean, (2) large area wetlands of international importance, (3) Africa land cover, and (4) China–ASEAN ecological and environmental conditions. Themes from the two previous annual reports were used to provide innovative information. This was used to address the ongoing concern about the production of global staples grain and oil crops in 2014. An innovative addition to the 2014 report was the use of eco-environmental remote sensing monitoring of key regions. Wetlands were included in the annual report’s monitoring work for the first time because they are important responders to climate change and human activity.
The theme “large area wetlands of international importance” used 250 m resolution satellite remote sensing data to independently and objectively evaluate 100 important large-scale wetlands and report the status and changes of 20 internationally important wetlands in China in 2001 and 2013. For China and potentially the world, this report was the first to use remote sensing technology to perform large-scale monitoring of internationally important wetlands at the global level. This achievement allowed China to contribute to the protection of internationally important wetlands.
The United Nations Environment Program (UNEP), United States Geological Survey, and approximately 20 African countries and organizations, including South Africa, assisted in the reporting on the theme “Africa land cover”. This theme used a 30 m resolution African land cover database derived from multiple types of satellite remote sensing data to assess the present situation. Changes in key land cover types and key regions were monitored. The Joint Research Center of the EU also participated in this work.
The theme “China–ASEAN ecological and environmental conditions” used 1 km resolution remote sensing products to conduct a large-scale analysis of light, temperature, water conditions, natural vegetation growth status, and ecosystem features of typical vegetation types (such as forest and farmland) in the China–ASEAN region. Data with 30 m resolution were used for a typicality analysis of the ecosystem disturbance caused by natural disasters and human activities in the Greater Mekong subregion. In addition, the water resource situation of the Lantsang-Mekong Basin was monitored and simulated.
3.4 2015 annual report
The 2015 annual report (Li & Shi, 2016) included two themes, namely, (1) “The Belt and Road Initiative” ecological and environmental conditions and (2) supply situation of maize, rice, wheat, and soybean. To respond to the Chinese government’s cooperative initiatives “economic belt of the Silk Road” and “the Maritime Silk Road in the 21st Century”, eco-environmental remote sensing monitoring was conducted on areas covered by “The Belt and Road Initiative.” The theme “supply situation of maize, rice, wheat, and soybean” addressed the global grain yield and supply situation in 2015.
The theme “‘The Belt and Road Initiative’ ecological and environmental conditions” reported on the concepts of sustainable development and cooperative “win–win”, which were proposed in “The Belt and Road Initiative”. Domestic (Chinese) and foreign satellite remote sensing data were mainly used on the areas along “The Belt and Road”, and 31 spatial data products on the eco-environmental remote sensing of land cover, vegetation growth status, agricultural conditions, and marine environment were produced. According to the above data products, this theme provided a systematic analysis of basic eco-environmental features; land usage rates; and constraints in seven major areas, six economic corridors, and 26 important node cities. In addition, the eco-environmental status of 12 coastal areas, 13 offshore areas, and 25 port cities was reviewed, and a series of significant monitoring results was obtained.
3.5 2016 and 2017 annual reports
The 2016 and 2017 annual reports were publicly released in June and September 2017, respectively. The 2016 annual report included one theme, namely, “supply situation of maize, rice, wheat, and soybean, ” and two internal reports, namely, (1) “‘The Belt and Road’ land transportation and eco-environmental conditions in important economic zones” and (2) “situation of water resources in key ‘The Belt and Road’ areas”. The 2017 annual report included two themes, namely, (1) “‘The Belt and Road Initiative’ ecological and environmental conditions” and (2) “the impacts of global natural disasters on vegetation”. Crop production status, “The Belt and Road” theme, and internal reports were considered developments of previous work.
The theme “the impacts of global natural disasters on vegetation” mainly used remote sensing inversion products, such as LAI, vegetation coverage, gross primary productivity, and surface albedo, during 1982—2015. Disasters that caused major effects within a global scope were selected for a typicality analysis. Historical vegetation responses to major disasters, such as global droughts, floods, forest fires, and earthquakes; post-disaster vegetation recovery; and ecological succession patterns were investigated.
4 PROPOSED FOLLOW-UP WORK
Excellent progress has been achieved in the construction of expert teams, management talent cultivation, establishment of business processes, and the coordination of teams and organizations in annual reporting work. To date, the annual reporting process has been transformed from internal assignation to open tender. Annual reports are now released in the same year as finalization (i.e., the 2015 report was released in 2015) rather than the following one. These processes have gradually matured after multiple reforms. Annual report theme planning, the application of domestic remote sensing data, and the sharing and distribution of results should be improved.
4.1 Confirming theme selection principles and strengthening strategic studies
According to our experience in annual reporting work, the following theme selection concepts are identified.
(1) Emphasize global and regional analyses rather than restricting themes to China.
(2) Attach importance to comprehensive multifactorial analyses, and be cautious of themes that depend on single-factor analyses.
(3) Use geoscientific analysis regularly rather than conducting only an inversion of remote sensing parameters.
(4) Highlight “hot” issues that attract the attention of decision makers and the public.
(5) Satisfy the working requirements of the Ministry of Science and Technology, and strengthen coordination with the GEO.
The topic selection of the annual report can be summarized in three aspects as follows.
(1) Important theme. With focus on the urgent needs of the government, enterprises, and countries for energy, minerals, forests, water, food, wetlands, and other natural resources, environmental conditions, temporal–spatial distribution, and the development trend of natural resources should be analyzed on the basis of important themes (e.g., land vegetation growth status; land surface water area distribution; and supply situation of maize, rice, wheat, and soybean, etc.).
(2) Hotspot regions. From the perspective of supporting the government in formulating policies and planning implementation, remote sensing monitoring work for the global ecological environment should focus on hotspot regions (e.g., Africa land cover and China–ASEAN ecological and environmental conditions). The temporal–spatial variability of the regional ecological environment and natural resources and the impact of human activities and climate change on regional ecological environment should be analyzed in these regions.
(3) Hot issues. To meet the requirements of ecological civilization construction, new urbanization, smart cities, and national strategy, such as “Going Out” and “The Belt and Road Initiative”, remote sensing monitoring work should pay considerable attention to hot issues (e.g., ecological environmental conditions of “The Belt and Road”). Environmental condition monitoring and analysis should be conducted on hot issues that countries are concerned about. Meanwhile, the possible influence of regional ecological environments on the implementation of national strategies should be assessed in detail.
Annual reporting is a long-term task. The strategic development of annual reporting should be strengthened. Global eco-environmental factors and key areas that require remote sensing monitoring are confirmed through comprehensive consultations and comparative analyses. Future annual reporting work should be promptly followed up. Meanwhile, extensive verification and completion of existing data products are implemented within a global scope.
4.2 Importance of domestic satellite data application
A gap exists between domestic satellite data and commonly used foreign satellite data in terms of data accuracy, reliability, serialization, and availability. In the currently released annual reports, the usage rate of domestic satellite data is less than 20%, which does not match China’s identity as a major satellite remote sensing country. This finding also restricts the quality and international influence of the annual reports.
The National Remote Sensing Center mobilizes business departments, especially units that receive, process, and dispatch domestic satellite data, to actively provide relevant remote sensing data for annual reporting work under the “small core and large network” operating pattern. This process encourages the annual report compiling and production teams to use domestic satellite data and improve the development of domestic satellite-based data used in such areas as meteorology, resources, environment, ocean, and Gaofen.
4.3 Strengthening the promotion of annual reporting and sharing of results
The annual reports and related datasets are provided through the National Remote Sensing Center (http://www.nrscc.gov.cn[2018-02-02]), the national comprehensive earth observation data sharing platform (http://www.chinageoss.org[2018-02-02]), and the Chinaso web portal (http://www.chinaso.com[2018-04-08]).
Annual reporting has generated positive effects locally and globally and attracted extensive attention from the industry, the public, and the media. The annual reports had been downloaded approximately 16000 times by the end of January 31, 2018, and downloads of the thematic datasets have exceeded 120 TB. Among the six annual reports that have been issued, the 2015 annual report has the largest number of downloads, followed by the 2013 annual report (Fig. 2). On the basis of the relevant datasets, 10 papers have been published in international journals and cited 25 times. Annual reporting work has also raised extensive international interest. Related EU organizations, such as the FAO, ESCAP, and UNEP have shown interest in this work. The director of the GEO Secretariat, Barbara J. Ryan, wrote a letter expressing her gratitude and praised the important contributions made by China’s annual reports to the global investigations of agriculture, biodiversity, land cover, and water resources. National media outfits, such as People’s Daily, Guangming Daily, Economic Daily, Science, Technology Daily, and CCTV, and new media, such as Xinhuanet, chinaso.com, stdaily.com, and Sino MicroBlog, have reported the contents of the annual reports in detail and provided informed interpretations.
FConsiderable attention will be paid to the quotation of annual reports and use and analysis of data products. Features of the annual reports will be emphasized in the academic and public scenes locally and globally. Meanwhile, the range of selected themes for the annual reports will be expanded, and the reserve force of compilers will be strengthened. Active contacts will be established with the business departments of the State Remote Sensing Center to enable them to make theme recommendations and join compiling teams. Direct contact will be established with scientific research teams involved in remote sensing projects at the Ministry of Science and Technology with the vision that they can support the annual reporting work.
5 CONCLUSIONS
(1) Annual reporting has allowed China to communicate worldwide regarding global eco-environmental remote sensing monitoring. The annual reports offer significant value to the global ecology and grain safety issues and the formulation of environmental policies. These reports constitute China’s main remote sensing contribution to global eco-environmental studies. Moreover, the annual reports are an important step made by China in participation in studies of global problems.
(2) Compiling and releasing the Annual Report on Remote Sensing Monitoring of the Global Ecosystem and Environment comprise important routine work conducted by the National Remote Sensing Center and State Key Laboratory of Remote Sensing Science and will be continuously conducted. Therefore, certain strategic studies should be strengthened, and adjustment plans should be appropriately updated according to national development strategies and scientific research demands.
(3) The channel will be broadened, media publicity and popularization of science will be reinforced, and the influence of the annual reports will be expanded to promote data product sharing and improve the usage rates of domestic satellite data. The annual reports and data products will be promoted under the GEO framework.
(4) National science and technology projects will be closely related to annual reporting work.
参考文献(References)
-
Brown L A, Dash J, Ogutu B O, Richardson A D. 2017. On the relationship between continuous measures of canopy greenness derived using near-surface remote sensing and satellite-derived vegetation products. Agricultural & Forest Meteorology, 247 : 280–292.
-
Chen J M, Menges C H, Leblanc S G. 2005. Global mapping of foliage clumping index using multi-angular satellite data. Remote Sensing of Environment, 97 (4): 447–457. [DOI: 10.1016/j.rse.2005.05.003]
-
Craw D, Upton P, Burridge C P, Wallis G P, and Waters J M. 2016. Rapid biological speciation driven by tectonic evolution in New Zealand. Nature Geoscience : 140–145.
-
Fernández N, Paruelo J M, Delibes M. 2010. Ecosystem functioning of protected and altered mediterranean environments: a remote sensing classification in doñana, spain. Remote Sensing of Environment, 114 (1): 211–220. [DOI: 10.1016/j.rse.2009.09.001]
-
Kim H, Parinussa R, Konings A, Wagner W, Cosh M, Choi M. 2017. Global-scale assessment and combination of smap with ascat (active) and amsr2 (passive) soil moisture products. Remote Sensing of Environment, 204 : 260–275.
-
Li De-ren. 2001. Discussion on earth observation and geographic information system. Advance in Earth Science, 16 (5): 689–703.
-
(Li J H, and Shi J C. 2016. Global ecological environmental remote Sensing monitoring 2015 annual report. Science Press)
-
(Liao X H, and Shi J C. 2013. Global ecological environmental remote Sensing monitoring 2012 annual report. Science Press)
-
(Liao X H, and Shi J C. 2014. Global ecological environmental remote Sensing monitoring 2013 annual report. Science Press)
-
(Liao X H, and Shi J C. 2015. Global ecological environmental remote Sensing monitoring 2014 annual report. Science Press)
-
Meng X, Cheng J, Liang S. 2017. Estimating land surface temperature from feng yun-3c/mersi data using a new land surface emissivity scheme. Remote Sensing, 9 (12):
-
Murray N J, Keith D A, Bland L M, Ferrari R, Lyons M B, Lucas R, Pettorelli N and Nicholson E. 2018. The role of satellite remote sensing in structured ecosystem risk assessments. Science of the Total Environment, 619-520 : 249–257.
-
Siepielski A M, Morrissey M B, Buoro M, Carlson S M, Caruso C M, Clegg S M, Coulson T, DiBattista J, Gotanta K M, Francis C D, Hereford J, Kinqsolver J G, Auqustine K E, Kruu L E, Martin R A, Sheldon B C, Sletvold N, Svensson E I, Wade M J and Mac Coll A D. 2017. Precipitation drives global variation in natural selection. Science, 355 (6328): 959–962. [DOI: 10.1126/science.aag2773]
-
Stavrakou T, Müller J, Peeters J, Razavi A, Clarisse L, Clerbaux C, Coheur P F, Hurtmans D, Mazière M, Vigouroux C, Deutscher N M, Griffith D W T, Jones N and Paton-Walsh C. 2011. Satellite evidence for a large source of formic acid from boreal and tropical forests. Nature Geoscience, 5 (1): 26–30. [DOI: 10.1038/ngeo1354]
-
Turpie K R, Klemas V V, Byrd K, Kelly M, Jo Y H. 2015. Prospective hyspiri global observations of tidal wetlands. Remote Sensing of Environment, 167 : 206–217. [DOI: 10.1016/j.rse.2015.05.008]
-
Xu G H, Liu Q H, Chen L F, Liu L Y. 2016. Remote sensing for China’s sustainable development: Opportunities and challenges. Journal of Remote Sensing, 20 (5): 679–688.
-
Yue L, Shen H, Yu W, Zhang L. 2018. Monitoring of historical glacier recession in yulong mountain by the integration of multisource remote sensing data. IEEE Journal of Selected Topics in Applied Earth Observations & Remote Sensing, 99 : 1–13.
-
Brown L A, Dash J, Ogutu B O and Richardson A D. 2017. On the relationship between continuous measures of canopy greenness derived using near-surface remote sensing and satellite-derived vegetation products. Agricultural and Forest Meteorology, 247 : 280–292. [DOI: 10.1016/j.agrformet.2017.08.012]
-
Chen J M, Menges C H and Leblanc S G. 2005. Global mapping of foliage clumping index using multi-angular satellite data. Remote Sensing of Environment, 97 (4): 447–457. [DOI: 10.1016/j.rse.2005.05.003]
-
Craw D, Upton P, Burridge C P, Wallis G P and Waters J M. 2016. Rapid biological speciation driven by tectonic evolution in New Zealand. Nature Geoscience, 9 (2): 140–144. [DOI: 10.1038/ngeo2618]
-
Fernández N, Paruelo J M and Delibes M. 2010. Ecosystem functioning of protected and altered mediterranean environments: a remote sensing classification in Doñana, Spain. Remote Sensing of Environment, 114 (1): 211–220. [DOI: 10.1016/j.rse.2009.09.001]
-
Kim H, Parinussa R, Konings A G, Wagner W, Cosh M H, Lakshmi V, Zohaib M and Choi M. 2018. Global-scale assessment and combination of SMAP with ASCAT (active) and AMSR2 (passive) soil moisture products. Remote Sensing of Environment, 204 : 260–275. [DOI: 10.1016/j.rse.2017.10.026]
-
Li D R. 2001. Discussion on earth observation and geographic information system. Advance in Earth Science, 16 (5): 689–703. [DOI: 10.11867/j.issn.1001-8166.2001.05.0689] ( 李德仁. 2001. 对地观测与地理信息系统. 地球科学进展, 16 (5): 689–703. [DOI: 10.11867/j.issn.1001-8166.2001.05.0689] )
-
Li J H and Shi J C. 2016. Global Ecological Environmental Remote Sensing Monitoring 2015 Annual Report. Beijing: Science Press (李加洪, 施建成. 2016. 全球生态环境遥感监测2015年度报告. 北京: 科学出版社)
-
Liao X H and Shi J C. 2013. Global Ecological Environmental Remote Sensing Monitoring 2012 Annual Report. Beijing: Science Press (廖小罕, 施建成. 2013. 全球生态环境遥感监测2012年度报告. 北京: 科学出版社)
-
Liao X H and Shi J C. 2014. Global Ecological Environmental Remote Sensing Monitoring 2013 Annual Report. Beijing: Science Press (廖小罕, 施建成. 2014. 全球生态环境遥感监测2013年度报告. 北京: 科学出版社)
-
Liao X H and Shi J C. 2015. Global Ecological Environmental Remote Sensing Monitoring 2014 Annual Report. Beijing: Science Press (廖小罕, 施建成. 2015. 全球生态环境遥感监测2014年度报告. 北京: 科学出版社)
-
Meng X C, Cheng J and Liang S L. 2017. Estimating land surface temperature from Feng Yun-3C/MERSI data using a new land surface emissivity scheme. Remote Sensing, 9 (12): 1247 [DOI: 10.3390/rs9121247]
-
Murray N J, Keith D A, Bland L M, Ferrari R, Lyons M B, Lucas R, Pettorelli N and Nicholson E. 2018. The role of satellite remote sensing in structured ecosystem risk assessments. Science of the Total Environment, 619-620 : 249–257. [DOI: 10.1016/j.scitotenv.2017.11.034]
-
Siepielski A M, Morrissey M B, Buoro M, Carlson S M, Caruso C M, Clegg S M, Coulson T, DiBattista J, Gotanda K M, Francis C D, Hereford J, Kingsolver J G, Augustine K E, Kruuk L E B, Martin R A, Sheldon B C, Sletvold N, Svensson E I, Wade M J and MacColl A D C. 2017. Precipitation drives global variation in natural selection. Science, 355 (6328): 959–962. [DOI: 10.1126/science.aag2773]
-
Stavrakou T, Müller J F, Peeters J, Razavi A, Clarisse L, Clerbaux C, Coheur P F, Hurtmans D, De Mazière M, Vigouroux C, Deutscher N M, Griffith D W T, Jones N N and Paton-Walsh C. 2011. Satellite evidence for a large source of formic acid from boreal and tropical forests. Nature Geoscience, 5 (1): 26–30. [DOI: 10.1038/ngeo1354]
-
Turpie K R, Klemas V V, Byrd K, Kelly M and Jo Y H. 2015. Prospective hyspiri global observations of tidal wetlands. Remote Sensing of Environment, 167 : 206–217. [DOI: 10.1016/j.rse.2015.05.008]
-
Xu G H, Liu Q H, Chen L F and Liu L Y. 2016. Remote sensing for human sustainable development: opportunities and challenges. Journal of Remote Sensing, 20 (5): 679–688. [DOI: 10.11834/jrs.20166308] ( 徐冠华, 柳钦火, 陈良富, 刘良云. 2016. 遥感与中国可持续发展: 机遇和挑战. 遥感学报, 20 (5): 679–688. [DOI: 10.11834/jrs.20166308] )
-
Yue L W, Shen H F, Yu W and Zhang L P. 2018. Monitoring of historical glacier recession in Yulong mountain by the integration of multisource remote sensing data. IEEE Journal of Selected Topics in Applied Earth Observations and Remote Sensing, 11 (2): 388–400. [DOI: 10.1109/JSTARS.2017.2776901]