
|
收稿日期: 2018-02-02
基金项目: 国家重点研发计划(编号:2018YFA0605500);国家高技术研究发展计划(863 计划)(编号:SS2012AA120904);中国科学院重点部署项目(编号:KFZD-SW-316);科技部全球空间遥感信息报送和年度报告工作专项项目(编号:1061302600001)
第一作者简介: 柳钦火,1968年生,男,研究员,研究方向为遥感辐射传输机理、建模与反演研究。E-mail:liuqh@radi.ac.cn
文献标识码: A
|
摘要
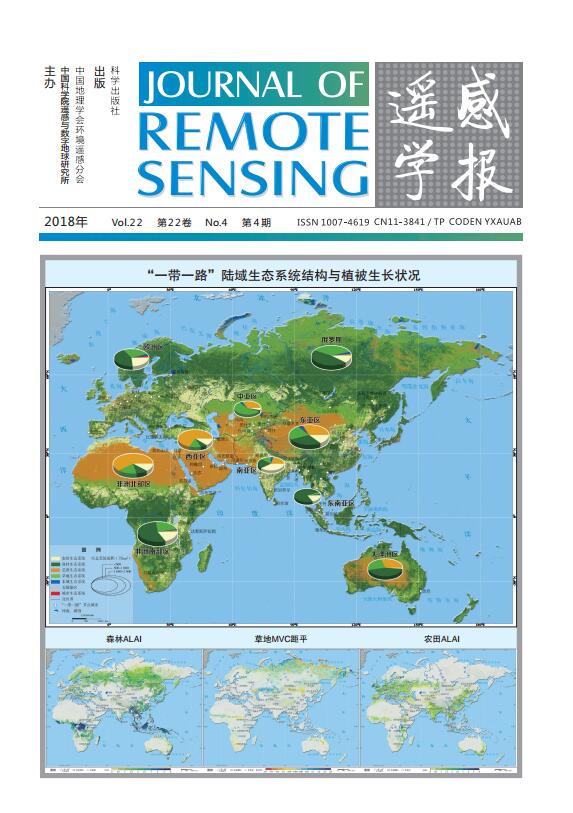
2013年9月和10月,习近平主席在出访中亚和东南亚国家期间,先后提出了共建“丝绸之路经济带”和“21世纪海上丝绸之路”(简称“一带一路”)的重大倡议。要全面保护“一带一路”区域生态环境,实现2030年可持续发展目标,是一个具有挑战性的问题。遥感技术对生态环境监测与评价发挥着十分重要的作用。本研究利用多尺度、多源遥感数据,对2015年“一带一路”区域的生态环境状况进行监测和分析,旨在提供可持续发展目标生态环境遥感监测的本底。本文选取了几个重要的生态环境方面开展监测与分析,主要包括宏观生态系统结构和植被状况、太阳能资源分布、水资源平衡、主要生态环境限制因素对经济走廊建设的影响、主要城市生态环境质量等。监测区域覆盖亚洲、非洲、欧洲和大洋洲的陆上区域。研究结果为生态环境评价与保护提供了有效的决策依据,有助于“一带一路”建设积极推进。
关键词
一带一路, 生态系统宏观格局, 太阳能资源, 水分收支, 生态环境约束性因素, 城市生态监测
Abstract
The Silk Road Economic Belt and 21st Century Maritime Silk Road (hereinafter called Belt and Road) initiative was proposed in 2013. The comprehensive protection of the ecological environment of the Belt and Road region for Sustainable Development Goals 2030 (SDGs 2030) presents a challenge. Remote Sensing technology plays an important role in the monitoring and assessment of the ecological environment. In this research, the ecological environment status of the Belt and Road region in 2015 was monitored and analyzed as baseline of the SDGs 2030 by using multiscale, multisource remote sensing data. Several important ecological environmental issues of concern in SDGs 2030 were investigated, including macroscopic ecosystem patterns, vegetation status, solar energy resource distribution, water resource balance, main ecological environmental constraint factors on economic corridor construction, and major urban ecological quality. The monitored areas include Asia, Africa, Europe, and Oceania along the Belt and Road region. Results of this study provide useful basis for policy decision making in eco-environmental evaluation and protection and for the scientific implementation of the Belt and Road initiative.
Key words
Belt and Road, ecosystem macrostructure, solar energy resources, water budget, ecological environment constraint factors, urban ecological monitoring
1 引 言
近年来,全球经济和技术发展迅速,为人类创造了巨大财富,同时也加剧了发展与相对落后现状之间的矛盾。这种矛盾加速了人类对资源的掠夺,破坏了共享的环境。人类对地球资源的消耗和对环境的破坏,导致全球生态环境问题频发,如全球变暖、生态退化和环境污染,不仅影响社会稳定和经济可持续发展, 也威胁到生态文明建设。中国政府和科学家非常重视这些问题, 迫切需要开展全球生态环境遥感监测。作为最大的发展中国家,中国始终重视生态环境保护和建设,积极落实2030年可持续发展目标。2013年9月和10月,习近平主席在出访中亚和东南亚国家期间,先后提出了共建“丝绸之路经济带”和“21世纪海上丝绸之路”(简称“一带一路”)的重大倡议。“一带一路”空间范围广阔,生态系统复杂,生态环境异动频繁。“一带一路”建设过程中要全面平衡建设和生态环境保护。环境是无界的,一旦出现环境问题,就会扩散到整个世界。因此,生态环境保护在基础设施建设、生态环境背景监测和动态变化监测中发挥着重要作用。遥感技术具有信息量大、观测范围广、精度高、速度快以及实时性和动态性强等特点(Mulder 等,2011),能够为生态环境监测与评价提供更为客观和准确的数据,使得大范围乃至全球生态环境监测成为可能,并且已经成为不可或缺的手段之一。
针对生态环境遥感监测,国内外已开展了系列相关研究。如“全国生态环境十年变化(2000年—2010年)遥感调查与评估项目”,建立了评估全国土地覆盖的分类系统,完成了2000、2005、2010年的土地覆盖分类制图;构建了植被指数、植被覆盖度、叶面积指数、地表温度、蒸散、净初级生产力和地上生物量等地表参量遥感反演与验证模型等。另外,就区域生态环境动态监测与管理系统设计以及生态环境监测和评价指标体系等方面,国内也开展了相关研究工作(廖克 等,2003;王静 等,2003;李爱军 等,2004)。在土地覆盖分类和土地利用动态变化研究方面,罗海江等人(2006)、廖克等人(2006)提出了研究方案,取得了一定的成效。齐清文等人(2005)探讨了基于3S技术进行生态环境监测、评价与综合调控的方法和关键技术。吴炳方等人(2005)、史志华等人(2006)运用遥感技术对生态治理区的生态恢复情况进行了动态监测。张增祥等人(2003)利用多种来源的不同专题空间数据实现了大范围的生态环境状况综合评价。李德仁等人(2017)基于1993年—2012年DMSP/OLS夜间遥影像数据对“一带一路”沿线国家进行夜光规模分布动态研究,探究了城市夜间灯光整体空间格局变化和时空演化特征,揭示了20年间“一带一路”区域夜光规模分布时空动态和演变规律,有助于更好地认识和理解区域发展状况,为经济社会的发展提供参考。江威等人(2017)综合分析了夜间灯光数据在“一带一路”建设中的应用潜力,如油气开采时空信息挖掘、社会经济参量估算、生态环境评估、城市化过程重建等,都发挥了重要的作用,在未来的研究中具备非常大的应用潜力。
现有研究主要集中在小范围空间尺度,以县级、省级生态环境遥感监测居多,国家生态环境遥感监测相对较少,大区域乃至全球尺度的生态环境遥感监测少之又少,而且所用的监测指标有限,监测内容不够全面。本研究首次就“一带一路”大区域空间尺度,从生态环境遥感监测主要方面出发,利用2000年—2015年多尺度、多源遥感数据开展生态系统宏观结构和植被状况、太阳能资源分布、水资源平衡、主要生态环境限制因素对经济走廊建设的影响、主要城市生态环境质量等监测。监测区域覆盖了亚洲、非洲、欧洲和大洋洲的陆上区域。通过获取宏观、动态的多要素地表信息,厘清生态脆弱区、环境质量退化区、重点生态保护区等,为全面实现生态环境可持续发展提供有力的决策依据,为科学评价“一带一路”建设的生态环境影响提供科技支撑。
2 “一带一路”区域面临的主要生态环境问题
2.1 “一带一路”区域概况
“一带一路”指“丝绸之路经济带”和“21世纪海上丝绸之路”(图1)。其中“丝绸之路经济带”包括六大经济走廊,分别为中蒙俄经济走廊、新亚欧大陆桥、中国-中亚-西亚经济走廊、中南半岛经济走廊、中巴经济走廊、孟中印缅经济走廊。“一带一路”重要节点城市是指在“一带一路”沿线城市网络中,基础条件较好、综合比较优势明显、集聚辐射作用较强,在“一带一路”建设中具有重要地位的城市。
根据“一带一路”所穿越主要区域的地理位置、自然地理环境、社会经济发展特征以及与中国交流合作的密切程度等,将“一带一路”沿线区域作为监测区,主要包括亚洲、非洲、欧洲和大洋洲,为便于区域对比分析,将“一带一路”监测陆域划分为西亚区、南亚区、东亚区、东南亚区、中亚区、俄罗斯、大洋洲区、欧洲区、非洲北部区和非洲南部区十大分区。


2.2 主要生态环境问题
“一带一路”陆域途经区域范围广阔,自然环境复杂多样,既有世界最高的高原、山地,又有富饶的平原、三角洲;既有雨量丰沛的热带雨林,又有极度干旱的荒漠、沙漠和异常寒冷的极地冰原,生态环境总体较为脆弱,其中,60%以上的区域为干旱和半干旱的草原、荒漠和高海拔生态脆弱区,气候干燥、降水量少。中亚、西亚和北非是全球气候最为干燥的地区,水资源严重短缺,土地荒漠化严重,生态系统一旦破坏将难以恢复。东南亚和南亚地区受季风的强烈影响,地震、洪涝、泥石流等自然灾害频发。近年来,快速的工业化、城市化进程造成了这些区域资源消耗飙升、空气污染、水污染、土地退化、生物多样性减少等一系列生态环境问题,严重地影响了区域的可持续发展。全球气候变化已导致海平面上升以及海水温度、盐度的异常变化,引起海洋灾害频发。海洋资源过度利用、陆源污染物排放过量等加剧了海洋污染,导致海洋生态系统更加脆弱。
“一带一路”区域在环境变化、粮食安全、自然灾害、城镇化进程、世界遗产保护等方面面临着严峻的挑战。我们面临的关键挑战主要包括以下8个方面(Guo,2018): (1)适应气候和环境变化; (2) 防灾减灾; (3) 水资源管理; (4) 粮食安全和农业可持续发展; (5)保护自然和文化遗产; (6) 城市可持续发展和基础设施建设; (7) 海岸/海区资源管理; (8)掌握高山和北极变化。
3 生态环境遥感监测技术流程
3.1 可持续发展资源环境指标体系
重点聚焦2030联合国可持续发展目标中能够用遥感监测的指标(表1),如防灾减灾、粮食安全及可持续农业、水资源管理、能源与自然资源管理、公共卫生和人类健康环境影响监测、生物多样性及生态系统的可持续性、区域与城镇可持续发展、基础设施与交通管理等领域,加强资源环境综合观测、评估和预警等前沿关键技术研究,提升全球地球综合观测系统的资源环境监测应用服务能力,为联合国2030可持续发展目标提供更好的技术和信息支撑。
聚焦2030可持续发展目标,基于遥感可开展的监测内容主要有:(1)粮食安全和农业可持续发展;(2)灾害与气候变化响应;(3)大气环境与气候变化响应;(4)生态系统格局时空演化;(5)生物多样性与生态系统服务功能;(6)海洋/海岸带生态环境遥感监测;(7)水资源盈亏与优质水资源管理可持续发展;(8)辐射平衡与气候变化;(9)太阳能发电潜力与清洁能源可持续发展;(10)三极与冰冻圈(冻融)动态变化遥感监测。
表 1 与遥感相关的联合国2030可持续发展目标
Table 1 2030 sustainable development goals of United Nations related with remote sensing
| 可持续发展目标 | 与遥感相关的指标 | |
| 目标6 | 清洁饮水和
卫生设施 |
6.3.2优质水体比例 |
| 6.4.1水分利用效率 | ||
| 6.4.2水分盈亏指数 | ||
| 6.5.1跨境河流水资源管理 | ||
| 6.6.1与水有关的生态系统变化 | ||
| 目标7 | 廉价和清洁能源 | 7.2.1太阳能发电潜力、 太阳能占总能耗比例 |
| 目标9 | 工业、创新和基础设施 | 9.1.1交通路网便利度 |
| 9.1.2客运和货运量 | ||
| 9.4.1二氧化碳排放量 | ||
| 目标11 | 可持续城市和社区 | 11.1.1城市非正规住房比例 |
| 11.2.1路网通达度 | ||
| 11.3.1城市土地利用状况和人口增长率 | ||
| 11.7.1城市公共空间占比 | ||
| 11.a.1城市群人口容纳量 | ||
| 目标15 | 陆地生物 | 15.1.1森林覆盖率 |
| 15.1.2生态系统/生物多样性 | ||
| 15.2.1可持续森林管理 | ||
| 15.3.1退化土地占比 | ||
3.2 生态环境遥感监测流程
如何利用多源遥感卫星数据生产出一系列能够支持区域尺度生态水文一体化的高质量遥感主题产品,已经成为一个急需解决的问题。现阶段已经有许多全球遥感产品,如MODIS、FY-3等,然而产品的精度、时空分辨率、连续性或一致性都不能很好地满足实际应用需求。为了提高产品精度、时空分辨率、连续性和一致性,项目团队设计并开发了一种多源数据协同定量遥感产品生产系统MuSyQ (Multi-source data Synergized Quantitative remote sensing production system)。
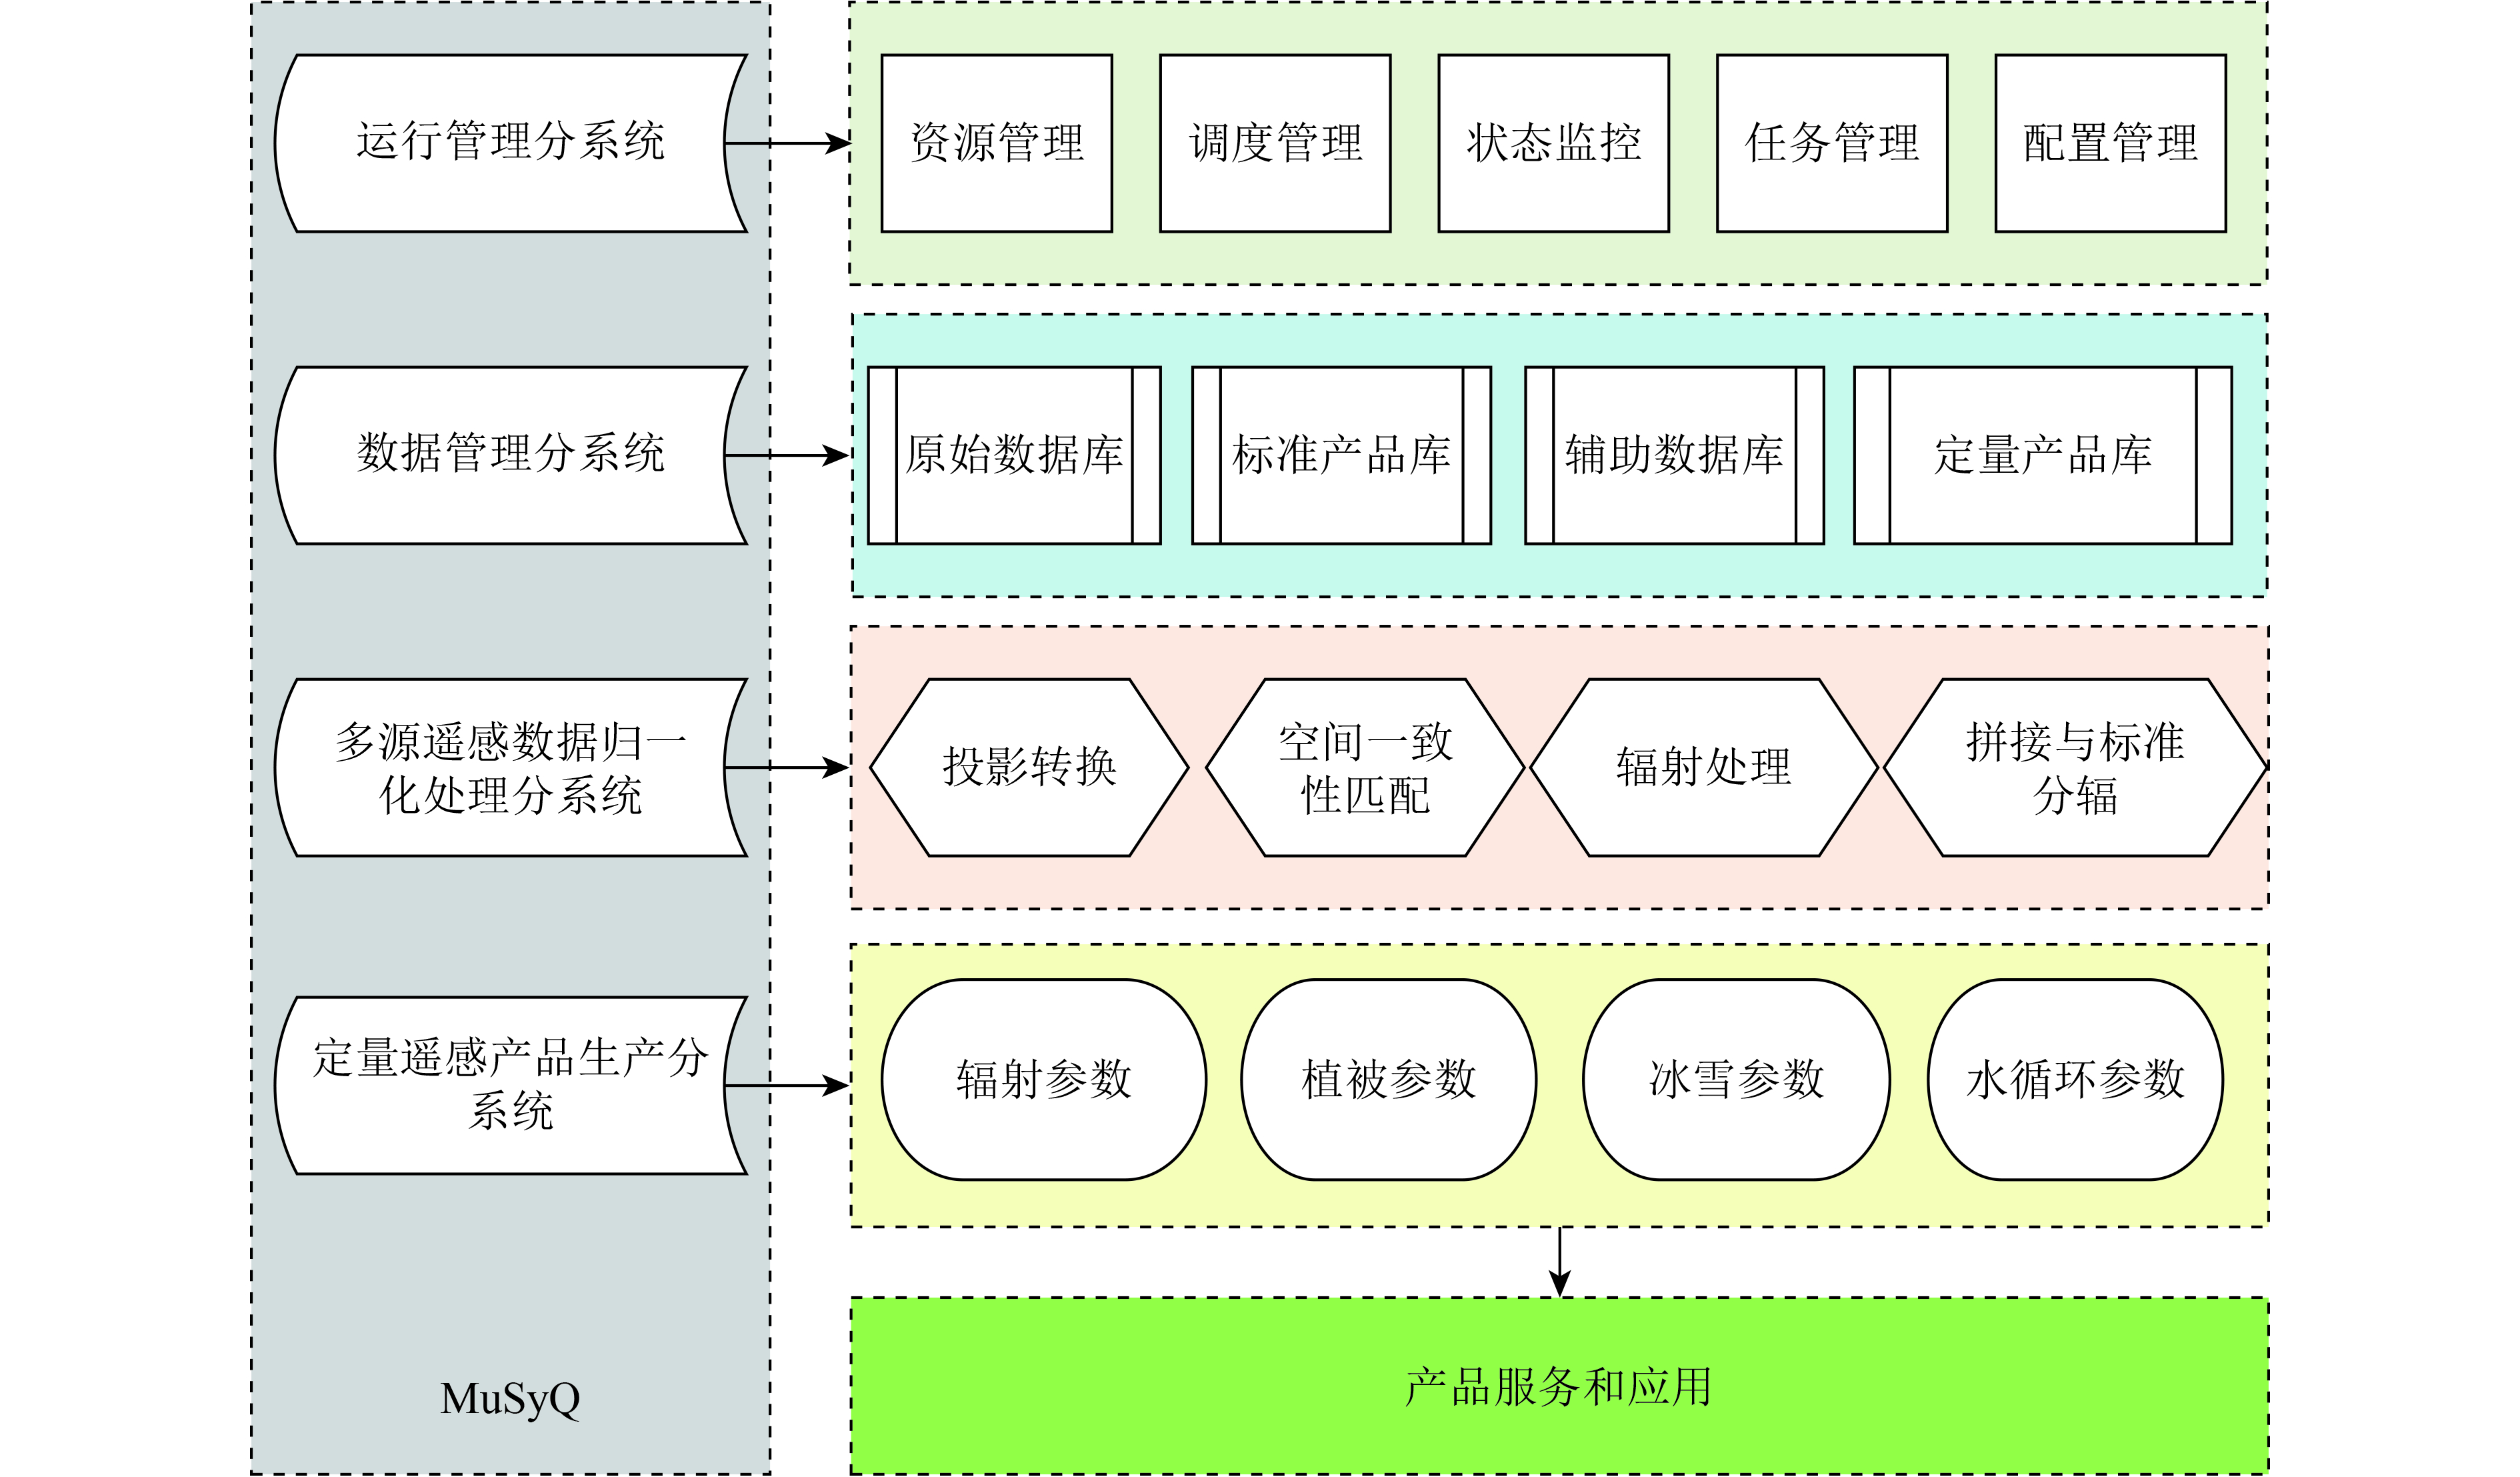
该系统包括4个子系统(图2):(1) 运行管理分系统:由资源管理、调度管理、状态监控、任务管理、配置管理组成;(2) 数据管理分系统:包括原始数据库、标准产品库、辅助数据库和定量产品库;(3) 多源遥感数据归一化处理分系统:包括投影转换、空间一致性匹配、辐射处理、拼接与标准分幅;(4) 定量遥感产品生产分系统:由辐射参数、植被参数、冰雪参数和水循环参数等产品组成。
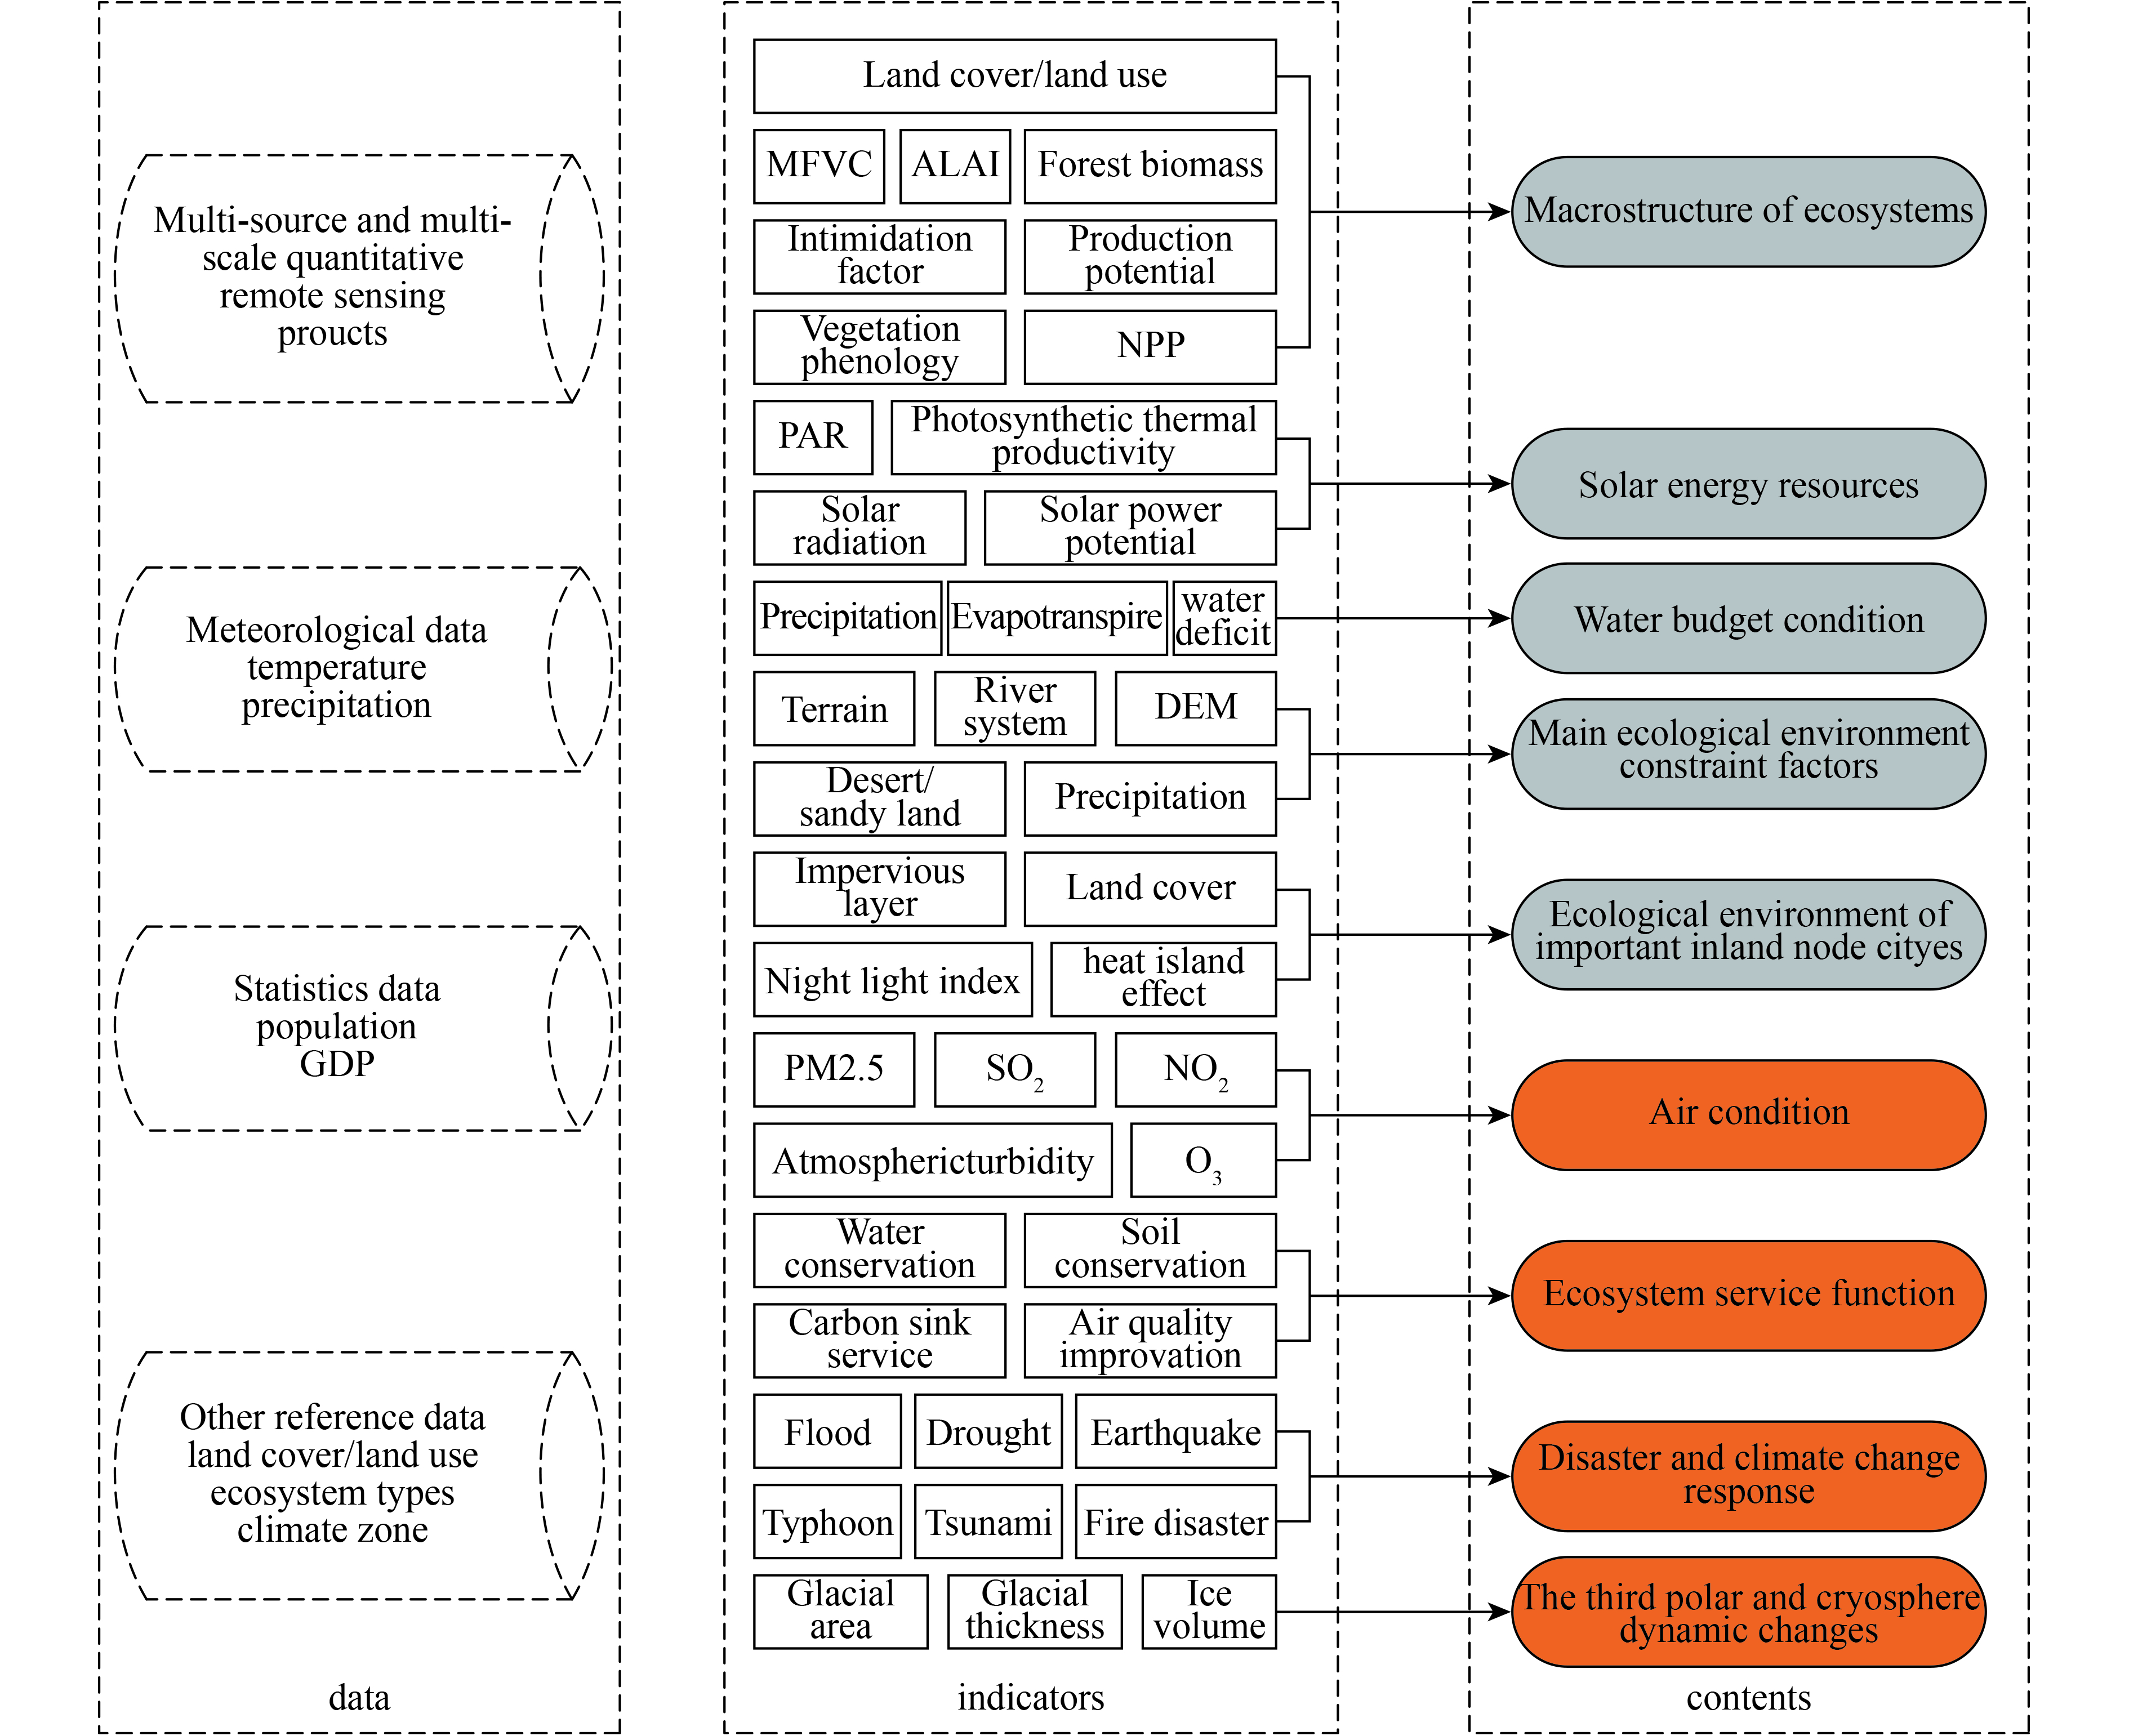
基于遥感数据和专题产品,结合气温、降水等气象数据,人口、GDP等统计数据以及其他参考数据,对“一带一路”区域生态系统宏观结构和植被状况、太阳能资源分布、水资源平衡、主要生态环境限制因素对经济走廊建设的影响、主要城市生态环境质量等开展遥感综合分析,监测指标与评价技术路线如图3所示。其中大气环境质量、生态系统服务功能、灾害与气候变化响应、三极与冰冻圈(冻融)动态变化等监测内容是未来重点关注和开展的主要工作。

4 “一带一路”区域生态环境遥感监测主要进展
“一带一路”区域生态环境状况遥感监测的主要内容包括:(1)陆域生态系统宏观格局与主要植被生态系统状况;(2)陆域太阳能资源与开发状况;(3)陆域水分收支状况;(4)主要经济走廊区域生态环境制约因素;(5)重要节点城市生态环境与发展状况。
4.1 陆域生态系统宏观格局和植被状况
监测区域生态系统类型主要包括森林、荒漠、草地、农田、水域和城市生态系统,面积分别为3214.75万km2、2230.79万km2、2170.07万km2、1389.52万km2、199.56万km2和52.47万km2。各个分区间生态系统结构差异很大,东南亚区、非洲南部区、俄罗斯、大洋洲区、欧洲区以森林生态类型为主,中亚区和非洲北部区以草地和荒漠生态类型为主,南亚区以农田生态类型为主,东亚区农田、森林、草地和荒漠生态系统分布较为均衡(图4)。
分区植被生长状况差异明显。2015年,俄罗斯森林地上生物量最多,为923亿吨,东南亚区森林年平均叶面积指数和年最大植被覆盖度均最高,分别为3.64、0.99;东南亚区草地和农田的年平均叶面积指数最高,分别为2.67和2.05,年最大植被覆盖度也最大,分别为0.97和0.93。
2010年—2015年,俄罗斯和东亚区森林生物量分别增加21亿吨和17亿吨,而非洲南部区、东南亚区和非洲北部区森林生物量分别降低11亿吨、5亿吨和2亿吨;俄罗斯和大洋洲区草地年平均叶面积指数分别降低0.52%和3.79%;大洋洲区农田年平均叶面积指数降低1.97%。

4.2 陆域太阳能资源状况
太阳能资源年总量空间分布受纬度影响为主,地形和云量影响为辅。低纬度的非洲、西亚、南亚、大洋洲资源最丰富,平均太阳辐射量大于6500 MJ/(m2.a),且季相差异不明显;东南亚、中亚、东亚资源很丰富,平均太阳辐射量大于5300 MJ/(m2.a);欧洲资源丰富,平均太阳辐射量为4300 MJ/(m2.a);俄罗斯因纬度较高,太阳能资源一般,平均太阳辐射量只有3093 MJ/(m2.a),且季相变化显著,月太阳辐射波动高达10倍以上。青藏高原云量较高,其年总太阳辐射量6300 MJ/(m2·a)左右,低于同纬度中亚地区的8000 MJ/(m2·a)(图5)。
太阳能发电潜力主要受太阳辐射年总量、季节波动、下垫面条件以及交通等因素的影响。适宜太阳能发电的地区主要分布在中低纬的荒漠及稀疏植被区,主要包括西亚、非洲北部的撒哈拉地区,非洲南部的卡拉哈迪沙漠,以及澳大利亚中西部地区,年太阳能发电量均大于350 KW h/m2;东南亚地区以及南亚的印度由于农田和森林等植被覆盖度较高,不适宜大规模开发太阳能;俄罗斯纬度高,自然地理条件决定了其太阳能发电潜力较低。

4.3 陆域水分收支状况
非洲中部、东亚东南部和东南亚降水丰沛,降水量分别达到1200 mm、1600 mm和2000 mm以上,水分盈余分别达到200 mm、600 mm和1000 mm以上;中亚、西亚及北非气候干旱,降水量低于200 mm,降水与蒸散基本平衡(图6)。荒漠绿洲和集约化程度高的农业灌区,大气降水无法满足农田蒸散耗水需求,生产用水与生态用水之间矛盾突出,面临严峻的水资源危机。丝绸之路沿线的中国河西走廊、塔里木河流域、中亚锡尔河流域等绿洲区大气降水亏缺量达到500 mm,绿洲农田蒸散耗水主要来自盆地周边高寒山区降水和冰雪融水灌溉补给,绿洲农业用水挤占生态环境用水,导致生态环境退化、土地荒漠化;印度西北部和中国华北平原农业灌区蒸散明显高于降水,降水亏缺量达到200 mm,主要通过引用恒河、黄河等地表水以及抽取地下水用于农业灌溉,导致部分地区地下水位显著下降,引发地面沉降、生态环境退化等问题。

4.4 主要生态环境约束性因素
对各经济走廊的生态约束性因素分析表明,不同经济走廊及每个走廊的不同分段其主要生态约束性因素不尽相同(图7)。“中蒙俄经济走廊”严寒区段总计长约2300 km,山地区段长约650 km,荒漠区段长约400 km,且自然保护区广布;“新亚欧大陆桥”全长超过10000 km,其中中亚段有长约1800 km的生态敏感地段;“中国–中亚–西亚经济走廊”的中国–中亚段2240 km穿越荒漠区、360 km穿越天山山脉,西亚段820 km穿越荒漠区、1400 km穿越山区;“中国–中南半岛经济走廊”北段约700 km穿越海拔高于2000 m的区域,南段有各类自然保护区259个;“中巴经济走廊”全长约3000 km,其中北段约940 km穿越海拔普遍高于4000 m的喀喇昆仑山脉和帕米尔高原,南段的巴基斯坦南部全长约490 km穿越干旱和荒漠区;“孟中印缅经济走廊”全长近4000 km,中缅段穿越1500 km的云贵高原和缅甸北部山地,印孟段长约2500 km且极端天气造成的洪涝灾害频发。
4.5 重要节点城市生态环境状况
2000年—2013年,中蒙俄经济走廊中的俄罗斯城市建成区绿地面积大、灯光指数稳定,如莫斯科建成区内绿地面积占比为51.44%,灯光指数年变化率为0.20,而城市周边灯光指数年变化率为1.06,说明城市向周边蔓延速率快。新亚欧大陆桥欧洲段城市整体发展成熟,绿地占比高,城市环境良好,灯光指数呈现出轻微的下降趋势,如布列斯特的建成区内绿地面积占比50.84%,灯光指数年增长率为–0.42。在中国—中亚—西亚经济走廊中,西亚城市建成区绿地占比普遍偏低,灯光指数年增长率较大,城市扩展较快;中亚城市普遍欠发达,如塔什干的城市建成区内绿地面积占比9.73%,灯光指数年增长速率较低,仅为0.28,而阿拉木图的城市建成区和周边地区的灯光指数年增长速率分别为1.23和1.03,城市发展比较快。中国—中南半岛经济走廊的灯光指数普遍呈现出“高密度、高增长率”的特点,如万象建成区内绿地面积占比12.22%,灯光指数年增长率为1.23。孟中印缅经济走廊的城市发展差异较大,如曼德勒和达卡的建成区内绿地面积占比分别为11.43%和20.37%,灯光指数年增长率分别为1.15和0.38。

5 结论与展望
我们现已具备获取大范围遥感数据和批量生产专题产品的能力,在“一带一路”生态环境遥感监测过程中取得的成果可为“一带一路”区域实现2030联合国可持续发展目标提供重要的决策依据和科学支撑。
5.1 结 论
(1)“一带一路”陆域十大分区中地带性气候资源禀赋差异悬殊,生态系统结构与生产力差异明显;欧洲区与俄罗斯北部寒温带与寒带森林、非洲南部区和东南亚区热带雨林是全球森林碳库的重要组成部分。2015年厄尔尼诺事件导致部分地区严重干旱,农田和草地生态系统生产力受到显著影响。
(2)“一带一路”陆域太阳能资源空间分布主要受纬度、地形和云量等因素的影响,其中纬度的影响最为突出,最适宜太阳能发电的地区主要分布在中低纬度的荒漠及稀疏植被地区。
(3)“一带一路”陆域水分收支空间分布不均。干旱区绿洲和半湿润/半干旱区的灌溉农区,大气降水不能满足农田蒸散耗水需求,依靠河流径流和地下水补充水分亏缺,农业生产用水与生态用水之间矛盾突出,导致局部生态环境退化。
(4)走廊沿线区域的生态环境条件对“一带一路”建设有重要影响,是必须考虑的重要因素。对各经济走廊的生态约束性因素分析表明,不同经济走廊及每个走廊的不同分段其主要生态约束性因素不尽相同。
5.2 建 议
(1)东南亚区、南亚区、中东欧及俄罗斯远东地区生态条件良好,生态资源丰富,经济发展潜力大,是“一带一路”倡议实施中应重点关注的区域。但是,在这些区域中,东南亚区和南亚区热带雨林与亚热带山地森林是全球生物多样性保护的关键区域;欧亚大陆高纬度地区的亚寒带针叶林生长缓慢,自身恢复能力差,一旦破坏难以恢复。因此,在规划和建设中应特别重视这些区域的生态保护问题。
(2)以生态环境保护和水资源承载力为制约因素,科学制定“一带一路”区域产业发展规划,兼顾生产用水、生活用水和生态用水之间的平衡,有效保护陆地生态系统,维护水资源安全。
(3)加大政策扶植,发展智能电网,科学布局“一带一路”陆域太阳能资源开发,带动国际应对气候变化行动。
5.3 展 望
未来将重点围绕全球气候变化、全球碳源汇等热点问题,提升全球碳循环、水循环和能量循环系统的综合观测与分析能力;加强全球生态系统与生物多样性的全球变化响应;全球水循环关键过程与全球气候变化的互馈机制;全球辐射收支与能量分配的强迫机制;海洋大气之间的能量传递和转化、暴雨、台风等灾害性天气预报与成因机制。
为了满足将来的“一带一路”生态环境遥感监测需求,我们将逐步提高国产卫星数据使用率、增加产品时间序列长度、提高专题产品精度,使得监测要素多元化、监测区域全球化,聚焦全球生态环境关键要素、关键区域、关键类型,充分发挥遥感技术优势,实现生态环境要素的动态变化遥感监测,为全球变化分析奠定基础。
志 谢 感谢中国资源卫星应用中心、环保部卫星应用中心、国家卫星气象中心等提供了国产卫星遥感数据,感谢中国科学院计算机网络信息中心提供了产品生产的计算和存储资源,感谢国家基础信息地理信息中心提供了基础地理底图。此外,刘纪远研究员、汲长远研究员、李加洪研究员、张松梅研究员、高志海研究员、张镱锂研究员、施建成研究员、李增元研究员等,以及全球生态环境遥感监测年度报告工作顾问组、专家组和编写组的其他专家,针对“一带一路”生态环境遥感监测工作也提出了很多建设性的意见和建议,在此一并表示衷心的感谢。
1 INTRODUCTION
In recent years, the rapid developments in the global economy and technology have provided great wealth to humankind, but they have also increased the contradiction between development and relative backwardness. This contradiction incites humans to consume resources predatorily and destroy the shared environment wantonly. Humans’ continuous consumption of the earth’s resources and damage to the environment have engendered global-scale ecological environmental problems, including global warming, ecological degradation, and environmental pollution. These problems not only affect the social stability and sustainable development of global economy but also threaten the construction of ecological civilization in China. Attaching importance to these problems, the Chinese government demanded the urgent monitoring of the global ecological environment by remote sensing. As the largest developing country, China has always paid attention to the protection and construction of the ecological environment as well as actively implemented the Sustainable Development Goals 2030 (SDGs 2030) of the United Nations (UN).
The “Silk Road Economic Belt” and “21st Century Maritime Silk Road” (hereinafter called Belt and Road) initiative was proposed in 2013, against the backdrop of a wide area of space, complex ecosystem, and frequent changes in ecological environment. The Belt and Road initiative needs to strike a comprehensive balance between construction and ecological environment protection. The environment is unbounded, and once resource and environmental problems arise, the problems will diffuse throughout the world. Therefore, ecological environment protection plays an important role in infrastructure construction, and ecological environmental background monitoring and dynamic change detection in the Belt and Road region are indispensable. Remote sensing technology has several advantages, such as rich information, wide observation range, high precision, high speed, and strong real-time and dynamic characteristics (Mulder, et al., 2011). Due to its advantages, this technology can provide objective and accurate data for ecological environmental monitoring and evaluation and allows for the monitoring of the ecological environment on a global scale. Remote sensing plays a considerable role in the construction of the Belt and Road region. Studies using remote sensing for ecological environmental monitoring have been conducted in China and abroad. For example, in the study “National Ecological Environment Survey and Assessment in Ten Years (2000—2010) by Remote Sensing”, remote sensing was used in establishing a classification system for national land cover evaluation; completing land cover classification mapping in 2000, 2005, and 2010; and constructing an inversion and verification model for vegetation index, vegetation coverage, leaf area index, surface temperature, evapotranspiration, net primary productivity, and aboveground biomass. In addition, studies have been conducted in China on the design of dynamic monitoring, management, and evaluation index systems for regional ecological environments (Liao, et al., 2003; Wang, et al., 2003; Li, et al., 2004). In the research field of land cover classification and dynamic land use changes, Luo, et al. (2006) and Liao, et al. (2006) proposed a research scheme and achieved notable results. Qi, et al. (2005) discussed methods and key techniques based on 3S technology for ecological environmental monitoring, evaluation, and comprehensive control. Wu, et al. (2005) and Shi, et al. (2006) used remote sensing technology for the dynamic monitoring of the ecological restoration in ecological management areas. Zhang, et al. (2003) realized a comprehensive evaluation of a wide area of ecological environment by using different thematic spatial data from various sources. Li, et al. (2017) researched the dynamic change of the night light along the Belt and Road country with DMSP/OLS data in 1993—2012 as basis, explored the overall spatial pattern change of the city lights at night and its space–time evolution characteristics, and revealed the change regularity of light at night in 20 years; their study contributed to an improved understanding of the regional development conditions and provided a reference for economic and social development initiatives. Jiang, et al. (2017) analyzed the application potential of night light data in the Belt and Road construction, specifically in the areas of oil and gas exploitation, social and economic parameter estimation, ecological environment assessment, and urbanization process reconstruction; their findings are of significance in future research.
Most existing studies have focused on a small area, on a county or provincial scale. However, studies on national- and global-level ecological environmental monitoring are relatively less, with the monitoring indicators limited and the monitoring content incomprehensive. The current study focuses on the main aspects of ecological environmental monitoring in the Belt and Road region. Multiscale, multisource remote sensing data in 2000—2015 were used in monitoring macroscopic ecosystem patterns, solar energy resources, water balance, main ecological environmental constraint factors on economic corridor construction, urban ecology. The land regions along the Belt and Road were taken as monitoring areas, including Asia, Africa, Europe, and Oceania. The monitoring areas were divided into 10 subregions, namely, West Asia, South Asia, East Asia, Southeast Asia, Central Asia, Russia, Oceania, Europe, Northern Africa, and Southern Africa, to facilitate regional comparative analysis. This study aims to provide a powerful scientific decision-making basis for the eco-environmental influence evaluation of the Belt and Road construction.
2 MAJOR ECOLOGICAL ENVIRONMENTAL ISSUES
2.1 General description of the Belt and Road region
The Belt and Road region refers to the Silk Road Economic Belt and 21st Century Maritime Silk Road (Fig. 1). The Silk Road Economic Belt contains six economic corridors, namely, the China–Mongolia–Russia Economic Corridor, New Eurasian Continental Bridge, China–Central Asia–West Asia Economic Corridor, China–Indo-China Peninsula Economic Corridor, China–Pakistan Economic Corridor, and Bangladesh–China–India–Burma Economic Corridor. An important node city in the Belt and Road economic corridor refers to a city that demonstrates favorable basic conditions, remarkable comprehensive advantage, and strong agglomeration radiation effect, and consequently holdsimportant status in the construction of the Belt and Road region.
The land regions along the Belt and Road region were taken as the monitoring areas, including Asia, Africa, Europe, and Oceania on the basis the geographic locations planned in the Belt and Road initiative and these regions’ natural geographic environment, social and economic development characteristics, and degree of communication and cooperation with China. As mentioned in Section 1, these regions were divided into 10 subregions, namely, West Asia, South Asia, East Asia, Southeast Asia, Central Asia, Russia, Oceania, Europe, Northern Africa, and Southern Africa.

2.2 Major environmental issues
The Belt and Road region encompasses a wide area, and its natural environment is complex and diverse. It covers the highest plateau and mountainous regions as well as the most fertile plains and deltas in the world. It also covers tropical rainfall forests extremely arid deserts, and unusually cold polar ice sheets. Overall, the ecological environment in the Belt and Road region is fragile, with more than 60% of its area occupied by arid and semi-arid grasslands, deserts, and fragile high-altitude ecological areas, which are characterized by dry climate and little precipitation. Central Asia, West Asia, and Northern Africa are the most arid regions in the world, with severe water shortages and serious land desertification. Once an ecological environment is damaged, the damage will be irreversible. Southeast Asia and South Asia are strongly affected by the monsoon system; natural disasters, such as earthquakes, floods, and mudslides frequently occur in these regions. In recent years, the rapid industrialization and urbanization have resulted in a series of ecological environmental problems, such as soaring resource consumption, air pollution, water pollution, land degradation, biodiversity reducing, and climate change, which have seriously affected the sustainable development of these regions. Global climate change has resulted in the melting of glaciers, rising of sea levels, and abnormal changes in the temperature and salinity of seawater, which all cause frequent marine disasters. The excessive use of marine resources and excessive discharge of land-based pollutants aggravate marine pollution and marine ecosystem vulnerability.
The Belt and Road region faces challenges related to environmental change, food security, natural disasters, urbanization, and world heritage conservation. The eight key challenges targeted by SDGs 2030 are as follows (Guo, 2018): (1) adapting to climate and environmental change, (2) mitigating disaster risk, (3) managing water supplies, (4) increasing agriculture and food security, (5) protecting natural and cultural heritage, (6) sustainable development of urban areas and infrastructure, (7) managing coasts and marine areas, and (8) understanding changes in high mountainous regions and the Arctic.
We conducted ecological environmental monitoring corresponding to these goals.
3 TECHNICAL PROCESS OF ECOLOGICAL ENVIRONMENTAL MONITORING BY REMOTE SENSING
3.1 Sustainable development of resources and environmental indicators
The following factors related to SDGs 2030 of the UN can be monitored by remote sensing (Table 1): disaster prevention and reduction, food security and sustainable agriculture, water management, energy and natural resource management, public health and environmental impact on human health monitoring, biodiversity and ecosystem sustainability, regional and urban sustainable development, and infrastructure and traffic management. Monitoring these factors could strengthen the research on front key technology for comprehensive resource and environmental observation, evaluation, and early warning; improve the application service capability of global earth observation systems for resource and environmental monitoring; and provide improved technical support and enriched reference information to SDGs 2030.
Focusing on the 2030 sustainable development goals, monitoring based on remote sensing canbe carried out mainly as follows: (1) food security and agricultural sustainable development, (2) disaster and climate change response, (3) atmospheric environment and climate change response, (4) ecological system pattern and temporal–spatial evolution, (5) biodiversity and ecosystem services, (6) ocean and coastal zone environmental monitoring, (7) the profit/loss of water resources and quality management of water resources for sustainable development, (8) radiation balance and climate change; (9) solar power potential and sustainable development of clean energy, and (10) dynamic change (freeze–thaw process) monitoring in the three poles and cryosphere.
Table 1 Sustainable Development Goals (SDGs) 2030 of the United nations vis-à-vis remotely sensed indicators
下载CSV| SGDs | Remotely sensed indicators |
| Goal 6: ensure availability and sustainable management of water and sanitation for all | 6.3.2 Proportion of bodies of water with good ambient water quality |
| 6.4.1 Change in water-use efficiency over time | |
| 6.4.2 Level of water stress: freshwater withdrawal as a proportion of available freshwater resources | |
| 6.5.1 Degree of integrated water resources management implementation (0—100) | |
| 6.6.1 Change in the extent of water-related ecosystems over time | |
| Goal 7: ensure access to affordable, reliable, sustainable and modern energy for all | 7.2.1 Renewable energy share in the total final energy consumption |
| Goal 9: Build resilient infrastructure, promote inclusive and sustainable industrialization and foster innovation | 9.1.1 Proportion of the rural population who live within 2 km of an all-season road |
| 9.1.2 Passenger and freight volumes, by mode of transport | |
| 9.4.1 CO2 emission per unit of value added | |
| Goal 11: make cities and human settlements inclusive, safe, resilient and sustainable | 11.1.1 Proportion of urban population living in slums, informal settlements or inadequate housing |
| 11.2.1 Proportion of population that has convenient access to public transport, by sex, age and persons with disabilities | |
| 11.3.1 Ratio of land consumption rate to population growth rate | |
| 11.7.1 Average share of the built-up area of cities that is open space for public use, by sex, age and persons with disabilities | |
| 11.a.1 Proportion of population living in cities that implement urban and regional development plans integrating population projections and resource needs, by size of city | |
| Goal 15: protect, restore and promote sustainable use of terrestrial ecosystems, sustainably manage forests, combat desertification, and halt and reverse land degradation and halt biodiversity loss | 15.1.1 Forest area as a proportion of total land area |
| 15.1.2 Proportion of important sites for terrestrial and freshwater biodiversity covered by protected areas, by ecosystem type | |
| 15.2.1 Progress towards sustainable forest management | |
| 15.3.1 Proportion of degraded land over total land area |
3.2 Flow chart for ecological environmental monitoring
How can we produce high-quality remote sensing thematic products that can support regional-scale integrated eco-hydrological studies from multisource satellite observations? Although numerous global remote sensing products are available, such as MODIS, Vegetation, and FY-3, their accuracy, spatial–temporal resolution, continuity, and/or consistency do not satisfy all the application requirements.
Hence, to improve the accuracy, spatial–temporal resolution, continuity, and/or consistency of existing hydrological products, a prototype system of multisource data synergized quantitative remote sensing products (MuSyQ) has been designed and developed for land surface parameters.
The MuSyQ system has four subsystems (Fig. 2): (1) the operation management subsystem, which consists of resource management, control management, configuration management, status monitor, and task management; (2) the database management subsystem, which consists of input data, standard data, ancillary data, and quantitative remote sensing product; (3) the multisource data normalization subsystem, which consists of projection, geometric merging, separation and matching, and radiation normalization, and (4) the quantitative remote sensing product subsystem, which consists of radiation budget parameter, vegetation parameter, snow and ice parameter, and water cycle parameter products.

Remote sensing data and thematic products combined with meteorological data, such as data on air temperature, precipitation, population, GDP, and other statistical and reference data are used for the remote sensing-based comprehensive analysis of the macrostructure of terrestrial ecosystems, ecological environmental conditions of the important node cities, solar energy resources, and water budget conditions in the Belt and Road region. The monitoring indicators and evaluation technology route are shown in Fig. 3. The atmospheric environmental quality, ecosystem services, disasters and climate change response, three poles and cryosphere (freezing and thawing) dynamic change monitoring will be conducted in future.
4 ECOLOGICAL ENVIRONMENT STATUS OF THE BELT AND ROAD REGION
Ecological environment monitoring in this study focused on (1) the macrostructure and vegetation status of the terrestrial ecosystems, (2) the status of land solar energy resources, (3) the terrestrial water budget, (4) the main constraint factors on the ecological environment in the main economic corridor, and (5) the ecological environmental conditions of the important node cities.
4.1 Ecosystem macrostructure and vegetation status
The ecosystems in the monitoring areas include mainly forest, desert, grassland, farmland, water, and urban ecosystems, with the forest ecosystems occupying the largest area (32.15 million km2), followed by desert, grassland and farmland ecosystems (occupying 22.31 million, 21.70 million, and 13.89 million km2, respectively). The water ecosystems occupy approximately 2.00 million km2. The urban ecosystems are the least spatially extensive, occupying only 0.52 million km2. Significant differences can be observed in the ecosystem structures of the various subregions. Southeast Asia, Southern Africa, Russia, Oceania, and Europe are dominated by forest ecosystems, whereas the prevailing ecosystems in Central Asia and Northern Africa are grassland and desert ecosystems. South Asia is dominated by farmland ecosystems. The distributions of farmland, forest, grassland, and desert ecosystems in East Asia are relatively balanced. The ecosystem macrostructure is shown in Fig. 4.
The variation of vegetation growth across subregions is remarkable. In 2015, the maximum forest aboveground biomass in Russia is estimated at 92.3 billion tons. The annual ALAI and MFVC of the forests in the Southeast Asia are the highest, being 3.64 and 0.99, respectively. The annual ALAI (MFVC) of grasslands and farmlands in the Southeast Asia are the highest, reaching 2.67 (0.97) and 2.05 (0.93), respectively.
From 2010 to 2015, the forest aboveground biomass increased by 2.1 billion tons and 1.7 billion tons in Russia and East Asia, respectively; whereas it decreased by 1.1 billion, 500 million, and 200 million tons in Southern Africa, Southeast Asia, and Northern Africa, respectively. The annual ALAI of grasslands in Russia and Oceania decreased by 0.52% and 3.79%, respectively, and that of farmlands in Oceania decreased by 1.97%.

4.2 Status of terrestrial solar energy resources
The spatial distribution of solar energy resources is influenced mainly by latitude, topography, and cloud cover, but the influence of the latter is usually greater. The low-latitude regions are endowed with the most abundant solar radiation. Africa, South Asia, West Asia, and Oceania each have an annual average solar radiation of greater than 6500 MJ/m2/a, and seasonal variability is insignificant. In Southeast Asia, Central Asia, East Asia, solar energy resources are also abundant, with their annual average solar radiation exceeding 5300 MJ/m2/a, followed by Europe (4300 MJ/m2/a). Russia has less solar radiation resources because of its higher latitude; Russia’s annual solar radiation averages only 3093 MJ/m2/a and presents high annual variation (solar radiation in July is 10 times that in December). The Tibetan Plateau enjoys less solar radiation (6300 MJ/m2/a) than Central Asia does even though they have the same latitude, primarily because the former has higher cloud cover (Fig. 5).
Photovoltaic (PV) power potential is determined mainly by annual global solar radiation, seasonal variation, land surface types, and transportation factors. Areas suitable for solar power development are located in low-latitude deserts and sparsely vegetated areas, including West Asia, the Sahara Desert and Kgalagadi Desert in Northern Africa, the Kgalagadi Desert in Southern Africa and central and western regions of Australia, where the annual PV power potential is greater than 350 KWh/m². In Southeast Asia and South Asia (India), large-scale development of solar energy is unsuitable because of its high vegetation coverage of farmlands and forests. Russia has the least solar potential because of its high latitude and natural geographic conditions.

4.3 Terrestrial water budget
In Central Africa, the southeastern region of East Asia, and Southeast Asia, precipitation is high, with annual amounts of over 1200 mm, 1600 mm, and 2000 mm, respectively, in 2015. The water surpluses in Central Africa, the southeastern region of East Asia, and Southeast Asia exceed 200, 600, and 1000 mm, respectively. In the arid regions, namely, Central Asia, West Asia, and Northern Africa, precipitation is below 200 mm, and the precipitation and evapotranspiration are balanced (Fig. 6). In desert oases and irrigated agricultural areas with intensive water use, the precipitation cannot meet the water demand for farmland evapotranspiration. The competition between water for agricultural and ecological requirements is also prominent, resulting in a severe water crisis. The desert oases along the Silk Road, namely, the Hexi Corridor and Trim River basin in China and the Syr Darya River basin in Central Asia, have a water deficit of 500 mm/a and the primary sources of water for evapotranspiration are mainly melted snow/glacier in the alpine region surrounding the basins. The ecological water requirement cannot be met because more water is used for oasis agricultural production. As a result, ecological degradation and land desertification occur. In northwestern India and North China Plain, evapotranspiration is significantly higher than precipitation in irrigated agricultural areas, resulting in a water deficit of 200 mm. Diverting surface water from the Ganges River, Yellow River, and other water bodies or overexploiting groundwater have caused significant groundwater table decrease, land subsidence, and ecological degradation.

4.4 Main ecological environmental constraint factors on economic corridor construction
The analysis of the ecological constraint factors on the economic corridors shows these factors vary across economic corridors and sections of every economic corridor (Fig.7). The China–Mongolia–Russia Economic Corridor demonstrates a severe cold section as long as approximately 2300 km, a mountainous section as long as approximately 650 km, and a desert section as long as approximately 400 km, as well as an extensive nature protection area. In the New Eurasian Land Bridge, which is over 10000 km long, an ecological sensitive area as long as approximately 1800 km exists in the Central Asia. In the China–Central Asia–West Asia Economic Corridor, the China–Central Asia section passes through 2240 km of desert area and 360 km of Tianshan Mountains, whereas the West Asia section passes through 820 km of desert area and 1400 km of mountainous area. In the China–Indo-China Peninsula Economic Corridor, the northern section passes through 700 km of high-altitude area (with an altitude higher than 2000 m), and the southern section has as many as 259 nature protection areas. In the China–Pakistan Economic Corridor, which has a total length of about 3000 km, the northern section passes through about 940 km of the Karakorum Mountains and Pamirs, which has an altitude of over 4000 m, and the southern section in the south of Pakistan passes through about 490 km of drought and desert area. In the Bangladesh–China–India–Myanmar Economic Corridor, whose total length is nearly 4000 km, the China–Myanmar section passes through 1500 km of the Yunnan–Guizhou Plateau and northern Myanmar mountains, and the Bangladesh–India section, which is as long as approximately 2500 km, frequently experiences floods caused by extreme weather.

4.5 Ecological environmental conditions of important inland node cities
In 2000—2013, the green land ratio is large and the light index is stable in the urban built-up areas in Russia in the China–Mongolia–Russia Economic Corridor. For example, the ratio of green land and light index growth rate in Moscow built-up area are 51.44% and 0.20, respectively, whereas the light index annual growth rate in its surrounding areas is 1.06, indicating the city’s spreading speed toward its surrounding areas is much higher. Cities in the European section of the New Eurasian Land Bridge are well developed in general, with high green land ratio and good city environment; the light index shows a slightly declining trend. In Brest for example, the green land ratio and annual growth rate of light index in its built-up area are 50.84% and −0.42, respectively. In the China–Central Asia–West Asia Economic Corridor, the green land ratio in urban built-up areas in West Asia is the lowest in general, the annual growth rate of light index is higher, and city expansion is quicker. Cities in Central Asia are underdeveloped in general. For instance, the green land ratio in the urban built-up area in Tashkent is 9.73%, and its annual growth rate of light index is low (0.28). However, the annual growth rate of the light index in the urban built-up area of Alma-Ata and its surrounding areas are 1.23 and 1.03, respectively, indicating quick city development. The light index of the China–Indo–China Peninsula Economic Corridor demonstrates high density and high growth rate. In Vientiane for example, the area of green land and the annual growth rate of light index in the urban built-up area are 12.22% and 1.23, respectively. The development of the cities in the Bangladesh–China–India–Myanmar Economic Corridor varies considerably . For example, the green land ratios in the urban built-up areas of Mandalay and Dacca are 11.43% and 20.37%, respectively, and their annual growth rates of light index are 1.15 and 0.38, respectively.
5 CONCLUSION AND EXPECTATION
In this study, we have shown that we can access a wide range of remote sensing data and mass produce thematic products. We have also obtained a number of vital results in remote sensing monitoring of the ecological environment in the Belt and Road region. These results can provide important support for the implementation of the UN’s SDGs 2030 in the Belt and Road region.
The following conclusions can be drawn from the results. (1) The differences in zonal climate-based resource endowments, ecosystem structures, and productivity levels of 10 subregions of the Belt and Road initiative are obvious. Southeast Asia, South Asia, Central and Eastern Europe, and the Russian Far East region demonstrated good ecological conditions, rich ecological resources, and great potential for economic development. Accordingly, these subregions should be the focus of attention in the implementation of the Belt and Road initiative. The cold-temperate and cold-belt forests in Europe and northern Russia as well as the tropical rain forests in Southern Africa and Southeast Asia are important components of the global forest carbon pool. (2) The spatial distribution of solar energy resources in the Belt and Road region is affected mainly by latitude, topography, and cloud cover, among which the effect of latitude is the most prominent. The most suitable area for solar power generation is distributed mainly in the desert and sparsely vegetated areas with middle or low latitude. (3) The spatial distribution of terrestrial water balance is uneven. The China–Central Asia–West Asia Economic Corridor runs through arid regions, such as Xinjiang, Kazakhstan, and Iran. In these regions, water resources are severely scarce, and the desert ecological environment is extremely fragile. In arid oases and semihumid/semi-arid irrigated agricultural areas, atmospheric precipitation cannot meet the demand of evapotranspiration. The water deficit is supplemented by river runoff and groundwater. The contradiction between agricultural production water and ecological water is prominent, thereby leading to local ecological environment degradation. (4) Six economic corridors in the Belt and Road region are important carriers of the silk road economic belt construction. In these corridors, the regional ecological environment conditions have an important effect on the Belt and Road initiative construction. The main ecological environmental constraint factors differ across economic corridors and corridor segments; thus, the most important factor must be considered.
This study also offer insights into policy making. (1) The tropical rain forests and subtropical mountain forests in Southeast Asia and South Asia are the key areas of global biodiversity conservation. Subalpine coniferous forests in high latitudes of Eurasia grow slowly and have poor recovery. Thus, special attention should be paid to the ecological protection of these areas in the planning and construction. (2) The carrying capacity of water resources as a constraint factor should be considered in developing the layout plan for regional industrial optimization. Given that ecological environment protection and water resource carrying capacity are constraint factors, the scientific formulation of the regional industrial development plan of the Belt and Road initiative should consider the balance between production water, domestic water, and ecological water to protect the terrestrial ecosystem and conserve water resources effectively. (3) Policy support must be increased, a smart grid must be developed, a scientific layout must be developed for the utilization of land solar energy resources under the Belt and Road initiative, and the international action against climate change must be strengthened.
Future research will focus on global climate change, global carbon sinks, and other hot issues. Subsequent studies may investigate further on the improvement of the comprehensive observation and analysis of the global carbon cycle, water cycle, and energy cycle system; strengthening the global change response of global ecosystems and biodiversity; interaction between key processes of global water cycle and global climate change; influencing mechanism of global radiation budget and energy distribution; energy transfer and transformation between the ocean and atmosphere; forecast and formation mechanism of heavy rains, typhoons, and other disastrous weather events. To meet the growing demand for studies on remote sensing-based ecological environmental monitoring in the Belt and Road region, we will attempt in the future to improve the utilization rate of domestic satellite data; increase the product time series length; enhance the precision of the thematic products to diversify monitoring elements; globalize the monitoring region; focus on the key elements, key regions, and key types of global ecological environment; completely harness the advantages of remote sensing technology; monitor the dynamic change of ecological environment elements by remote sensing; and lay the foundation for global change analysis.
Acknowledgments: Thanks to China Center for Resources Satellite Data and Application, Statellite Environment Center of Ministry of Environmental Protection, National Staellite Meteorological Center for providing the domestic satellite remote sensing data. Thanks to the Computer Network Information Center of Chinese Academy of Sciences for providing the computing resources and storage resources. Thanks to the National Geomatics Center of China for providing the fundamental geographic map. Thanks to prof. Liu Jiyuan, Ji Changyuan, Li Jiahong, Zhang Songmei, Gao Zhihai, Zhang Yili, Shi Jiancheng, Li Zengyuan, etc., and thanks to the other specialists in advisory group, expert group and editorial team of the Global Ecosystems and Environment Observation Analysis Research Cooperation (GEOARC) for providing many constructive opinions and suggestions to the Belt and Road ecological environment monitoring.
参考文献(References)
-
Guo H D. 2018. Steps to the digital Silk Road. Nature (554): 25–27.
-
Jiang W, He G J, Peng Y, Wang G Z and Wang M M. 2017. Application potentiality and prospects of nighttime light remote sensing in ‘the Belt and Road’ initiative. Journal of University of Chinese Academy of Sciences, 34 (3): 296–303.
-
Li A J, Zhu X, Zhao B Y, Duan C Q and Yang L. 2004. Preliminary study on construction of indicator system of dynamic monitoring and assessment of eco-environments. Environmental Monitoring in China, 20 (4): 35–38.
-
Li D R, Yu H R and Li X. 2017. The spatial-temporal pattern analysis of city development in countries along the Belt and Road initiative based on nighttime light data. Geomatics and Information Science of Wuhan University, 42 (6): 711–720.
-
Liao K, Zheng D X, Chen W H and Sha J M. 2003. Research and design of ecological environmental dynamic monitoring and management information system in Fujian province. Geo-information Science, 5 (1): 22–27.
-
Liao K, Cheng X F, Wu J S and Cheng W H. 2006. Application of high resolution remotely-sensed data to monitoring change of land use. Science of Surveying and Mapping, 31 (3): 11–15.
-
Luo H J, Bai H L, Wang W J, Shen W M, Zhang F and Liu X M. 2006. The study of land-ecosystem classification for eco-monitoring & eco-management. Environmental Monitoring in China, 22 (5): 57–61.
-
Mulder V L, S De Bruin, Schaepman M E and Mayr T R. 2011. The use of remote sensing in soil and terrain mapping-A review. Geoderma, 162 (1): 1–19.
-
Qi Q W, He D M, Zou X P, Jiang L L and Li J. 2005. Theory method and technology of 3S based eco-monitoring, evaluation and adjustment along Yunnan border area. Progress in Geography, 24 (2): 1–12.
-
Shi Z H, Wang T W, Cai C F, Zhao C H and Yang K W. 2006. Monitoring Environmental Effect of Ecological Restoration with Remote Sensing in the Three Gorges Reservoir Area. Journal of Natural Resources, 21 (3): 473–480.
-
Wang J, Guo X D and He T. 2003. Tentative study on indication system of monitoring and assessment of regional resource and eco-environment. Resources and Environment in the Yangtze Basin, 12 (6): 574–578.
-
Wu B F, Li M M, Yan C Z, Zhang L, Wang Y M, Zhang S W and Zhou W C. 2005. Environment monitoring over 1997-2002 with remote sensing in 5 nationa1 environmental project sites. Journal of Remote Sensing, 9 (1): 32–38.
-
Zhang Z X, Yang C J and Tian G J. 2003. Comprehensive assessment and analysis of China eco-environment based on spatial data. Journal of Remote Sensing, 7 (1): 58–65.
-
Guo H D. 2018. Steps to the digital Silk Road. Nature, 554 (7690): 25–27. [DOI: 10.1038/d41586-018-01303-y]
-
( 江威, 何国金, 彭燕, 王桂周, 王猛猛. 2017. 夜光遥感在" 一带一路”战略中的应用潜力展望. 中国科学院大学学报, 34 (3): 296–303. )
-
( 李爱军, 朱翔, 赵碧云, 段昌群, 杨良. 2004. 生态环境动态监测与评价指标体系探讨. 中国环境监测, 20 (4): 35–38. )
-
( 李德仁, 余涵若, 李熙. 2017. 基于夜光遥感影像的" 一带一路”沿线国家城市发展时空格局分析. 武汉大学学报·信息科学版, 42 (6): 711–720. )
-
( 廖克, 郑达贤, 陈文惠, 沙晋明. 2003. 福建省生态环境动态监测与管理信息系统的设计. 地球信息科学, 5 (1): 22–27. )
-
( 廖克, 成夕芳, 吴健生, 陈文惠. 2006. 高分辨率卫星遥感影像在土地利用变化动态监测中的应用. 测绘科学, 31 (3): 11–15. )
-
( 罗海江, 白海玲, 王文杰, 申文明, 张峰, 刘小曼. 2006. 面向生态监测与管理的国家级土地生态分类方案研究. 中国环境监测, 22 (5): 57–61. )
-
( Mulder V L, De Bruin S, Schaepman M E and Mayr T R. 2011. The use of remote sensing in soil and terrain mapping-A review. Geoderma, 162 (1-2): 1–19. [DOI: 10.1016/j.geoderma.2010.12.018] )
-
( 齐清文, 何大明, 邹秀萍, 姜莉莉, 李晋. 2005. 云南沿边境地带生态环境3S监测、评价与调控研究. 地理科学进展, 24 (2): 1–12. [DOI: 10.11820/dlkxjz.2005.02.001] )
-
( 史志华, 王天巍, 蔡崇法, 赵春华, 杨开望. 2006. 三峡库区乐天溪流域生态修复效果的遥感监测研究. 自然资源学报, 21 (3): 473–480, 503. [DOI: 10.11849/zrzyxb.2006.03.018] )
-
( 王静, 郭旭东, 何挺. 2003. 区域资源与生态环境综合监测及评价指标体系初探. 长江流域资源与环境, 12 (6): 574–578. )
-
( 吴炳方, 李苗苗, 颜长珍, 张磊, 王一谋, 张树文, 周万村. 2005. 生态环境典型治理区5年期遥感动态监测. 遥感学报, 9 (1): 32–38. [DOI: 10.11834/jrs.20050105] )
-
( 张增祥, 杨存建, 田光进. 2003. 基于多源空间数据的中国生态环境综合评价与分析. 遥感学报, 7 (1): 58–65. [DOI: 10.11834/jrs.20030111] )