|
收稿日期: 2016-06-13优先数字出版日期: 2016-09-25
基金项目: 国家“千人计划”外专千人长期项目(编号: WQ20141100224);国家重大科学研究计划(编号: 2015CB953702)
第一作者简介:
MENENTI Massimo(1949-), 男, 教授, 博士生导师, 研究方向为遥感对地观测、全球陆地水资源及水循环、全球植被生态系统遥感等。E-mail:M.Menenti@radi.ac.cn
中图分类号: TP79
文献标识码: A
文章编号: 1007-4619(2016)05-0946-10
|
摘要
遥感定量反演地表参数时间序列产品已被广泛应用于植被动态变化、全球气候变化、防灾减灾及环境保护等领域。由于卫星观测往往受到大气条件(如云、气溶胶、水汽等)以及传感器自身稳定性的影响等,许多由卫星观测反演得到的陆表产品,如归一化差值植被指数(NDVI)、叶面积指数(LAI)、地表温度(LST)、微波极化亮温(PDBT)等存在严重的时空不连续问题。为了获取时间序列上连续、空间上完整的地表参数遥感产品以满足长时序的陆面过程分析与建模的需求,目前已发展多种遥感时间序列重建模型。本文介绍了基于傅里叶变换的时间序列谐波分析(HANTS)方法,能够识别并去除受到云和大气影响的像元(噪声),对原始时序数据进行时间插值来重建连续时间序列的数据,并针对其面向多种不同时空尺度的遥感反演地表参数以及在非洲、南美洲、欧洲、中国及印度等全球不同地区的应用研究进行了综述,包括植被动态变化对于气候变化及流域水循环过程的响应、干旱监测、基于土壤含水量饱和度时间序列分析的洪涝灾害易发区监测、遥感估算地表蒸散发时间尺度扩展等方面的研究,充分阐释了遥感时间序列产品在地气相互作用的各类研究领域的应用。
关键词
傅里叶序列 , 物候 , 植被制图 , 洪涝监测 , 年际变化
Abstract
Satellite observations of the terrestrial biosphere cover a period of time sufficiently extended to allow the calculation of a reliable climatology. The latter is particularly relevant for studies of vegetation response to climate variability. Observations from space of the land surface are hampered by clouds at shorter wavelength and affected by water in the atmosphere in the microwave range. Both polar orbiting and geostationary satellites have a revisit frequency high enough to allow for some redundancy relative to the processes being observed, so that time series where a fraction of observations are removed and the resulting gaps filled are still very useful to monitor land surface processes. We applied the Harmonic ANalysis of Time Series (HANTS) to identify and remove anomalous observations (outliers) and to fill the resulting gaps. The HANTS algorithm has been widely used to reconstruct time series of Normalized Difference Vegetation Index (NDVI), Leaf Area Index (LAI), Land Surface Temperature (LST) as well as the Polarization Difference Brightness Temperature (PDBT) during the past 30 years to remove random noise or eliminate cloud/snow contamination. Several studies in North and Southern Africa, South America, Europe, China and India captured the response of the land surface to climate forcing, modulated by water availability across a range of temporal scales from hourly to decennial. These studies are reviewed to illustrate how the analysis of time series of different land surface properties reveal processes and interactions.
Key words
Fourier series , phenology , vegetation mapping , flood monitoring , interannual variability
1 INTRODUCTION
Satellite observations of the terrestrial biosphere cover a period of time sufficiently extended to allow the calculation of a reliable climatology. The latter is particularly relevant for studies of land surface response to climate variability. Observations from space of the land surface are hampered by clouds at shorter wavelength and affected by water in the atmosphere in the microwave range. Both polar orbiting and geostationary satellites have a revisit frequency high enough to allow for some redundancy relative to the processes being observed, so that time series where a fraction of observations are removed and the resulting gaps filled are still very useful to monitor land surface processes.
This paper reviews studies done by the authors since the late 1980s on the use of time series analysis techniques to extract concise information from extended time series of multispectral satellite data capturing large areas. Two basic methods have been used: the Fast Fourier Transform, especially in the earlier studies, and Harmonic Analysis in more recent work. Since the first studies, work has been relying on the global radiometric data collected by AVHRR and later by MODIS, FY-2C, AMSR-E, SSM/I and SPOT 4 and SPOT 5, with investigations performed in different continents. It should be noted that available satellite data records are approaching 40 years, since e.g. microwave radiometry data are available since 1978(Nimbus-7/SMMR)and multi-spectral VNIR radiometry has an even longer history(i.e. NOAA-2/VHRR since 1972). These climate data records pave the way for a truly climatological approach to the observation of land surface signals, with the additional strength of the spatial detail provided by imaging sensor systems. Methods for the analysis of time series of image-data appear perfectly suited to extract information from current data assets and build new knowledge on the response of the land surface to weather and climate forcing.
The applications supported by published results are:
(1)The identification and mapping of zones characterized by a similar response of terrestrial vegetation to environmental forcing(Azzali & Menenti, 1999, 2000; González-Loyarte & Menenti, 2008; González-Loyarte et al., 2008);
(2)The determination and characterization of terrestrial vegetation response to climate variability over any period of time covered by available time series of satellite data(Roerink et al., 2000, 2003);
(3)Early warning of anomalies detected during the growth of terrestrial vegetation by using indicators of photosynthetic activity such as Normalized Difference Vegetation Index(NDVI)and Fraction of Absorbed Photosynthetically Active Radiation(fAPAR)(Jia et al., 2012; Lu et al., 2015);
(4)Determination of the time-lag in the response of vegetation growth to precipitation(van Hoek, 2016; van Hoek et al., 2016);
(5)Determination of the phenological response to water availability in relation with water management in a watershed(Jia et al., 2011);
(6)Monitoring of the spectral thermal admittance of the land surface(Ghafarian et al., 2012; Ghafarian, 2015);
(7)Estimation and mapping of air temperature(Alfieri et al., 2013);
(8)Removal of clouds and shadows and reconstruction of multi-spectral images at high spatial resolution(Alfieri et al., 2016);
(9)Monitoring of the thermal load to assess the risk of forest fires(Maffei et al., 2013);
(10)Monitoring of actual evapotranspiration(Jia et al., 2009);
(11)Retrieval of the fractional abundance of water-saturated soil(Shang et al., 2015).
Most of the work mentioned in this study has been reviewed in more detail by Menenti et al.(2010, 2016). Here we aim at providing a concise summary of new knowledge and applications, without entering in the details of the methods developed and applied over time, but conveying a sense of the progress achieved when taking all our past studies together.
The Fast Fourier Transform(FFT)and the Harmonic ANalysis of Time Series algorithm(HANTS)have been developed and applied to time series of satellite observations, e.g. NDVI and Land Surface Temperature(LST), to study vegetation phenology and land surface climate(Menenti et al., 1993, 2010; Verhoef, 1996; Roerink et al., 2000, 2003; Julien et al., 2006; Jia et al., 2011; Moody & Johnson, 2001; Alfieri et al., 2013; Ghafarian et al., 2012). Different from the FFT using all observations regardless of quality, HANTS identifies and removes outliers in data samples.
A global study of the accuracy of HANTS in the reconstruction of NDVI time series has been completed(Zhou et al., 2015). The overall reconstruction error was divided into gaps related error and fitting method related error, then the gaps and fitting-method related errors were quantified independently. The method was applied by Zhou et al.(2015)to map globally the spatial pattern of HANTS performance in the reconstruction of NDVI time series. We have also applied other methods(Ghafarian et al., 2012; Ghafarian, 2015), such as the Multichannel Singular Spectrum Analysis(M-SSA, Broomhead et al., 1987), but we will not describe this method here.
It should be noted that the same method(HANTS, M-SSA or possibly other methods for time-series analysis)can be applied in many different ways to extract fundamentally different information from the signal captured by a time series of observations. Many land surface processes yield periodic signals, resulting from the combination of periodic or quasi-periodic forcing at multiple frequencies. Fourier-based methods to analyze time series of observations of land surface properties offer multiple benefits:(1)the decomposition of a complex signal into its periodic components provides useful insights into both weather and climate forcing and the response of the land surface(Menenti et al., 1993); (2)a model of the observed signal which can be used to identify and remove observations contaminated by clouds and shadows and to reconstruct the time series after removal of outliers(Menenti et al., 1993). The main difference in the nature of the information extracted is related to the length of the time series being analyzed. When a data record of climatological relevance is analyzed, the dynamics of the observed target(pixel)is captured and decomposed into periodic components. For all components with period shorter than the total length of the data record, the mean Fourier coefficients are obtained. If, for example, HANTS is applied to time series of NDVI, the Fourier coefficients provide a metric of phenology and can be used(see e.g. Azzali & Menenti, 2000)to map soil -vegetation -climate complexes, i.e. areas having similar phenology in response to soil conditions and climate. At the other hand of the temporal spectrum, the analysis of short time series, in a near-real time mode, reveals deviations from the long term climatology and can be used to construct indicators for drought early warning(see e.g. Jia et al., 2012; Lu et al., 2015).
2 METHODS
In all applications listed above we applied the HANTS algorithm, developed and described in detail by Menenti et al.(1993), Verhoef(1996), Verhoef et al.(1996)and Roerink et al.(2000). The first application of Fourier series to analyze time series of satellite data was described by Menenti(1984)to obtain a constant local solar time in a time series of METEOSAT LST images stretching from Saudi Arabia to Morocco.
The HANTS algorithm is based on the concept of discrete Fourier transform(Menenti et al., 1993; Verhoef, 1996; Verhoef et al., 1996; Roerink et al., 2000)to model time series of satellite data.
A temporal sequence of N observations yi, i=1 to N can be described by a Fourier series as
| $ {{\rm{y}}_i} = {a_0} + \sum\limits_{j - 1}^M {{a_j}} {\rm{cos}}\left({{\omega _j}{t_i} - {\varphi _j}} \right) $ | (1) |
where ωj is the frequency of jth harmonic term in the Fourier series, ti is the time at which the ith sample was taken, M is the number of frequencies of the Fourier series(M≤N), αj and φj are the amplitude and the phase of the jth harmonic term respectively. Because the zero frequency has no phase, the amplitude related to the zero frequency, a0, is equal to the average of all N observations of y. The harmonic frequencies are a base frequency(i.e. ω1=2
| $ {\omega _i} =(2\pi /N)\times i,\;\;\;{\rm{where}}\;\quad \quad i = 1,2,\; \ldots,N $ | (2) |
In the HANTS algorithm after selecting the number of frequencies(M)and the frequencies(ωj), the unknown parameters of the Fourier series are the amplitudes aj and the phase φj values, which are determined by fitting the time series of observations for each pixel, i.e. generating maps of aj and φj.
From a signal processing point of view, HANTS performs two tasks:(1)identifying and removing outliers and cloudy observations, and(2)gap-filling of the remaining valid observations by temporal interpolation. HANTS handles the Fourier analysis as a curve fitting problem using a weighted least squares solution. Each observation in the time series is assigned a weight of one or zero for good and bad(outliers)data, respectively. In order to find outliers and cloud contaminated observations, HANTS performs the curve fitting iteratively. In the first step, the least square curve fitting is performed using all data in the series. In the second step, observations are compared to the curve determined in the 1st iteration. Observations that deviate more than a pre-defined threshold are removed by assigning a zero weight to them. The remaining data are used to compute the least square curve fitting again, and the outliers are identified and removed again using the same threshold as in the first step. This iteration procedure is repeated until either all the remaining observations are within the pre-defined threshold or the number of remaining data becomes less than the number of parameters by which the curve is described. The accuracy of both the estimated Fourier coefficients and of the reconstructed signal depend on the appropriate setting of several parameters. A detailed explanation on HANTS parameter setting can be found in Roerink et al.(2000).
3 APPLICATIONS
The applications listed in the introduction can be grouped into fewer and broader categories to clarify the bio-geophysical relevance of the information extracted from the observed signals.
3.1 Mapping zones having a similar dynamics
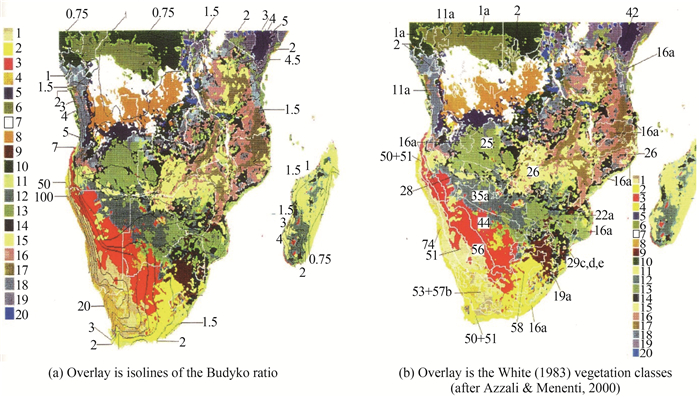
Under this category we group the study by Azzali & Menenti(1996, 1999, 2000), who mapped soil -vegetation -climate complexes in Southern Africa(Fig. 1)using AVHRR/NDVI data over the period 1981—1991 and by González-Loyarte & Menenti(2008), González-Loyarte et al.(2008)who mapped plant communities of shrub lands and open forests species in Western Argentina, also using AVHRR/NDVI data(1982—1991). Both studies showed that the zones mapped as having similar temporal signa-tures correlated with isolines of the Budyko radiational index of dryness(Budyko, 1958), thus confirming the response of the phenological signatures captured by the Fourier spectra to climate forcing.

The value of decomposing a complex temporal signal into its periodic components was documented by Ghafarian et al.(2012)and Ghafarian(2015)who used three years of hourly observations of the Land Surface Temperature(LST)retrieved from Fengyun-2C(FY-2C)/Visible and Infrared Spin Scan Radiometer(S-VISSR)data. A three year time series(2008—2010)of gap-free daily and hourly LST and actual evaporation and soil heat flux derived from geostationary data collected by the FY-2C satellite was reconstructed for a large area including the Qinghai -Tibetan Plateau and the surrounding river basins(Faivre, 2014; Ghafarian, 2015). Two time series were used in this study: soil heat flux(Faivre, 2014)at the land -atmosphere interface(forcing)and land surface temperature(response). The Fourier spectra of both series were calculated, then the land surface thermal admittance(Menenti, 1984)was calculated for all significant periodic components. The thermal admittance is the ratio of the amplitude of a periodic component of the heat flux to the amplitude of LST at the same frequency. If the observed signal includes multiple periodic components, the thermal admittance can be calculated for all components to obtain the land surface spectral thermal admittance. Since periodic components of increasing period penetrate to increasing depths into the soil, the spectral thermal admittance carries information on the vertical structure of the soil. Ghafarian et al.(2012)and Ghafarian(2015)used the amplitudes of the periodic components of LST(t)to map areas having similar thermal behavior. They also inverted the spectral thermal admittance to estimate the thermal properties and thickness of soil layers.
In the case of complex terrains, local spatial variability of climate is not negligible and depends on several factors, among them topography, soil humidity and land use. This leads to the need for detailed spatial patterns of air temperature Ta. The sparse distribution of stations, as well as the frequently insufficient temporal coverage, severely constrains the study of climate-related processes in complex landscapes. Alfieri et al.(2013)developed a new procedure to map time series of air temperature(Ta)at fine spatial resolution using time series analysis of satellite-derived LST observations, specifically all the observations captured daily in the period 2001—2010 by MODIS onboard both the Terra and Aqua satellites. The method assumes that air temperature is known at a single(reference)location, such as in gridded climate data with grid size of the order of 35 km×35 km. Alfieri et al.(2013)modelled the LST spatial and temporal pattern within each grid cell by the pixel-wise ratios r(x, y, t)of the LST at any location to the LST at a reference location. The analysis of these patterns over a decade demonstrated that their intra-annual variability is not negligible, with significant seasonality, even if it is stable throughout the years. The estimates of Ta were evaluated against observations at five weather stations within the 35 km×35 km grid and for the same period 2010—2011. The method has also been evaluated against Ta observations for earlier periods of time(1984—1988), although available data were rather sparse in space and time, slightly larger deviations were obtained.
3.2 Early detection of anomalies
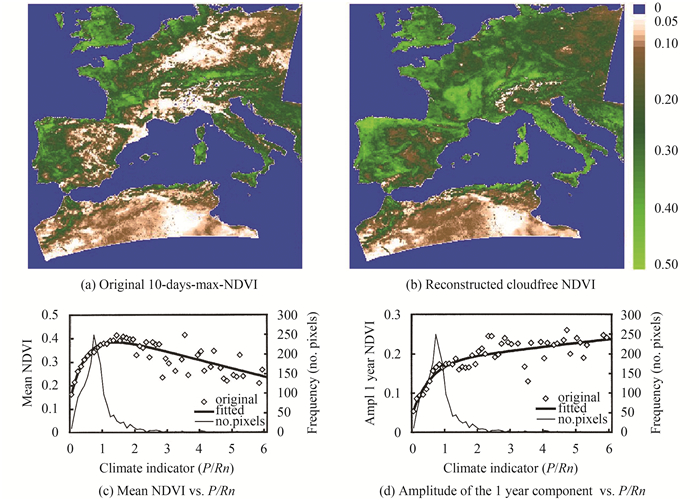
(1)Europe and North Africa. Work done towards mapping the “soil -vegetation -climate complexes”(Fig. 1)has documented a close relationship between vegetation type, including phenology, and aridity, which was measured by using the Budyko ratio(B). The next question is whether a similar relationship exists between temporal patterns or, in other words, whether the response of vegetation phenology, measured by time series of NDVI(or fAPAR)observations, can be related to climate forcing, measured by time series of Budyko ratio.This relationship is confirmed by the strong correlation of both mean NDVI and the amplitude of the one year component with the value of B(Fig. 2)documented by Roerink et al.(2000, 2003). These results(Fig. 2)were applied(see also Menenti et al., 2010)to estimate the sensitivity of foliar phenology to water availability.
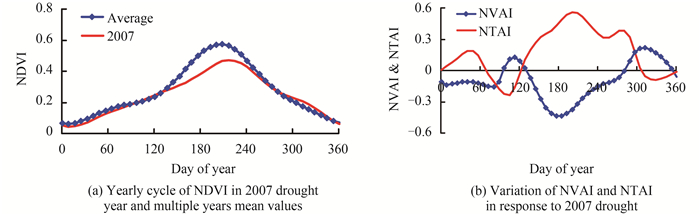
Given the sensitivity of foliar phenology documented above, a step further led to develop metrics of anomalies in photosynthetic activity and LST towards the early detection of drought. Two new drought indicators based on satellite observations of vegetation index and LST, i.e. the Normalized Temperature Anomaly Index(NTAI)and the Normalized Vegetation Anomaly Index(NVAI)were developed by Jia et al.(2012)and applied to monitor drought events in different regions in China and India. The sensitivity of the indicators and of their anomalies to drought conditions and severity was also evaluated against drought assessments by operational drought monitoring services. NTAI and NVAI time series data were extracted for the drought-prone regions in China and India to evaluate the performance of these indicators in detecting and monitoring drought events. The data used by Jia et al.(2012)consisted of 30 MODIS tiles covering most of China and India for every 16-day intervals from 2001 to 2010.
The sensitivity of NTAI and NVAI to drought was documented(Jia et al., 2012)by e.g. the analysis of a drought event in 2007 in Inner-Mongolia(close to Xilinhot). The year started with a slightly negative anomaly in precipitation, above average precipitation in March and persistent below average precipitation from April through July. The NDVI was slightly below average(Fig. 3), while both NTAI and NVAI showed large anomalies, with a fast response to anomalies in precipitation(Fig. 3).
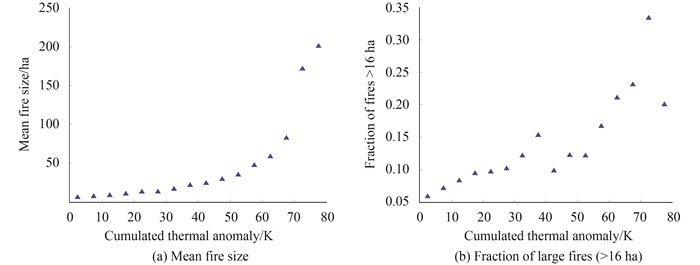
(2)Italy -Campania. The rapid response of thermal anomaly to drought suggested to explore monitoring of thermal anomalies as a predictor and an indicator of forest fire hazard(Maffei et al., 2013). Time series of MODIS daily retrievals of LST during 2000—2006 were used to characterize LST anomalies and thermal load. As a reference, data on about 4400 actual forest fires occurred in the Campania region during the same period were applied. Pixel-wise Fourier coefficients estimated with HANTS, i.e.yearly mean LST value, amplitude and phase of each harmonic were evaluated as predictors of fire occurrence and fire size. The daily LST time series were also used to calculate time series of anomalies and cumulated anomalies. The daily anomaly was defined as the difference between the current LST value at a given pixel and the multi-annual mean LST value at the same pixel given by the Fourier series determined over the entire 2000—2006 period.
The Cumulated Thermal Anomaly(CTA)was a better predictor of fire size(Maffei et al., 2013). The CTA is a measure of heat "accumulated" in a certain area, providing more direct information on the prolonged exposure of vegetation to stress conditions. This is reflected in the prediction of expected mean fire size over two orders of magnitude(Fig. 4), leading to more meaningful fire hazard maps as compared to the ones based on the Thermal Anomaly(TA). CTA is also a good predictor of the proportion of large fires across a larger size range(Maffei et al., 2013).
3.3 Seasonal response of vegetation to water availability
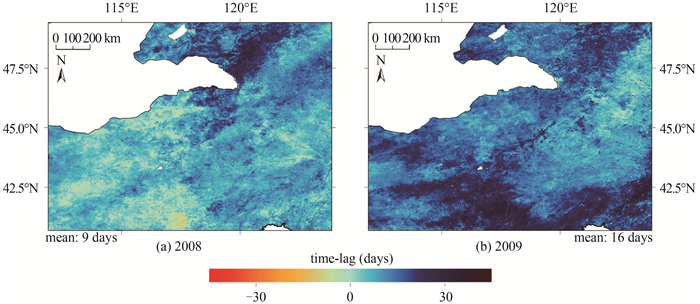
The results reviewed above document the sensitivity of vegetation to water availability, but raise multiple questions related to how and with which delay does terrestrial vegetation respond to water availability. The time lag between anomalies in precipitation and vegetation activity plays a critical role in early drought detection as crop yield losses are caused by precipitation shortages, at least in rainfed agriculture. van Hoek(2016)and van Hoek et al.(2016)explored a new approach to estimate the time lag between a forcing(precipitation)and a response(NDVI)signal by applying cross-spectral analysis in the frequency domain. The cross-spectral analysis was applied pixel-wise, with the power-spectrum applied as a metric of the cause -effect relationship, to determine the phase-lag for all significant and coherent periodic components. The study by van Hoek(2016)and van Hoek et al.(2016)focused on a dry and a wet year and only the phase lag of the annual component of the forcing and response signal was determined and interpreted, since this was the dominant component. In the wet year with above-average precipitation, the phase lag was rather similar for all land cover types. In the dry year, the phase lag increased by 7.0 days on average, but with specific response signals for the different land cover types(Fig. 5). van Hoek(2016)and van Hoek et al.(2016)interpreted the phase lag against the soil water-holding capacity and observed a slightly higher phase lag in the dry year for soils with a higher water-holding capacity.
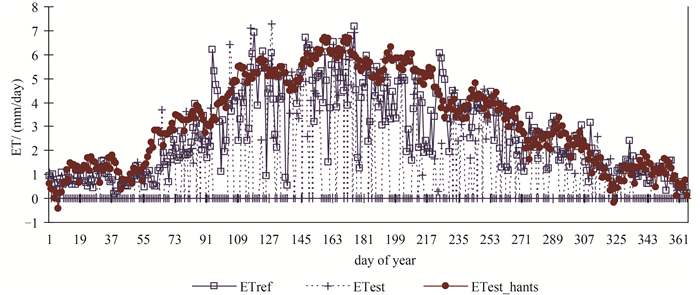
To assess water availability and monitor its evolution, the evaporation and transpiration within heterogeneous terrestrial landscapes must be known. Jia et al.(2009)used daily MODIS data and a surface energy balance algorithm to estimate actual ET in the delta of the Yellow River, China. Because of clouds, this approach gave pixel-wise estimates of actual ET but irregularly spaced in time. Moreover, some estimates were based on MODIS observations not identified as cloudy, thus rejected, to yield a rather noisy ET time series(Fig. 6). HANTS was applied to identify and remove outliers, then fill the gaps. The gap-filled time series of actual ET for a "reed -swamp" pixel with unlimited water supply was in good agreement with reference ET. This study also demonstrated that it was not necessary to identify outliers in the time series of input variables(NDVI, LST and albedo)prior to the calculation of ET.
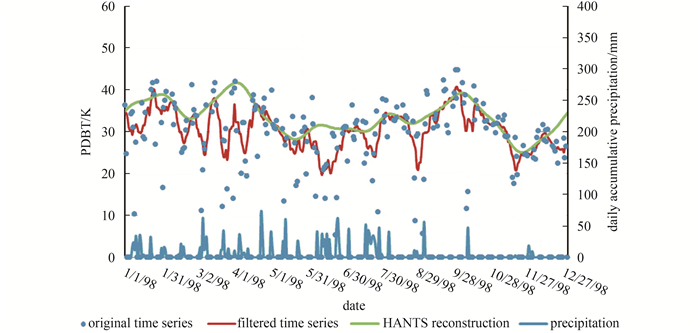
To observe, understand and model the terrestrial water cycle, knowledge of soil water storage is critical. Observations by microwave radiometers are applied to retrieve soil water content, snow water equivalent and water extent, and atmospheric effects are much smaller than at shorter wave-lengths. Shang et al.(2015)applied observations of the Polarization Difference Brightness Temperature(PDBT)at 37 GHz to retrieve the water extent even under dense vegetation. Due to the revisit frequency and swath width of microwave radiometers on polar orbiting satellites, time series of passive microwave data will have gaps of 3—5 days. To generate a consistent, gap-free daily time series, filtering or smoothing algorithms need to be applied. In addition, the effects of rain drops on microwave ground surface observations at 37 GHz are not negligible. Geo-location and resampling introduce random errors in the conversion from swath Brightness Temperature(BT)to the gridded data. Radiometric noise, such as the reference warm-up, also has an additional and unpredictable impact on observed BT. Erroneous observations need therefore to be identified and removed. In this case, we applied the HANTS algorithm described earlier(Menenti et al., 1993; Roerink et al., 2000; Verhoef, 1996)to remove noisy samples and to fill gaps(Fig. 7). The result was a much cleaner signal that was successfully applied to retrieve the fractional abundance of water-saturated soil.
The decomposition of a complex signal into simpler periodic components makes it possible to understand the response of vegetation to different processes determining water availability. Jia et al.(2011)studied the phenological response of vegetation in the arid lower reach of the Heihe River basin in China, where water availability in spring and summer is determined by:(1)snowmelt in the upper reaches, (2)rainfall in the upper and middle reaches and(3)water diversions for irrigation in the middle and lower reaches.
Jia et al.(2011)evaluated whether the South-North(S-N)propagation of the fluctuations in stream flow through the drainage channels and the shallow aquifer system had any influence on the timing of peak green-up, by calculating the mean phase value in the East-West direction, i.e. over all columns of the 12-month phase image for each row, and plotted such mean value in the S-N direction, i.e. along the rows of the same image(Fig. 8).
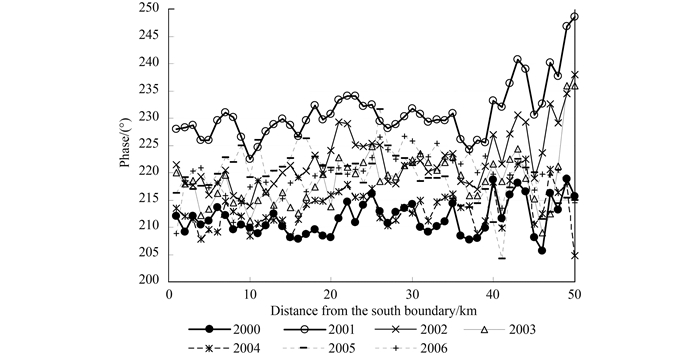
If we take the entire drainage system into account, we will have a combination of rapid propagation downstream along the drainage channels and slower outwards propagation from each drainage channel into the shallow aquifer. This mechanism is likely to explain the absence of time lag in peak green-up during the wetter years and the fact that a time lag does appear only in the northern, drier portion of the Ejin Oasis and only in drier years.
4 CONCLUSIONS
The review presented here illustrates the results obtained over about 30 years by applying time series analysis techniques to extract concise information from extended time series of large area multispectral satellite data.
The materials summarized above show that observations from space of surface reflectance in the visible, near-infrared and shortwave infrared and of emittance in both the thermal infrared and the microwave spectral range are affected by gaps in the data records and by atmospheric effects, namely clouds in the thermal infrared and precipitation at 37 GHz. This notwithstanding, such observations are still useful, as demonstrated by the applications described in this review. The combination of gaps and outliers in the data record requires additional processing to generate consistent time series of at-surface observations and two aspects need to be mentioned. First, the data record must be somewhat redundant with respect to the process to be observed, i.e. the sampling interval must be shorter than the inherent temporal scale of variability of observed variables and processes. If this is the case, methods like HANTS can be applied to model the observed time series with fewer and irregularly spaced valid observations of the land surface.
The results summarized and reviewed here open a two-fold perspective for further research:
(1)The abundance of space-borne observations of the global land surface which span 30 years or more, has a climatological relevance far superior to what was achievable with the data available 25 years ago when this research began. Therefore, this invaluable source of information deserves the most urgent attention, by a deeper and more robust understanding of the observed response of the terrestrial biosphere to climate variability and, specifically, to inter-annual variability;
(2)Both methods and data have become ripe enough to develop further an efficient and cost-effective early warning system for drought events, based directly on observations of vegetation conditions from space.
参考文献(References)
-
Alfieri S M, De Lorenzi F, Menenti M.2013.Mapping air temperature using time series analysis of LST:the SINTESI approach. Nonlinear Processes in Geophysics, 20 (4): 513–527. DOI: 10.5194/npg-20-513-2013.
-
Alfieri S M, Ghafarian Malamiri H R, Akdim N and Menenti M.2016.Reconstruction of cloud-free time series of SPOT TAKE5 multispectral data.Proceedings ESA Living Planet Symposium 2016:(in press)
-
Azzali S and Menenti M.1996.Fourier analysis of temporal NDVI in the Southern African and American continents.Utrecht:BCRS
-
Azzali S, Menenti M.1999.Mapping isogrowth zones on continental scale using temporal Fourier analysis of AVHRR-NDVI data. International Journal of Applied Earth Observation and Geoinformation, 1 (1): 9–20. DOI: 10.1016/S0303-2434(99)85023-5.
-
Azzali S, Menenti M.2000.Mapping vegetation-soil-climate complexes in southern Africa using temporal Fourier analysis of NOAA-AVHRR NDVI data. International Journal of Remote Sensing, 21 (5): 973–996. DOI: 10.1080/014311600210380.
-
Broomhead D S, Jones R, King G P and Pike E R.1987.Singular system analysis with application to dynamical systems//Pike ER, LugaitoLA, eds.Chaos, Noise and Fractals.Bristol:Adam Hilger:15-27
-
Budyko M I.1958.The Heat Balance of the Earth's Surface. US Department of Commerce, Washington, D.D., 259 :
-
Faivre R D.2014.Multi-Sensor Remote Sensing Parameterization of Heat Fluxes over Heterogeneous Land Surfaces.The Netherlands:Delft University of Technology[DOI:10.4233/uuid:ae587df2-905d-4746-b4ae-2c40a649fc58]
-
Ghafarian H R.2015.Reconstruction of Gap-Free Time Series Satellite Observations of Land Surface Temperature to Model Spectral Soil Thermal Admittance.The Netherlands:Delft University of Technology[DOI:10.4233/uuid:63dc3402-9fd6-4594-a00e-7aa5ae2501aa]
-
Ghafarian H R, Menenti M, Jia L, den Ouden H.2012.Reconstruction of cloud-free time series satellite observations of land surface temperature. EARSeL eProceedings, 11 (2): 123–131.
-
González-Loyarte M M, Menenti M.2008.Impact of rainfall anomalies on Fourier parameters of NDVI time series of Northwestern Argentina. International Journal of Remote Sensing, 29 (4): 1125–1152. DOI: 10.1080/01431160701355223.
-
González-Loyarte M M, Menenti M, Diblasi A M.2008.Modelling bioclimate by means of Fourier analysis of NOAA-AVHRR NDVI time series in Western Argentina. International Journal of Climatology, 28 (9): 1175–1188. DOI: 10.1002/joc.1610.
-
Jia L, Hu G C, Zhou J and Menenti M.2012.Assessing the sensitivity of two new indicators of vegetation response to water availability for drought monitoring//Proceedings of the SPIE 8524, Land Surface Remote Sensing.Kyoto, Japan:SPIE[DOI:10.1117/12.977416]
-
Jia L, Shang H, Hu G, Menenti M.2011.Phenological response of vegetation to upstream river flow in the Heihe River basin by time series analysis of MODIS data. Hydrology and Earth System Sciences, 15 (3): 1047–1064. DOI: 10.5194/hess-15-1047-2011.
-
Jia L, Xi G, Liu S, Huang C, Yan Y, Liu G.2009.Regional estimation of daily to annual regional evapotranspiration with MODIS data in the Yellow River Delta wetland. Hydrology and Earth System Sciences, 13 (10): 1775–1787. DOI: 10.5194/hess-13-1775-2009.
-
Julien Y, Sobrino J A, Verhoef W.2006.Changes in land surface temperatures and NDVI values over Europe between 1982 and 1999. Remote Sensing of Environment, 103 (1): 43–55. DOI: 10.1016/j.rse.2006.03.011.
-
Lu J, Jia L and Zhou J.2015.Characterization of 2014 summer drought over Henan province using remotely sensed data//Proceedings of the SPIE 9808, International Conference on Intelligent Earth Observing and Applications 2015, 980812.Guilin, China:SPIE[DOI:10.1117/12.2207829]
-
Maffei C, Alfieri S M, Menenti M.2013.Characterising fire hazard from temporal sequences of thermal infrared MODIS measurements. EARSeL eProceedings, 12 (1): 1–7. DOI: 10.12760/01-2013-1-01.
-
Menenti M.1984.Physical aspects and determination of evaporation in deserts applying remote sensing techniques.The Netherlands:Instituut voor Cultuurtechniek en Waterhuishouding
-
Menenti M, Azzali S, Verhoef W, van Swol R.1993.Mapping agroecological zones and time lag in vegetation growth by means of Fourier analysis of time series of NDVI images. Advances in Space Research, 13 (5): 233–237. DOI: 10.1016/0273-1177(93)90550-U.
-
Menenti M, Jia L, Azzali S, Roerink G, González-Loyarte M, Leguizamon S and Verhoef W.2010.Analysis of vegetation response to climate variability using extended time series of multispectral satellite images//Maselli F, Menenti M, Brivio P A, eds.Remote Sensing Optical Observations of Vegetation Properties.Kerala, India:Research Signpost:131-163
-
Menenti M, Ghafarian Malamiri H R, Shang H, Alfieri S M, Maffei C and Jia L.2016.Observing the response of terrestrial vegetation to climate variability across a range of time scales by time series analysis of land surface temperature.//Bang Y, eds.Multitemporal Remote Sensing:Methods and Applications.Springer Verlag, Heidelberg:(in press)
-
Moody A, Johnson D M.2001.Land-surface phenologies from AVHRR using the discrete fourier transform. Remote Sensing of Environment, 75 (3): 305–323. DOI: 10.1016/S0034-4257(00)00175-9.
-
Roerink G J, Menenti M, Verhoef W.2000.Reconstructing cloudfree NDVI composites using Fourier analysis of time series. International Journal of Remote Sensing, 21 (9): 1911–1917. DOI: 10.1080/014311600209814.
-
Roerink G J, Menenti M, Soepboer W, Su Z.2003.Assessment of climate impact on vegetation dynamics by using remote sensing. Physics and Chemistry of the Earth, Parts A/B/C, 28 (1-3): 103–109. DOI: 10.1016/S1474-7065(03)00011-1.
-
Shang H L, Jia L, Menenti M.2015.Analyzing the inundation pattern of the Poyang Lake flood plain by passive microwave data. Journal of Hydrometeorology, 16 (2): 652–667. DOI: 10.1175/JHM-D-14-0022.1.
-
van Hoek M.2016.Drought Monitoring from Space:a Focus on Indicators, Early Detection and Development of a Web-Based Inte-grated Portal.Beijing:University of Chinese Academy of Sciences
-
van Hoek M, Jia L, Zhou J, Zheng C L, Menenti M.2016.Early drought detection by spectral analysis of satellite time series of precipitation and Normalized Difference Vegetation Index (NDVI). Remote Sensing, 8 (5): 422 DOI: 10.3390/rs8050422.
-
Verhoef W.1996.Application of harmonic analysis of NDVI time series (HANTS)//Azzali S, Menenti M, eds.Fourier Analysis of Temporal NDVI in the Southern African and American Continents.Wageningen, The Netherlands, DLO Winand Staring Centre, Report 108
-
Verhoef W, Menenti M, Azzali S.1996.A colour composite of NOAA-AVHRR-NDVI based on time series analysis (1981-1992). International Journal of Remote Sensing, 17 (2): 231–235. DOI: 10.1080/01431169608949001.
-
Zhou J, Jia L, Menenti M.2015.Reconstruction of global MODIS NDVI time series:performance of Harmonic ANalysis of Time Series (HANTS). Remote Sensing of Environment, 163 : 217–228. DOI: 10.1016/j.rse.2015.03.018.