2. 中国科学院计算地球动力学重点实验室, 北京 100049
2. Key Laboratory of Computational Geodynamics, Chinese Academy of Sciences, Beijing 100049, China
2011年3月11日,日本东北部板块边界发生9.0级地震,该地震不仅是日本海沟有记录以来的最大地震(Tajima et al., 2013),也是被现代测量仪器监测到的最大地震之一.陆地和海底GPS观测系统均监测到该地震引起的显著的同震位移(Ozawa et al., 2012; Sato et al., 2011),其中记录到的最大水平位移高达31.5 m,为分析该地震与断层运动之间的关系提供了宝贵数据(Kido et al., 2011;邵志刚等,2015).该地震不仅在震源区引起巨大的同震位移,也显著影响到中国大陆及周边区域(Zhou et al., 2012),其产生的远场位移与中国东北部的深大断裂带活动密切相关(杨少敏等,2011;殷海涛等,2013;丰成君等,2013;陈光齐等,2013).
地震不仅可能在周边地区产生同震位移,还通过周围介质的传递造成随时间变化的震后形变.震后形变的机制主要有断层余滑(Miyazaki et al., 2004; Hoechner et al., 2012; Ozawa et al., 2012)、黏滞性松弛(Politz et al., 2006; Wang et al., 2012)和孔隙流体回弹(Jónsson et al., 2003)三种.断层余滑指断层同震破裂周边区域的继续破裂,一般在震后初期表现明显,并随时间迅速衰减;黏滞性松弛效应是地震后地幔物质应力松弛引起的随时间变化的震后形变;孔隙流体回弹是孔隙水流动重新平衡的现象,持续时间较短,在以年为单位的长时间尺度的震后形变研究中可以被忽略.
2011年日本MW9.0地震后,基于GPS观测数据研究该地震引起的震后形变,分离断层余滑和黏滞性松弛效应对震后形变的影响,确定地幔黏滞性系数和岩石圈弹性层厚度,以及断层余滑的演化过程,是国际地学界的一个研究热点.在忽略黏滞性松弛效应的前提下,Silverii等(2014)研究了日本MW9.0地震震后4个月的形变,发现断层余滑主要分布在断层深度30 km和50 km之间,类似于Ozawa等(2011, Ozawa2012)的震后快速研究成果.Diao等(2014)基于震后1.5年的GPS观测数据,利用半无限空间位错理论(Wang et al., 2006, 2013),针对该强震展开研究,得到震源区岩石圈弹性层厚度为50 km,地幔黏滞性系数为8×10¹⁸ Pa·s,继而反演了该强震断层余滑模型,发现忽略地幔黏滞性松弛的影响会过高估计震后余滑.Yamagiwa等(2015)引入海底GPS观测数据,研究日本MW9.0地震震后2.5年的地壳形变,他们基于岩石圈弹性层厚度为50 km,地幔黏滞性系数为9×10¹⁸ Pa·s的地球模型(Suito and Hirahara, 1999),利用半无限空间位错理论(Fukahata and Matsu′ura, 2006)解析该区域黏滞性松弛效应,获得了震后2.5年断层余滑的演化过程,发现断层余滑的持续时间为2.5年,之后地幔黏滞性松弛效应占主导地位.总之,2011年日本MW9.0地震后,不少学者针对该强震展开了震后形变机理研究,但由于所使用的平面半空间位错理论精度有限,所依据的GPS观测数据时长不足(一般3年内),致使上述研究的结论可能精度不足,相关研究尚存进一步深入展开的空间.
鉴于此,本文基于震后4.5年的GPS观测数据,利用黏弹性球体位错理论(Tanaka et al., 2006, 2007),针对2011年日本MW9.0地震震后形变机制与震源区总体构造特征展开深入研究.该理论同时考虑了地球的可压缩性和无限层状结构,是迄今为止最完备的关于震后形变的位错理论之一(张国庆等,2015),计算精度较高.由于使用了较为完备的球体位错理论和长达4.5年的震后位移观测数据,本研究有望更准确地反演该强震震源区地幔黏滞性因子与岩石圈弹性层厚度,更精确地分离断层余滑和地幔黏滞性松弛效应,进而更准确地再现断层余滑时空演化过程.
2 2011年日本MW9.0地震震后位移场本文收集日本列岛255个GPS连续观测站数据,坐标时序从内华达大学大地测量实验室网站下载(ftp://geniss.nbmg.unr.edu),参考框架为IGS08,数据开始日期为2009年3月12日,截止日期为2015年9月12日,震后时长4.5年,以获取2011年日本MW9.0地震震后位移场.本文对搜集到的数据进行检查,删除了40个观测站的数据,其中36个观测站的时间序列存在原因不明的突跳,不能正确解释震后形变趋势,我们对比了日本地震后5.5级以上的余震与突跳站位置及突跳时间,发现突跳与余震在时间上与空间上均无对应关系.另外4个观测站在2011年日本MW9.0地震前的观测时长不足两年,无法获取准确的观测站震间运动趋势.本文采用震前2年的日采样GPS观测数据,以消除研究区域长期构造活动的影响:首先对震前2年的时间序列进行拟合,然后从震后时间序列中剔除震前变化趋势,从而得到震后4.5年的位移变化时间序列.
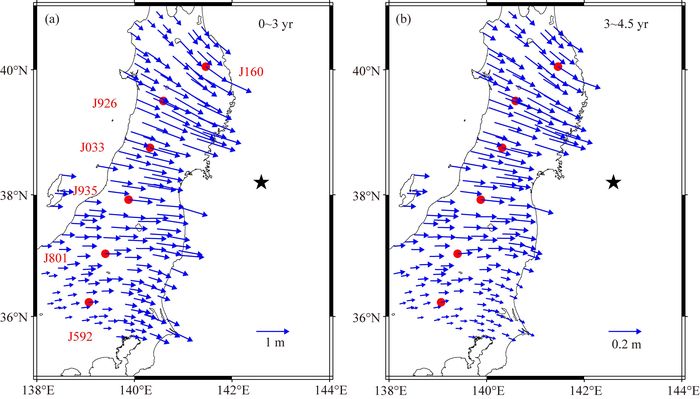
根据Yamagiwa等(2015)的研究结果可知,断层余滑集中发生在震后初期,并在震后2.5年后几乎消失.据此可知,该强震震后0~3年内的形变由断层余滑和地幔黏滞性松弛效应共同引起,并且断层余滑占主导地位;3~4.5年内震后形变完全由地幔黏滞性松弛效应引起.鉴于此,本文将观测数据分为两个时间段:震后0~3年和震后3~4.5年.图 1为这两个时间段内GPS观测到的震后位移变化.震后位移较大的观测站主要分布在北纬35°到41°范围内,2011年日本MW9.0地震引起的震后位移存在着大体平行指向日本海沟的特征,总体指向比较分散,不似同震位移集中指向震中地区(付广裕,2012).从图 1中还可以看出,日本列岛北部的观测站记录到的南北向位移明显大于南部的观测站,类似于Silverii等(2014)的观测结果.
|
图 1 GPS监测到的2011年日本MW9.0地震伴随的震后位移场 (a)震后0~3年内的累计水平位移;(b)震后3~4.5年内的累计水平位移.红色圆点为六个特征观测站(J160, J926, J033, J935, J801, J592),观测数据在图 2中详细分析,黑色五角星代表震中. Fig. 1 GPS observations of post-seismic displacements induced by the 2011 Tohoku-Oki MW9.0 earthquake (a) Post-seismic displacements from 12 March 2011 to 12 March 2014; (b) Post-seismic displacements from 12 March 2014 to 12 September 2015. The red dots indicate six GPS stations (J160, J926, J033, J935, J801, J592), whose data are analyzed in detail in Fig. 2. The black star indicates the epicenter. |

|
图 2 六个特征观测站(J160, J926, J033, J935, J801, J592) 记录的2011年日本Mw9.0地震前后位移变化时间序列 黑线表示GPS观测值,红线表示由断层余滑和黏滞性松驰效应模拟值。 Fig. 2 Observed displacement series of six stations before and after of the 2011 Tohoku-Oki Mw9.0 earthquake Black line denotes horizontal displacement of GPS observation, and red line denotes simulation of after-slip and viscoelastic relaxation. |
图 2为六个特征观测站(J160, J926, J033, J935, J801, J592) 观测到的震后位移时间序列.图 2(a1, b1, c1, d1, e1, f1)分别为六个特征观测站观测到的东西方向的位移,图 2(a2, b2, c2, d2, e2, f2)分别为六个特征观测站观测到的南北方向的位移,图中黑线为GPS观测到的水平位移,红线为由最优反演模型处的断层余滑和黏滞性松弛效应模拟得到的结果(见后续结果),可以看出观测值与模拟值吻合较好.基于震前2年观测数据获得各个观测站震间运动趋势,然后可得到该强震在各观测站引起的震后位移.分析发现,该站点的震后形变累积量约在4年的时间里超过同震形变,如此显著的震后形变资料对于研究地震周边区域地幔黏滞性参数和岩石圈弹性层构造均具有重要价值.
3 震源区地幔黏滞性系数和岩石圈弹性层厚度的反演本文利用Tanaka等(2006, 2007)的黏弹性球体位错理论,模拟2011年日本MW9.0地震后地幔黏滞性松弛效应产生的水平位移,进而反演震源区地幔黏滞性系数和岩石圈弹性层厚度.本文依据的分层球体地球模型由PREM模型改造而来(Tanaka et al., 2006, 2007).2011年日本MW9.0地震的同震破裂滑动断层模型来自Wei等(2012)的反演结果,他们基于强地震波数据和GPS观测数据反演了一个断层滑移模型,该断层模型由25×14个子断层组成,每个子断层的尺度为25 km×18 km,断层走向为201°,倾角为10°,最大滑移量为48 m,该断层模型的矩震级为9.08.
Yamagiwa等(2015)结合震后断层余滑和地幔黏滞性松弛效应,研究了2011年日本MW9.0地震后0~2.5年内的震后形变,发现该地震断层余滑的持续时间约为2.5年.因此可以将3~4.5年间的震后形变视为完全由黏滞性松弛效应引起,从而可以根据3~4.5年内GPS观测到的震后形变,确定震源区地幔黏滞性系数和地壳弹性层厚度.鉴于此,本文利用Tanaka等(2006, 2007)黏弹性球体位错理论,对震后3~4.5年内地幔黏滞性松弛效应产生的震后位移场进行模拟计算.模拟过程中,地幔黏滞性系数在(0.1~1.0)×1019 Pa·s范围内选取,步长为0.1×10¹⁹ Pa·s,岩石圈弹性层厚度在20~50 km范围内选取,步长为10 km,并计算不同地幔黏滞性系数和岩石圈弹性层厚度下的观测与模拟结果之间的均方根误差(RMS),其中采用的均方根误差计算公式为:

|
(1) |
式中,N代表GPS站点的数目,uobs为GPS观测值,ucal为理论值.
本文依据不同的地幔黏滞性系数和岩石圈弹性层厚度,分别进行理论计算,然后与GPS进行拟合,计算相应的均方根误差,获取均方根误差分布曲线(图 3),并据此求取地幔黏滞性系数和岩石圈弹性层厚度最优解.图 3展示了在不同地幔黏滞性系数和岩石圈弹性层厚度下观测与拟合结果之间的均方根误差,可以看出黏滞性系数为6×10¹⁸ Pa·s,岩石圈弹性层厚度为30 km时,理论与观测水平位移的均方根误差最小,相应的数值即为最优解.

|
图 3 不同地幔黏滞性系数和岩石圈弹性层厚度对应的拟合结果与观测值之间的均方根误差 Fig. 3 The Root Mean Square (RMS) error between the observed results and the ones calculated by the viscoelastic spherical dislocation theory, based on different viscosity of the mantle and elastic thickness of the lithosphere |
图 4为震后3~4.5年GPS观测到的水平位移(图 4a),最优拟合结果(图 4b),以及观测与理论值的差异分布图(图 4c).观测结果与最优模拟结果在整体上具有一致性,两者的差异在误差允许范围内,从而证明了Tanaka等(2006, 2007)的黏弹性球体位错理论的有效性.从图 4c中可以看出日本陆地东南和东北地区的观测值与理论差异较大,说明了震后3~4.5年内主震区域余滑基本停止,断层的两端存在一定的余滑效应.由于3~4.5年内的GPS观测数据中包含的余滑效应比例很小,其不会影响黏滞性松弛效应的解析中最优解模型的选取,但会对最优解模型处的残差值(图 3)产生微小的变化.

|
图 4 2011年日本MW9.0地震震后3~4.5年内累计水平位移的观测值与理论值 (a) GPS观测结果;(b)利用黏弹性球体位错理论计算得到的震后位移;(c)观测值与理论值的差异.黑色五角星代表震中. Fig. 4 Observed and calculated post-seismic horizontal displacements induced by the 2011 Tohoku-Oki MW9.0 earthquake 3 and 4.5 years after the event (a) Post-seismic displacements observed by GPS; (b) Post-seismic displacements simulated by the viscoelastic spherical dislocation theory; (c) Differences between observed and calculated post-seismic displacements. The black star indicates the epicenter. |
本文利用较为完备的黏弹性球体位错理论(Tanaka et al., 2006, 2007),结合较长时长的GPS观测数据(4.5年),对2011年日本MW9.0地震后由于地幔黏滞性松弛效应产生的震后位移进行了解析,获取的地幔黏滞性系数和岩石圈弹性层厚度,均应具有较高的可信度.如需进一步提高模拟结果的计算精度,则需应用基于三维不均匀地球模型的位错理论(Fu and Sun, 2010),强调地球的横向不均匀构造对地震形变的影响.
4 2011年日本MW9.0地震断层余滑和地幔黏滞性松弛效应的分离如上文所述,日本MW9.0地震震后3~4.5年期间,震后位移全部由地幔黏滞性松弛效应所引起;但震后0~3年引起的震后形变,则由断层余滑和地幔黏滞性松弛效应共同导致.总体来说,随着时间的推移,断层余滑的贡献越来越少.至于断层余滑何时结束,则是一个需要进一步研究的问题.
利用上文反演获得的岩石圈弹性层厚度(30 km)和地幔黏滞性系数(6×10¹⁸ Pa·s)最优解,可回溯计算该强震震后0~3年之间由于地幔黏滞性松弛效应导致的震后位移,然后与GPS观测进行比较,即可获取断层余滑引起的震后形变,实现两种震后变形效应的分离.选择震后3年为时间段边界,是为了有足够长的数据,可有效反演地幔黏滞性系数,同时又能够把断层余滑效应全部从地幔黏滞性松弛效应中分离出来.
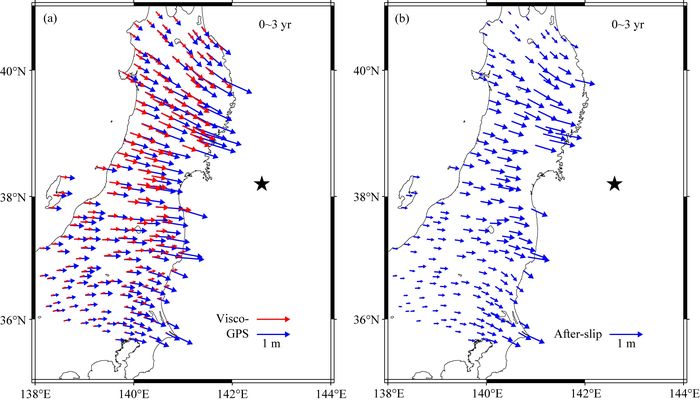
图 5a显示了GPS观测到的震后3年累计位移(蓝色箭头)与黏滞性松弛效应导致的位移(红色箭头).图 5b为累计3年的断层余滑引起的地表水平位移.经比较可知,震后3年累计的断层余滑和地幔黏滞性松弛效应总体上相当.因此,在研究日本MW9.0地震断层余滑演化过程的时候,务必剔除地幔黏滞性松弛效应,否则会导致较大的误差,甚至错误.换句话说,忽略黏滞性松弛效应的影响会过高地估计断层余滑的大小.
|
图 5 2011年日本MW9.0地震引起的震后3年累计水平位移 (a)蓝色箭头表示GPS观测到的震后位移,红色箭头表示地幔黏滞性松弛效应引起的震后位移;(b)蓝色箭头表示断层余滑引起的震后水平位移.黑色五角星代表震中. Fig. 5 Cumulative post-seismic displacements in 3 years after the 2011 Tohoku-Oki MW9.0 earthquake (a) Blue arrows indicate post-seismic displacements observed by GPS; red arrows indicate post-seismic displacements due to viscoelastic relaxation. (b) Blue arrows indicate post-seismic displacements induced by after-slips. The black star indicates the epicenter. |
从GPS观测数据中剔除黏滞性松弛效应之后,本文利用Zhou等(2014)提出的基于球体位错理论的反演方法,具体反演了日本MW9.0地震断层余滑演化过程.反演过程中,首先利用球体位错理论(Sun et al., 2009)计算位错格林函数,然后基于ABIC法则(Yabuki and Matsu'ura, 1992)对拟合结果进行反演约束.
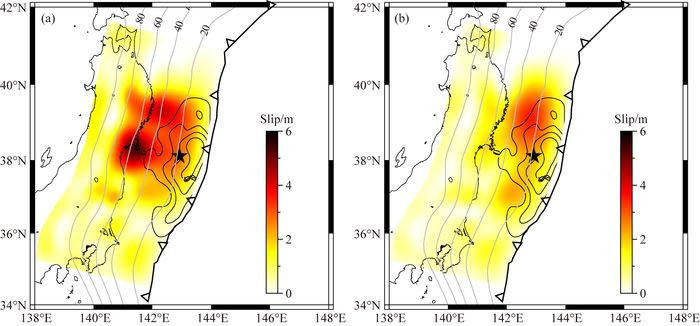
图 6为震后3年的累计断层余滑分布.图 6a为不考虑黏滞性松弛效应得到的震后断层余滑模型,矩震级为8.70,最大滑移量为5.3 m,图 6b为扣除黏滞性松弛效应后的震后余滑模型,矩震级为8.59,最大滑移量为3.5 m,可见忽略黏滞性松弛效应确实会过高估计震后余滑的震级.从图 6a可以看出,在北纬37°到40°之间,板块深度为40 km处出现两个滑移较大的震后余滑区域,与Ozawa等(2012)和Sliverii等(2014)不考虑黏滞性松弛效应通过GPS观测数据获得的滑移分布类似,显示了我们反演结果的可靠性.扣除黏滞性松弛效应后,我们反演得到的断层余滑分布形态(图 6b)与图 6a得到的结果明显不同,主要分布在断层深度为30 km处,并且断层余滑模型与主震模型的分布存在明显的互补特征.图 6a与图 6b的差异证明了剔除黏滞性松弛效应的重要性.
|
图 6 2011年日本MW9.0地震震后3年累计的断层余滑分布 (a)未从观测位移中扣除地幔黏滞性松弛效应,直接反演得到的断层余滑模型;(b)从震后位移中扣除地幔黏滞性松弛效应后反演得到的断层余滑模型.黑色等值线为间隔10 m的同震滑移,灰色等值线表示间隔20 km的断层等深度线,黑色五角星代表震中,黑色三角形和实线代表日本海沟. Fig. 6 Distribution of cumulative after-slips three years following the 2011 Tohoku-Oki MW9.0 earthquake (a) After-slip model from direct inversion; (b) After-slip model from inversion in which effect of viscoelastic relaxation is removed. Black contours indicate the co-seismic slip with interval of 10 m. The grey contours are depths of the fault plane with an interval of 20 km. Theblack star indicates the epicenter. The Japan Trench is plotted by black solid line and triangles. |
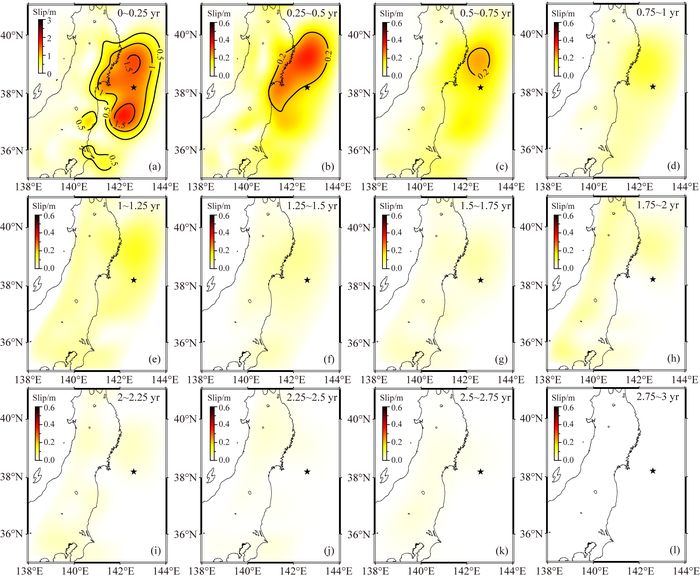
为了进一步清晰展示2011年日本MW9.0地震断层余滑时空演化过程,本文将震后3年细分为12个时间段,时间间隔为0.25年,然后利用各个时间段内断层余滑产生的震后位移,分别反演各个时间段内断层面上的余滑分布形态.图 7为各个时间段内断层余滑导致的震后位移.断层余滑导致的震后位移主要集中在震后初期,并随时间迅速衰减,约2年后主震区域余滑基本消失,断层的两端尚存一定的余滑效应.图 8为0~3年内各个时间段内累计断层余滑分布,震后初期滑移量较大,0~0.25年间日本列岛震后余滑最大滑移量达到1.6 m,矩震级为8.4,释放的能量达到0~3年间震后余滑释放总能量的一半.

|
图 7 2011年日本MW9.0地震断层余滑引起的震后位移,时间间隔为0.25年 红色五角星代表震中. Fig. 7 Post-seismic displacement induced by after-slip following the 2011 Tohoku-Oki MW9.0 earthquake from March 2011 to March 2014 with an interval of 0.25 years The red star indicates the epicenter. |
|
图 8 2011年日本MW9.0地震震后3年内断层余滑时空演化过程,时间间隔为0.25年 黑色五角星代表震中. Fig. 8 Temporal-spatial evolution of after-slips following the 2011 Tohoku-Oki MW9.0 earthquake from March 2011 to March 2014 with an interval of 0.25 year The black star indicates the epicenter. |
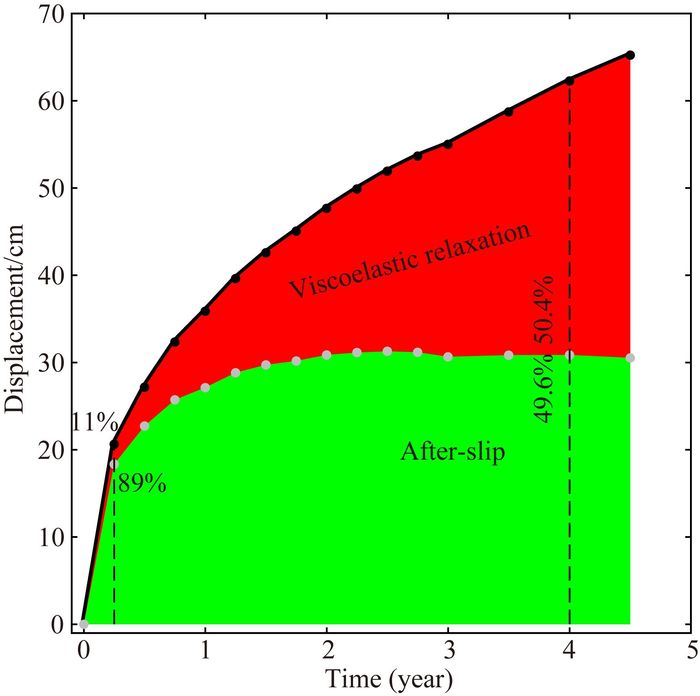
大多数研究表明,同时考虑断层余滑和地幔黏滞性松弛效应,能更好地解释震后形变(Diao et al., 2014; Yamagiwa et al., 2015).本文通过震后4.5年形变数据,分析了两种机制产生的震后位移随时间的分布情况.图 9为震后余滑和黏滞性松弛效应随时间的演化过程,横轴为震后时间,纵轴为215个GPS观测站的平均水平位移.可以看出,震后0.25年内余滑产生的水平位移占该时间段内GPS观测到的水平位移的89%,可见震后初期余滑占主导地位,此时基本可忽略黏滞性松弛效应.震后形变研究的时间尺度超过0.5年后,地幔黏滞性松弛效应就不能忽略.震后大约2年左右,断层余滑基本消失.2年以后的断层余滑(图 8i—8l)基本上由观测误差导致.震后4年左右,地幔黏滞性松弛效应产生的震后形变将超过震后余滑效应,可见地幔黏滞性松弛效应对震后位移的影响随着时间的推移而逐渐变大.
|
图 9 2011年日本MW9.0地震后,断层余滑和地幔黏滞性松弛效应随时间的累计变化 绿色区域和红色区域分别表示断层余滑和地幔黏滞性松弛效应对应的震后位移(215 GPS观测站的位移均值),黑色圆点表示各个时间点GPS观测到的震后平均水平位移,灰色圆点表示各个时间点累计断层余滑引起的平均水平位移,黑色数字表示该时刻断层余滑和地幔黏滞性松弛效应在震后位移中所占的比例. Fig. 9 Changes of cumulative post-seismic displacements caused by after-slip and viscoelastic relaxation following the 2011 Tohoku-Oki MW9.0 earthquake The green and red areas show the contributions of after-slip and viscoelastic relaxation to post-seismic displacement (average displacement observed by 215 GPS observation stations), respectively. Black dots are average displacement observed by GPS at each time point. Gray dots indicate the average displacement induced by after-slip at each time point. The black numbers are the percentages of the displacement of after-slip and viscoelastic relaxation relative to the displacements observed by GPS, respectively. |
本研究表明,2011年日本MW9.0地震后,断层余滑大体持续了2年,该持续时间相对于Yamagiwa等(2015)的研究结果更短,说明在震后形变机理研究过程中,使用过短的形变观测数据可能会导致地幔黏滞性松弛效应扣除不完全,进而过长地估计断层余滑的停止时间.Yamagiwa等(2015)得出的2.5年的余滑持续时间,正是由于其地幔黏滞性松弛效应扣除不完全所致.
6 结论本文首先利用日本列岛215个GPS观测站的连续观测数据,剔除研究区域长期构造变动等因素导致的背景位移场,获得2011年日本MW9.0地震引起的震后水平位移场.然后,依据震后断层余滑衰减相对较快的特点,结合Yamagiwa等(2015)的研究结论,本文将震后4.5年的GPS观测数据分成震后0~3年和3~4.5年两个时间段,分别进行研究,其中震后3~4.5年期间观测到的震后位移纯粹由地幔黏滞性松弛效应导致.这样区分是为了有足够长的数据反演地幔黏滞性系数,同时又能够把断层余滑效应彻底地从地幔黏滞性松弛效应中分离出来.本文利用Tanaka等(2006, 2007)的黏弹性球体位错理论,模拟计算了2011年日本MW9.0地震后由于地幔黏滞性松弛效应导致的震后位移,然后与震后3~4.5年间的GPS观测位移进行对比,通过观测与理论结果之间的均方根误差曲线,确定震源区岩石圈弹性层厚度的最优解为30 km,地幔黏滞性系数的最优解为6×10¹⁸ Pa·s.
本文从GPS时间序列中剔除地幔黏滞性松弛效应,获得断层余滑产生的震后位移,然后利用Zhou等(2014)提出的基于球体位错理论的反演方法,反演了2011年日本MW9.0地震后0~3年内断层余滑分布及其演化过程.结果表明,断层余滑主要发生在震后初期(半年内),随时间的推移迅速衰减,并在震后2年左右消失,断层余滑的累计矩震级达到8.59;地幔黏滞性松弛效应则随着时间的推移而逐步占据主导,并在震后4年左右超过断层余滑效应.
与基于平面半空间位错理论的前期类似研究的结论相比(50 km的岩石圈弹性层厚度;(8~9)×1018 Pa·s的地幔黏滞性系数,断层余滑持续时间2.5年)(Diao et al., 2014; Yamagiwa et al., 2015),本研究的相关结论改进明显,证明了使用球体位错理论展开相关研究的重要性,同时也证明了基于较长时长的GPS震后观测数据分离断层余滑和地幔黏滞性松弛效应的必要性.
| Chen G Q, Wu Y Q, Jiang Z S, et al. 2013. Characteristics of seismogenic model of MW9.0 earthquake in Tohoku, Japan reflected by GPS data. Chinese Journal of Geophysics (in Chinese), 56(3): 848-856. DOI:10.6038/cjg20130314 | |
| Diao F Q, Xiong X, Wang R J, et al. 2014. Overlapping post-seismic deformation processes:Afterslip and viscoelastic relaxation following the 2011 MW9.0 Tohoku (Japan) earthquake. Geophysical Journal International, 196(1): 218-229. DOI:10.1093/gji/ggt376 | |
| Feng C J, Zhang P, Sun W F, et al. 2013. A discussion on the impact of Japan MW9.0 earthquake on the main active fault zone in north-and northeast-China continent and the seismic risk. Earth Science Frontiers (in Chinese), 20(6): 123-140. | |
| Fu G Y, Sun W K, Fukuda Y, et al. 2010. Coseismic displacements caused by point dislocations in a three-dimensional heterogeneous, spherical earth model. Geophysical Journal International, 183(2): 706-726. DOI:10.1111/j.1365-246X.2010.04757.x | |
| Fu G Y. 2012. Application of spherical dislocation theory to 2011 Tohoku-Oki earthquake, Japan. Journal of Geodesy and Geodynamics (in Chinese), 32(6): 1-7. | |
| Fukahata Y, Matsu'ura M. 2006. Quasi-static internal deformation due to a dislocation source in a multilayered elastic/viscoelastic half-space and an equivalence theorem. Geophysical Journal International, 166(1): 418-434. DOI:10.1111/gji.2006.166.issue-1 | |
| Hoechner A, Sobolev S V, Einarsson I, et al. 2012. Investigation on afterslip and steady state and transient rheology based on postseismic deformation and geoid change caused by the Sumatra 2004 earthquake. Geochemistry, Geophysics, Geosystems, 12(7). | |
| Jónsson S, Segall P, Pedersen R, et al. 2003. Post-earthquake ground movements correlated to pore-pressure transients. Nature, 424(6945): 179-183. DOI:10.1038/nature01776 | |
| Kido M, Osada Y, Fujimoto H, et al. 2011. Trench-normal variation in observed seafloor displacements associated with the 2011 Tohoku-Oki earthquake. Geophysical Research Letters, 38(24). | |
| Miyazaki S, Segall P, Fukuda J, et al. 2004. Space time distribution of afterslip following the 2003 Tokachi-Oki earthquake:implications for variations in fault zone frictional properties. Translated World Seismology, 31(6): 337-357. | |
| Ozawa S, Nishimura T, Suito H, et al. 2011. Coseismic and postseismic slip of the 2011 magnitude-9 Tohoku-Oki earthquake. Nature, 475(7356): 373-376. DOI:10.1038/nature10227 | |
| Pollitz F F, Bürgmann R, Banerjee P. 2006. Post-seismic relaxation following the great 2004 Sumatra-Andaman earthquake on a compressible self-gravitating Earth. Geophysical Journal International, 167(1): 397-420. DOI:10.1111/gji.2006.167.issue-1 | |
| Sato M, Ishikawa T, Ujihara N, et al. 2011. Displacement above the hypocenter of the 2011 Tohoku-Oki earthquake. Science, 332(6036): 1395. DOI:10.1126/science.1207401 | |
| Shao Z G, Zhang L P, Ma H S, et al. 2015. The analysis of the relationship between Japanese MW9.0 earthquake on March 11, 2011 and the fault movement based on the GPS observation. Chinese Journal of Geophysics (in Chinese), 58(3): 857-871. DOI:10.6038/cjg20150315 | |
| Shinzaburo O, Takuya N, Hiroshi M, et al. 2012. Preceding, coseismic, and postseismic slips of the 2011 Tohoku earthquake, Japan. Journal of Geophysical Research:Solid Earth, 117(B7): 346-348. | |
| Silverii F, Cheloni D, D'Agostino N, et al. 2014. Post-seismic slip of the 2011 Tohoku-Oki earthquake from GPS observations:implications for depth-dependent properties of subduction megathrusts. Geophysical Journal International, 198(1): 580-596. DOI:10.1093/gji/ggu149 | |
| Suito H, Hirahara H. 1999. Simulation of postseismic deformations caused by the 1896 Riku-u earthquake, northeast Japan:Re-evaluation of the viscosity in the upper mantle. Geophysical Research Letters, 26(16): 2561-2564. DOI:10.1029/1999GL900551 | |
| Sun W K, Okubo S, Fu G Y, et al. 2009. General formulations of global co-seismic deformations caused by an arbitrary dislocation in a spherically symmetric earth model-Applicable to deformed earth surface and space-fixed point. Geophysical Research Letters, 177(3): 817-833. | |
| Tajima F, Mori J, Kennett B L N. 2013. A review of the 2011 Tohoku-Oki earthquake (MW9.0):Large-scale rupture across heterogeneous plate coupling. Tectonophysics, 586: 15-34. DOI:10.1016/j.tecto.2012.09.014 | |
| Tanaka T, Okuno J, Okubo S. 2006. A new method for the computation of global viscoelastic post-seismic deformation in a realistic earth model (Ⅰ)-vertical displacement and gravity variation. Geophysical Journal International, 164(2): 273-289. DOI:10.1111/gji.2006.164.issue-2 | |
| Tanaka T, Okuno J, Okubo S. 2007. A new method for the computation of global viscoelastic post-seismic deformation in a realistic earth model (Ⅱ)-Horizontal displacement. Geophysical Journal International, 170(3): 1031-1052. DOI:10.1111/gji.2007.170.issue-3 | |
| Wang K L, Hu Y, He J H. 2012. Deformation cycles of subduction earthquakes in a viscoelastic Earth. Nature, 484(7394): 327-332. DOI:10.1038/nature11032 | |
| Wang R J, Lorenzo-Martín F, Roth F. 2006. PSGRN/PSCMP-a new code for calculating co-and post-seismic deformation, geoid and gravity changes based on the viscoelastic-gravitational dislocation theory. Computers & Geosciences, 32(4): 527-541. | |
| Wang R, Diao F, Hoechner A. 2013. SDM-A geodetic inversion code incorporating with layered crust structure and curved fault geometry.//EGU General Assembly Conference. EGU General Assembly Conference Abstracts. | |
| Wei S J, Graves R, Helmberger D, et al. 2012. Sources of shaking and flooding during the Tohoku-Oki earthquake:a mixture of rupture styles. Earth and Planetary Science Letters, 333-334: 91-100. DOI:10.1016/j.epsl.2012.04.006 | |
| Yabuki T, Matsu'ura M. 1992. Geodetic data inversion using a Bayesian information criterion for spatial distribution of fault slip. Geophysical Research Letters, 109(2): 363-375. | |
| Yamagiwa S, Miyazaki S, Hirahara K, et al. 2015. Afterslip and viscoelastic relaxation following the 2011 Tohoku-Oki earthquake (MW9.0) inferred from inland GPS and seafloor GPS/Acoustic data. Geophysical Research Letters, 42(1): 66-73. DOI:10.1002/2014GL061735 | |
| Yang S M, Nie Z S, Jia Z G, et al. 2011. Far-field coseismic surface displacement caused by the MW9.0 Tohoku earthquake. Geomatics and Information Science of Wuhan University (in Chinese), 36(11): 1336-1339. | |
| Yin H T, Gan W J, Huang B, et al. 2013. Study on the effects of Japan M9.0 huge earthquake on the crustal movement of Shandong area. Chinese Journal of Geophysics (in Chinese), 56(5): 1497-1505. DOI:10.6038/cjg20130508 | |
| Zhang G Q, Fu G Y, Zhou X, et al. 2015. Retrieve post-seismic gravity changes induced by Sumatra earthquake (MW9.3) based on the viscoelastic dislocation theory. Chinese Journal of Geophysics (in Chinese), 58(5): 1654-1665. DOI:10.6038/cjg20150517 | |
| Zhou X, Sun W K, Zhao B, et al. 2012. Geodetic observations detected co-seismic displacements and gravity changes caused by the Tohoku-Oki earthquake (MW=9.0).. Journal of Geophysical Research:Solid Earth, 117(B5): B05408. DOI:10.1029/2011JB008849 | |
| Zhou X, Cambiotti G, Sun W K, et al. 2014. The coseismic slip distribution of a shallow subduction fault constrained by prior information:the example of 2011 Tohoku (MW9.0) megathrust earthquake. Geophysical Journal International, 199(2): 981-995. DOI:10.1093/gji/ggu310 | |
| 陈光齐, 武艳强, 江在森, 等. 2013. GPS资料反映的日本东北MW9.0地震的孕震特征. 地球物理学报, 56(3): 848–856. DOI:10.6038/cjg20130314 | |
| 丰成君, 张鹏, 孙炜锋, 等. 2013. 日本MW9.0级地震对中国华北-东北大陆主要活动断裂带的影响及地震危险性初步探讨. 地学前缘, 20(6): 123–140. | |
| 付广裕. 2012. 球体位错理论在2011年日本强震中的应用研究. 大地测量与地球动力学, 32(6): 1–7. | |
| 邵志刚, 张浪平, 马宏生, 等. 2015. 基于形变观测分析2011年日本9.0级地震与断层运动间关系. 地球物理学报, 58(3): 857–871. DOI:10.6038/cjg20150315 | |
| 杨少敏, 聂兆生, 贾志革, 等. 2011. GPS解算的日本MW9.0级地震的远场同震地表位移. 武汉大学学报:信息科学版, 36(11): 1336–1339. | |
| 殷海涛, 甘卫军, 黄蓓, 等. 2013. 日本M9.0级巨震对山东地区地壳活动的影响研究. 地球物理学报, 56(5): 1497–1505. DOI:10.6038/cjg20130508 | |
| 张国庆, 付广裕, 周新, 等. 2015. 利用震后黏弹性位错理论研究苏门答腊地震(MW9.3) 的震后重力变化. 地球物理学报, 58(5): 1654–1665. DOI:10.6038/cjg20150517 | |
 2017, Vol. 60


