 2015, Vol. 58


2. 中国地震局, 北京 100036;
3. 中国地震局地壳应力研究所, 北京 100085
2. China Earthquake Administration, Beijing 100036, China;
3. Institute of Crustal Dynamics, China Earthquake Administration, Beijing 100085, China
Based on crustal deformation observation, we study the 3D spatial distribution characteristics of inter-seismic, co-seismic, and post-seismic fault movement and provide the pattern diagram of fault motion at the trench areas of Japan. We invert the coseismic displacements of the fault based on uniform fault model (oblique fault model, the dip from the seabed to 50km depth changes from 5 degrees to 20 degrees, the unified strike 198) and 3D fault model (seismic parameters of the 3D fault model are given by fitting). The results show that, as for the 3D fault model, the coseismic dislocations better fit the data, and more agree with fault properties. Therefore, in carrying out the work of similar inversion accuracy of fault geometry, the reliability of the results is very important. The inversion results show that there are two coseismic slip extreme areas. The maximum coseismic dislocation is about 50 m, located in the shallower coseismic slip extreme area. The dislocation amount of the coseismic rupture is greater than 10m near the epicenter in a range of 400 km; in the South Japan Trench the coseismic displacement is relatively small, the earthquake is a typical Japan trench thrust type earthquakes. According to the spatial distribution characteristics of the magnitude 9.0 earthquake and the previous strong earthquake ruptures in the area, the magnitude 9 earthquake rupture bore the characteristics of recurrence of strong earthquake, and was the strong earthquake rupture to fill in the gaps. In inter-seismic stage in the Japan trench, the depth of the locking line is about 60km, moreover, the fault movement, from deep to shallow above the locking line, in order, is strong locking, aseismic slip, weak locking. From coseismic dislocation inversion, there are two coseismic slip extreme areas. The shallow one (coseismic displacement 10~50 m, depth less than 30 km) is weak locking before this earthquake; and the deep one (coseismic displacement 10~20 m, depth about 40 km) is strong locking before this earthquake; and the coseismic dislocation in transition zone between with extreme coseismic slip areas is relatively small and there is aseismic slip before this eartqhuake. In the initial period after the earthquake, afterslip is mainly in the deeper coseismic extreme slip areas.
On the basis of the coseismic and interseismic fault motion inversion results, the seismic strong locked segment will take 100 years to accumulate 10m coseismic dislocation, and the regional history has 7 earthquake recurrence periods of earthquake activity; the weak locked segment will take about 300~600 years to accumulate 30~50 m coseismic dislocation, which is consistent with the recurrence period of magnitude 9.0 earthquake in Japan Trench given by relevant research. As to determining the actual seismogenic ability, because the different sections of one fault will form more combinations in the earthquake process, fault earthquake capacity determination result is more uncertain. But the research on regional deformation observation data is very important and of practical significance for judging fault strong earthquake ability.
2 011年3月11日太平洋西向俯冲的日本海沟地区发生9.0级地震(图 1),此次地震是日本有地震记录以来震级最大的一次地震.日本列岛处于太平洋板块、欧亚板块、北美板块和菲律宾海板块的共 同作用地区(Kanamori,1977; Taira,2001),板块 构造运动比较强烈,为火山和地震多发地区(中国地震局监测预报司,2007).太平洋板块在日本海沟地区向西以约8~9cm/a的速度俯冲到欧亚板块之下,该俯冲带的地震包括浅、中和深源地震(Chen et al., 2004),震源深度由海沟地区向西到中国东北地区逐渐加深到600~700 km,且浅源和深源强震活动均非常活跃(中国地震局监测预报司,2007;Kanamori et al., 2006).
 |
图 1 日本9.0级地震及其余震分布和GPS观测近场站点分布图 其中主震为哈佛大学给出的震源机制解;余震为ISC(International Seismological Centre)给出的目录.Fig. 1 The distribution of Japan 9.0 earthquake,its aftershocks and the near-field GPS observation stations The focal mechanism solution of main shock is from Havard CTM; the aftershocks are from IS |
地震仪、强震仪、GPS、海啸记录、海底压力计等仪器直接或间接记录到此次地震同震地表速度、加速度和位移等信息,众多学者以某种或多种同震观测做约束对此次地震同震破裂过程或静态位错进行 反演,多数反演结果表明此次地震的震级为MW8.9~9.1、 最大位错为25~60 m、破裂长度约300 km(Taijima et al., 2013).部分同震破裂反演结果表明2011年日本9.0级地震同震位错空间上可以细分为深浅两个同震滑移极值区(Zhang et al., 2014;Chu et al., 2011);另一方面,同震数字波形记录中较高频段成分多来自深部同震破裂,较低频段成分多来自浅部破裂(Yao et al., 2011).以震后GPS观测为约束反演所得震后断层运动表明,震后的断层滑移和余震主要集中在40 km左右的深度上,大致为同震位错较深的滑移极值区(Ozawa et al., 2011; Diao et al., 2014).在此次9.0级地震之前,已有学者以震间日本地壳变形观测为约束,通过反演给出了日本海沟板块俯冲带上断层逆冲运动闭锁区,其空间分布与日本9.0级地震同震位错基本一致(Loveless and Meade, 2010;Hashimoto et al., 2009).
但是,此次日本9.0级地震之前的区域历史地震记录表明,日本海沟地区强震活动以7级地震为主,仅有个别8级以上地震,且多发生在靠近日本岛东侧较深俯冲带上,也即2011年日本9.0级地震同震较 深的滑移极值区(Kanamori et al., 2006;Taijima et al., 2013).正是由于历史强震记录的限制,日本地震调查研究推进本部(The Headquarters for Earthquake Research Promotion,2005)给出的预测结果认为2005—2034年30年期间日本海沟地区具备发生2次7级或1次8级地震的可能,虽然预测地点位于震中附近,但对日本海沟发震能力的估计明显偏低.
本文基于相关研究结果给出的2011年3月11日日本9.0级地震震前、同震和震后地壳变形资料分析此次地震与断层运动间关系,以此系统地分析日本海沟地区强震过程不同阶段断层运动形式,期望对大型断裂带孕震能力的判定有进一步理解. 2 断层模型
以地表形变测量为约束的断层运动反演相关研究中,断层模型确定过程中所采用的基础资料存在 很大差别.例如对于发生2011年3月11日日本9.0级地震的日本海沟地区,断层模型有如下几种:(1)统一均匀模型,走向为200°,倾角为12°(Koketsu et al., 2011);(2)渐变模型,基于浅源强震震源机制解和中源地震拟合的断层倾角,日本海沟地区断层模型的倾角从海底到50 km深度,由5°变为20°或12°,其走向或为统一走向(刁法启等,2011;Shao et al., 2011),或采用与太平洋板块俯冲边界一致的走向(刁法启等,2012);(3)日本海沟地区有比较好的壳幔速度介质模型(Miura et al., 2005),基于区域壳幔波速模型建立断层几何模型(Loveless et al., 2010);(4)基于地震定位结果给出板块三维几何接触面(Takeuchi et al., 2008; Hayes et al., 2009; Hayes and Wald, 2009; Hayes et al., 2012).
板间地震位错是板块间断层相互作用的直接表现形式,随着地震参数的标定精度逐步提高,美国地质调查局Hayes等开发了利用地震参数的板块俯冲三维几何接触模型(Slab1.0),相对定量地给出了全球主要海陆俯冲带板块相互接触较为精细的三维几何形态及俯冲范围.其主要思路是基于地质构造相关研究结果,对地震定位结果进行线性和非线性拟合,不同地震事件的权重与震级相关(Hayes et al., 2009; Hayes and Wald, 2009; Hayes et al., 2012).该模型中,不仅中源断层面几何性质与相关拟合结果基本一致(Chen et al., 2004; Takeuchi et al., 2008),而且震后沉积层地震剖面与震前1999年剖面对比分析认为,此次9.0级地震破裂穿过海底沉积层(Kodair et al., 2012),其推断的同震低角俯冲断层深度和倾角与拟合结果比较接近,因此本文认为基于Slab1.0的断层模型也许更接近实际断层几何性质.因为基于穿过震源区的宽角反射和折射剖面的认识是,从板块边界往西150 km范围内,太平洋板块俯冲角从5°变为12°;由此,上段所述第二个模型和第三个模型是类似的.所以,本文主要对比分析两个断层几何模型,Model A为统一渐变模型(图 2a),日本海沟地区断层模型的倾角从海底到50 km深度由5°变为20°,走向为198°(刁法启等,2011;Shao et al., 2011).Model B为基于地质构造和地震参数Slab1.0给出的断层模型,其断层空间位置与Model A存在较大差异(图 2a和2b),其走向不是固定值,随空间变化而变化,走向变化范围为175°~215°(图 2c).
 |
图 2 断层模型示意图 (a)Model A子断层面深度分布图;(b)Model B子断层面深度分布图;(c)Model B子断层面走向分布图.Fig. 2 The schematic diagram of fault model (a)The depth distribution of Model A′s subfault plane;(b)The depth distribution of Model B′s subfault plane; (c)The strike distribution of Model B′s subfault plane. |
覆盖日本全境的GEONET(GPS Earth Observation Network System)系统给出的GPS连续观测资料为相关研究提供了非常宝贵的地壳变形观测资料,该系统包括约1200个GPS连续观测点,自1993年正式启动(Sagiya,2004; Kuroishi et al., 2007).该系统所提供的地壳变形速率(Sagiya et al., 2000)为分析地壳应变、同震和震后位移、震间断层运动相关研究的基础观测资料(Sagiya,2004; Kuroishi et al., 2007).日本本州地区的GPS连续观测给出的2011年3月11日日本9.0级地震震前、同震和震后地壳变形速率为此次9.0级地震相关研究提供有效的地壳变形约束(GPS连续观测站点分布如图 1所示).在此地震之前,不同研究者基于不同期的GPS观测资料给出了日本海沟地区板块俯冲速率(Nishimura et al., 2004; Hashimoto et al., 2009; Loveless et al., 2010),并基于断层运动的位移亏损给出强震危险地点(Hashimoto et al., 2009; Loveless et al., 2010);该地震发生后,日本国土地理院Hashimoto教授和美国JPL实验室利用GEONET 1323个GPS连续站,快速给出同震位移场和8h内震后位移场的解算结果1),为同震位错反演与分析提供有效地表约束(Ozawa et al., 2011; Pollitz et al., 2011);而同震与震后的断层运动时空演化过程也有助于理解日本海沟地区强震与断层运动间关系(Ozawa et al., 2011; Ozawa et al., 2012).
1)http://supersites.earthobservations.org/sendai.php
GEONET网络系统1323个GPS连续站均给出了2011年日本9.0级地震同震观测位移,本文选取近场(136°E以东,42°N以南)约500个GPS连续站的同震水平和垂向位移为同震位错反演地表变形约束.另一方面,利用海底声纳和GPS联合观测(GPS/A)给出了同震破裂正上方7个观测点的海底同震地表位移(Sato et al., 2011; Kido et al., 2011);海底压力仪(OBPs)给出由海底水压变化推断的海底同震垂向位移(Iinuma et al., 2012),其中海底的同震位移如表 1所示.
| 表 1 2011年3月11日日本9.0级地震同震海底位移观测(Sato et al., 2011; Kido et al., 2011; Iinuma et al., 2012) Table 1 The coseismic displacement at seafloor of March 11,2011,Japan 9.0 earthquake |
自1993年GEONET网络系统运行后,日本海沟地区于1994年发生MW7.7地震,其后3年左右 该地区断层重新达到愈合状态(Nishimura et al., 2004);而2000年以后日本海沟地区近海岸发生多 次M≥7.0地震,同震和震后观测到显著地壳变形(Sagiya et al., 2004; Loveless et al., 2010).鉴于上述考虑,本文选取GEONET网络系统给出的 1997—2000年平均地壳运动速率为约束反演日本海沟地区9.0级地震前震间断层运动(Loveless et al., 2010).
日本国土地理院Hashimoto教授和美国JPL 实验室不仅给出了同震近场位移,还同时给出了震 后8 h内的地壳位移,而且Ozawa等逐月给出震 后7个月的近场震后地壳位移(Ozawa et al., 2012).
4 反演方法与位错反演结果 .
4.1 反演方法介绍 本文以近场GPS观测所得地表震间、同震和震 后位移为约束,利用SBIF(Sensitivity Based Iterative Fitting)反演程序(Wang et al., 2004)反演日本海沟地区断层运动空间分布.该反演方法基于Ward和Barrientos(1986)提出的误差最小化过程,其误差函数定义为
为获得较为合理的位错反演结果,避免反演结果中过多地出现奇异点,除了先验约束外,断层位错反演通常会附加断层位错或应力降平滑约束,即在数据拟合程度与断层滑动粗糙度之间做一权衡,一般会依据拟合度与粗糙度曲线确定平滑因子(刁法启等,2011).本文分析断层面应力降平滑条件,图 3为归一化断层应力粗糙度与数据拟合度曲线,同震、震后和震间的平滑因子分别取0.1、0.2和0.09.
4.2 同震位错反演结果 为分析断层模型对反演结果的影响,本节分别基于倾角渐变、走向统一的ModelA和Slab1.0计划中给出更为接近实际情况的ModelB两种断层模型.
图 4为基于ModelA断层模型反演所得位错分 布,最大滑移极值区位于中间,在断层南北两端(36°N
以北和40°N以南之间)存在位错量10 m左右的滑移极值区(图 4a),这与部分用统一断层模型相关反演结果比较一致(Lay et al., 2011).将位错分为走向和倾向两个分量,走向分量滑移极值区为北端北向滑动和南端南向滑动(图 4b);而倾向分量整体以逆冲为主,且集中分布在最大的滑移极值区(图 4c).该位错模型整体特征是,震中上方位错量最大表现出显著逆冲特征,断层模型南北两端分别存在两个以走滑为主的滑移极值区.
图 5是基于Model B断层模型反演所得位错分布与Model A的结果(图 4)差别较大,4 m以上位错集中分布在37°N以北250 km范围内,在模型南北两端并无明显滑移极值区(图 5a),该结果与数字 地震学高频波形资料给出的此次9.0级地震能量释放空间覆盖范围基本一致(Kiser and Ishii, 2012).由10 m 以上同震位错空间分布来看,此次日本9.0级地震同震位错存在深浅两个滑移极值区:深度在30 km以上较浅的滑移极值区同震位错较大,同震位错超 过30 m断层滑动均集中在该极值区内;深度在40 km 左右较深的滑移极值区,同震位错相对较小,多为10~20 m.由其走向和倾向分量(图 5b和图 5c),此次9.0级地震整体表现为兼有右旋走滑分量逆冲为主的日本海沟地区俯冲型地震,Global CMT Catalog给出的日本海沟地区M≥7地震多为逆冲兼右旋走滑.2011年3月9日日本海沟地区发生了MW7.3地震,该地震可能是此次9.0级地震的前震(Ando and Imanishi, 2011; Miyazaki et al., 2011; Hirose et al., 2011),而此次9.0级地震同震较浅的位移极值区内是MW7.3前震的余震活跃区域(图 5c).
采用不同观测资料得到此次9.0级地震同震位错存在很大差异,最大位错量从25 m到60 m,震级从MW8.9到MW9.1(Tajima et al., 2013),其中,利用数字地震学波形资料作约束得到的同震位错反演结果空间分布与本文Model B反演结果比较一致,不仅同震极值滑移区空间分布上比较一致,且深浅部也存在两个滑移极值区(Miura et al., 2005; Chu et al., 2011; Ammon et al., 2011; Hayes,2011).因此,就Model A和Model B两种断层模型而言,地表同震位移变形约束和方法均一样,第二种模型位错相对集中,位错走滑与逆冲性质较为合理,断层模型对反演结果的影响是非常明显的,基于相对接近实际的断层模型所得同震位错结果也许相对更加合理,而且与数字地震学相关结果比较一致.
为了进一步分析两个断层模型对反演结果的影响,对比基于反演的同震位错模拟结果和观测结果之间的误差.Model B的东西向、南北向和垂向误差主要集中于±5 cm,呈正态分布;相对于Model A三个方向误差,基于Model B的地壳同震位移理论模 拟结果明显更接近观测值(图 6).图 7为基于Model B 断层模型,地表和海底同震形变观测值和理论模拟值空间分布图,两者之间拟合地非常好.
为避免日本海沟地区7级以上地震同震和震后的影响,本文分析日本海沟震间断层运动时选取1997—2000年期间的数据(Loveless et al., 2010),该时间段内没有发生过MW≥6.5地震(Global CMT Catalog),之前的7级地震震后影响逐渐减弱(Nishinura et al., 2004).图 8为反演所得震间断层运动的逆冲分量,图 9为基于Model B断层模型,以地表和海底震间形变观测值和理论模拟值空间分布图,两者之间拟合较好.对于日本海沟地区震间断层运动,上盘向上表示断层上下盘发生相对错动,板块俯冲产生的应变能以无震滑移的形式释放;上盘向下表示断层处于闭锁状态,断层随着板块俯冲往下运动.上述两种断层运动状态的分界线一般称之 为闭锁线,本文依据震间断层运动反演所得闭锁线深度约为50~60 km,与以往研究结果相似(Nishimura et al., 2004;Hashimoto et al., 2009).与以往震间研究整体上相类似,日本海沟板块俯冲断层震间闭锁程度深部要比浅部强(Loveless and Meade, 2010;Hashimoto et al., 2009),但细节存在一些差异.以往研究给出的结果中闭锁线以上均为闭锁程度不均匀的闭锁区域,而本文结果表明,闭锁线以上仍存在大范围的无震滑移区域,从闭锁线沿着断层倾向由深往浅依次为强闭锁区、无震滑移区和弱闭锁区.此次9.0级地震浅部滑移极值区对应震间弱闭锁区,深部滑移极值区对应震间强闭锁区,而深浅部滑移极值区中间过渡区为震前无震滑移区.
与以往认识上最大的差异在于震间强闭锁区不是同震最大位错区域,部分震间无震滑移区位于同震滑移极值区,这种现象表明,同震破裂过程中由于孔隙流体快速剪切加热等可能原因,部分震间无震滑移断层段同震会产生较大的同震位错(Noda and Lapusta, 2013).另一方面,强闭锁段对应历史上多次7级地震的破裂区,强震比较活跃,而弱闭锁段历 史7级地震少发区(Uchida and Matsuzawa, 2011).
在俯冲带震间断层闭锁程度的分析过程中一般认为大型俯冲带浅层断层应该是速度强化区,即震间阶段浅层俯冲带断层应该是处于无震滑移状态,对于日本海沟地区震间断层运动相关研究便是基于这种假设进行反演(Loveless and Meade, 2010).如果认为大型俯冲带浅层断层震间阶段也可以处于闭锁状态,不做类似的假设,通过反演给出的日本海沟震间闭锁率空间上与本文结论类似,浅部和深部存 在两个闭锁率较高的区域(Loveless and Meade, 2011).
对于此次9.0级地震震中位置,不同机构给出不同的结果(表 2),中国地震局地球物理研究所(IG-CEA)、美国国家地震信息中心(NEIC)和中国地震台网中心(CENC)的结果位于震间深部的断层强闭锁区;日本东京大学地震研究所(ERI)和美国哈佛大学(HRV)的结果位于震间浅部的断层弱闭锁区.2011年3月9日MW7.3是此次9.0级地震的 前震,前震序列主要在震间浅部的断层弱闭锁区持续活动(图 5),而前震发生30 h后在震间深部的断层强闭锁区中小地震开始集中活跃(Ando and Imanishi, 2011).
分别利用震后8 h内、震后1—7个月不同时间段内震后地表形变观测为约束,反演震后余滑空间分布演化过程(图 10a—h).震后8 h内震后断层运动中最显著的是MW7.9强余震同震破裂区和同震较深的滑移极值区(图 10a);震后1—7个月的震后余滑主要分布在震间断层运动闭锁线以上,其中震间强闭锁区为震后位错主要活动区域,震后余滑最大位错和空间影响范围逐月变小,逐渐收缩到同震较深的滑移极值区(图 10b—h).同震较浅的滑移极值区可能由于同震释放比较彻底,而震后余滑量相对较小.
以1个月为时间窗长,逐天滑动统计2011年3月11日日本9.0级地震余震月频次随时间变化,余震月频次随时间呈指数衰减,前3个月后余震活动水平较高,而6个月以后地震活动水平保持较低活动水平(图 11).而震后余滑前3个月空间影响范围和最大位错滑动量相对较大,与余震频次存在一定的相关性(Ozawa et al., 2012). Diao等(2014)以GPS给出的震后地表形变为约束,通过反演分析了震后余滑和震后黏滞松弛在震后地壳变形中各自贡献率,结果表明震后数月内的地壳变形主要是震后余滑引起的,所占比重超过90%;而且震后余滑空间分布也与本文反演结果较为一致.不同地区震间、同震和震后的断层运动时空演化特征存在很大差异,例如对于2005年苏门答腊8.7级地震,多个同震滑移极值区沿着走向分布,同样震后余滑也是向走向两侧扩展,这更多地可能与区域断层几何性质和物理性质有关(Prawirodirdjo et al., 2010).
依据震间、同震和震后断层运动反演结果,我们可以初步建立日本海沟地区地震断层运动学简化模型.太平洋板块往北西向俯冲到日本列岛之下,弹性岩石圈中断层震间运动从浅到深依次为弱闭锁段、无震滑移段和强闭锁段,强闭锁段下限为闭锁线,闭锁线以下断层运动多表现为无震滑移(图 12).由2011年3月11日9.0级地震同震位错分布,同震较浅的滑移极值区(同震位错10~50 m,深度在30 km以 上)震间为断层弱闭锁段;同震较深的滑移极值区(同震位错10~20 m,深度在40 km左右)震间表现为断层强闭锁段;而在两者之间的过渡带同震位错相对较小,震间断层运动表现为无震滑移.2011年3月11日9.0级地震震前短临过程比较复杂,7级前震序列活动区域为此次9.0级地震同震较浅滑移极值区,前震序列后期活动可能触发主震震中地区主震最初的断层运动,而震中可能位于震间弱闭锁段(同震较浅滑移极值区)或震间强闭锁段(同震较深滑移极值区),而此次9.0级地震同震破裂过程中,位于闭锁线以上各段位错大小依次为弱闭锁段、强闭锁段和无震滑移段.而震后初期断层运动主要分布在在闭锁线以上的同震较深滑移极值区(图 5,图 10),且该段断层震间表现为强闭锁段(图 8).依据本文震间断层运动反演结果,强闭锁段积累10 m同震位错需要100多年时间,历史上7级地震比较 活跃,20世纪30年代发生过几次7级地震(Kanamori et al., 2006);弱闭锁段积累30~50 m同震位错约需要333~625年时间,与相关研究给出的260~880年比较一致(Uchida and Matsuzawa, 2011).
依据形变观测分析此次日本海沟9.0级地震所得到认识是:(1)断层几何模型对断层位错反演结果的影响非常显著,反演之前依据相关基础资料建立更接近实际的断层几何模型是非常重要的;(2)震间断层闭锁段为强震同震能量释放集中区的凹凸体,但强闭锁段不一定比弱闭锁段所累积的能量大;(3)闭锁深度以下,震间断层运动以无震滑移为主,但闭锁深度以上同样存在无震滑移,震间闭锁深度以上断层,强闭锁段、弱闭锁段和无震滑移区均存在发生同震位错的可能;(4)强震震中可能与前震序列活动有关,前震序列主要位于震间弱闭锁段;(5)震后无震滑移可能与余震活动同步,且震后滑移同样发生在闭锁线以上,大致对应同震较深滑移极值区,震间表现为强震闭锁段.
随着岩石实验和地震过程研究的逐渐深入,逐渐形成断层物理性质决定了断层在地震过程中同震、震后和震间的不同表现形式,不同学者建立了很多与地震过程相关的断层动力学理论模型(Tse and Rice, 1986; Scholz,1998; Marone,1998).其主要观点包括:凹凸体对应断层运动速度弱化区,震间为有利于断层应变积累的潜在强震危险区,同震表现为快速破裂;而障碍体对应断层运动速度强化区,断层长期处于相对稳定的滑动状态.这些模型在理解强震轮回过程、强震时空演化等现象时起到非常关键的作用,而且被作为日本中期尺度地震预报的物理基础(Yamaoka,2007).对于断层发震能力判定的相关研究中比较侧重于断层活动性质、凹凸体的几何尺度以及多个凹凸体发生极联破裂可能性等科学问题,地震预测理论与实践之间的差距呈现逐渐缩小的迹象.但特别值得关注的是1999年集集7.6级地震和2011年日本9.0级地震,这两次地震有可能是震中所在的断层速度弱化区初始破裂导致相邻强化区严重破坏性断层破裂,基于摩擦本构律的强震过程数值模拟结果也表明这种现象是完全有可能的(Noda and Lapusta, 2013);也即,2011年日本9.0级地震同震破裂造成的深浅两个滑移极值区有可能分别对应着凹凸体和障碍体,而非是两个凹凸体发生级联破裂.
而另一方面,日本GEONET观测网络GPS观测给出了日本岛地壳变形动态变化,基于震间日本本州地壳变形观测给出的日本海沟板块俯冲带上断 层逆冲运动闭锁区(Loveless et al., 2010;Hashimoto et al., 2009),其处于闭锁状态的断层长度约300 km;而利用重复地震给出的断层运动闭锁结果表明,2011年日本9.0级地震震源区内断层处于强闭锁状态,而重复地震、历史7级地震和此次9.0级地震所 对应的是不同层级的凹凸体(Uchida and Matsuzawa, 2011),其空间尺度分别为10 km、100 km和300~400 km,这些不同尺度凹凸体叠加在日本海沟俯冲带上.
虽然上述两种关于2011年日本9.0级地震震源物理机制分析表明,不同性质的断层段在同震过程中会表现更多的组合形式,断层发震能力判定结果存在更多的不确定性,但震前关于大型构造带发震能力的正确判断也非个案.例如,对于2010年智利8.8级地震(Madariaga et al., 2010; Moreno et al., 2010; Vigny et al., 2011)和2005年苏门答腊8.7级地震(Prawirodirdjo et al., 2010),基于震前GPS观测给出断层运动强闭锁区与同震滑移极值区空间上比较一致.因此,利用区域形变观测等资料给出震间断层运动特征的研究工作对于断层强震发震能力的判定具有非常重要的实际意义,而且随着观测资料和相关研究的积累,区域强震断层运动模型会变得越来越明确.
本文只计算了震后短期内震后余滑所引起的断层运动,更多地讨论震后余滑空间分布短期内随时间演化情况,而没有涉及震后更长时间内黏滞松弛所引起的作用,这需要累积更长时间的地壳变形,综合相关地球物理观测进一步研究确定.另一方面,已有断层运动模型建立过程中更多地参考板块俯冲区域强震断层活动,而对于建立中国大陆地区具体不同类型大型断裂的强震断层运动学模型是否能借鉴相关研究结果是值得深入研究的科学问题. 致谢 感谢JPL提供的日本9.0级地震同震GPS位移场解算结果;USGS提供的日本9.0级地震余震目录;感谢德国波茨坦地学中心Dr.Wang提供的断层位错反演程序;感谢两位匿名审稿者建设性修改意见.
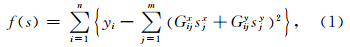

图 3 位错模型粗糙度与数据拟合度曲线
(a)、(b)和(c)分别是主震、震后和震间粗糙度和拟合度曲线,粗糙度为归一化粗糙度.Fig. 3 Trade-off curve between the roughness of slip model and the fitting degree of data
From(a)to(c)is the trade-off curve of coseismic,postseismic and interseismic,respectively, and the roughness is normalized roughness.

图 4 基于Model A反演同震位错分布图
(a)、(b)和(c)分别是位错大小、位错走向分量(与走向相同为正,相反为负)和位错倾向分量(向上为负,向下为正).Fig. 4 The inversed coseismic slip distribution of Model A
From(a)to(c)is the distribution of the absolute slip and the slip component along the strike and dip directions,respectively(the slip is positive along the strike and downdip directions).

图 5 基于Model B反演同震位错分布图
(a)、(b)和(c)分别是位错大小、位错走向分量(与走向相同为正,相反为负)和位错倾向分量(向上为负,向下为正),其中震源机制解为2011年3月9日MW7.3前震序列中MW≥5.0余震.Fig. 5 The inversed coseismic slip distribution of Model B
From(a)to(c)is the distribution of the absolute slip and the slip component along the strike and dip directions,respectively(the slip is positive along the strike and downdip directions). The focal mechanism solutions are about the MW≥5.0 seismic events of the MW7.3 foreshock sequences,March 9,2011.

图 6 同震地表位移的理论模拟值与观测值间误差分析
Model B东西向误差(a1);南北向误差(b1);垂向误差(c1);Model A东西向误差(a2);南北向误差(b2);垂向误差(c2).Fig. 6 The residual analysis between the values of simulation and observation of coseismic surface displacement
The E-W residuals of Model B(a1),the N-S residuals of Model B(b1),the vertical residuals of Model B(c1),the E-W residuals of Model A(a2),the N-S residuals of Model A(b2),the vertical residuals of Model A(c2).

图 7 同震地表位移分布图
(a)和(b)分别是水平位移和垂向位移,其中红色箭头为GPS观测给出的同震位移,粉色箭头为声纳和GPS联合观测给出的海底同震位移,蓝色和绿色箭头为基于Model B反演位错模型计算所得同震地表位移.Fig. 7 The distribution of coseismic surface displacement
(a)Horizontal displacement and (b)vertical displacement. The red arrows are coseismic displacement of GPS observation,the pink arrows are coseismic seafloor displacement of joint observation of sonar and GPS,the blue and green arrows are computed coseismic surface displacement based on the slip inversion results of Model B.

图 8 震间断层运动速率倾向分量分布图(向上为负,向下为正)
其中虚线为推断的震间断层闭锁深度,五角星表示不同机构给出的震中位置(参数见表 2),黑色虚线为本文推断的震间短册闭 锁线,黑色实线为1926—2010年日本海沟地区M≥7地震破裂区.Fig. 8 The distribution of velocity component of interseismic fault motion along downdip direction(the value is positive when along the downdip direction)
The dash line represent the inferred lock depth of fault during the interseismic period,the stars indicate the epicenter locations given by different institutions(the parameters are shown in table 2),the black dash line is the inferred lock depth of fault during the interseismic period from our research, and the black solid lines depict the rupture areas of M≥7 events in the trench areas of Japan during 1929 to 2010.

图 9 震间地表位移分布图
其中红色色箭头为GPS观测给出的震间位移,蓝色为基于 Model B反演位错模型计算所得震间地表位移,红色方块为地 表变形参考点(138.334°E,37.231°N).Fig. 9 The distribution of interseismic surface displacement
The red arrows are interseismic displacement given by GPS observation,blue arrows are computed values based on the slip inversion results of Model B, and red square represents the reference location of surface deformation(138.334°E,37.231°N).
![]()
表 2 日本9.0级地震主震震源参数Table 2 The source parameters of the main shock of Japan 9.0 earthquake

图 10 震后地表位移和震后余滑分布图
其中红色色箭头为GPS观测给出的震后位移,红色为基于Model B反演位错模型计算所得震后地表位移,灰色等值线为震后余滑空间分布(单位为m);(a)震后8 h;(b)2011-03-12—2011-04-12;(c)2011-04-12—2011-05-12;(d)2011-05-12—2011-06-12;(e)2011-06- 12—2011-07-12;(f)2011-07-12—2011-08-12;(g)2011-08-12—2011-09-12;(h)2011-09-12—2011-10-12.Fig. 10 The distribution of postseismic surface displacement and afterslip
The red arrows are postseismic displacement given by GPS observation,blue arrows are computed values based on the slip inversion results of Model B, and gray contour lines depict the distribution of postseismic afterslip(unit is m),(a)8 hours after the earthquake,(b)2011-03-12—2011-04-12;(c)2011-04-12—2011-05-12,(d)2011-05-12—2011-06-12;(e)2011-06-12—2011-07-12,(f)2011-07- 12—2011-08-12,(g)2011-08-12—2011-09-12;(h)2011-09-12—2011-10-12.

图 11 震后MW≥5.0余震月频次随时间变化曲线图(时间窗长1个月,滑动步长1天)Fig. 11 The plot of monthly frequency of MW≥5.0 aftershocks changing with time

图 12 日本海沟地区断层运动模式图Fig. 12 The pattern diagram of fault motion at the trench areas of Japan
| [1] | Ammon J C, Lay T, Kanamori H, et al. 2011. A rupture model of the 2011 off the Pacific coast of Tohoku earthquake. Earth Planets Space, 63(7): 693-696, doi: 10.5047/eps.2011.05.015. |
| [2] | Ando R, Imanishi K. 2011. Possibility of MW9.0 mainshock triggered by diffusional propagation of after-slip from MW7.3 foreshock. Earth Planets Space, 63(7): 767-771. |
| [3] | Chen P F, Bina C R, Okal E A. 2004. A global survey of stress orientations in subducting slabs as revealed by intermediate-depth earthquakes. Geophys. J. Int., 159(2): 721-733. |
| [4] | Chu R S, Wei S J, Helmberger D V, et al. 2011. Initiation of the great MW9.0 Tohoku-Oki earthquake. Earth and Planetary Science Letters, 308: 277-283, doi: 10.1016/j.epsl.2011.06.031. |
| [5] | Department of Earthquake Monitoring and Prediction, China Earthquake Administrition. 2007. Summary of the Asian Earthquake (in Chinese). Beijing: Seismological Press. |
| [6] | Diao F Q, Xiong X, Wang R J, et al. 2014. Overlapping post-seismic deformation processes: afterslip and viscoelastic relaxation following the 2011 MW9.0 Tohoku (Japan) earthquake. Geophys. J. Int., 196(1): 218-299, doi: 10.1093/gji/ggt376. |
| [7] | Diao F Q, Xiong X, Ni S D, et al. 2011. Slip model for the 2011 MW9.0 Sendai (Japan) earthquake and its MW7.9 aftershock derived from GPS data. Chinese Sci. Bull., 56(27): 2941-2947, doi: 10.1007/s11434-011-4643-4. |
| [8] | Diao F Q, Xiong X, Zheng Y. 2012. Static slip model of the MW9.0 Tohoku (Japan) earthquake: results from joint inversion of terrestrial GPS data and seafloor GPS/acoustic data. Chinese Sci. Bull., 57(16): 1990-1997, doi: 10.1007/s11434-5014-5. |
| [9] | Hashimoto C, Noda A, Sagiya T, et al. 2009. Interplate seismogenic zones along the Kuril-Japan trench inferred from GPS data inversion. Nature Geoscience, 2(2): 141-144, doi: 10.1038/NGEO421. |
| [10] | Hayes G P, Wald D J. 2009. Developing framework to constrain the geometry of the seismic rupture plane on subduction interfaces a priori: A probabilistic approach. Geophys. J. Int., 176(3): 951-964, doi: 10.1111/j.1365-246X.2008.04035.x. |
| [11] | Hayes G P, Wald D J, Keranen K. 2009. Advancing techniques to constrain the geometry of the seismic rupture plane on subduction interfaces a priori: Higher order functional fits. Geochem., Geophys., Geosyst., 10(9): Q09006, doi: 10.1029/2009GC002633. |
| [12] | Hayes G P. 2011. Updated Result of the Mar 11, 2011 MW9.0 Earthquake Offshore Honshu, Japan. http://earthquake.usgs.gov/earthquakes/eqinthenews/2011/ usc0001xgp/finite_fault.php. |
| [13] | Hayes G P, Wald D J, Johnson R L. 2012. Slab 1.0: A three-dimensional model of global subduction zone geometries. J. Geophys. Res., 117(B1): B01302, doi: 10.1029/2011JB008524. |
| [14] | Hirose F, Miyaoka K, Hayashimoto N, et al. 2011. Outline of the 2011 off the Pacific coast of Tohoku earthquake(MW9.0)-seismicity: foreshocks, mainshock, aftershocks, and induced activity. Earth Planets Space, 63(7): 513-518. |
| [15] | Iinuma T, Hino R, Kido M, et al. 2012. Coseismic slip distribution of the 2011 off the Pacific Coast of Tohoku Earthquake (M9.0) refined by means of seafloor geodetic data. J. Geophys. Res., 117(B7): B07409, doi: 10.1029/2012JB009186. |
| [16] | Kanamori H. 1977. Seismic and aseismic slip along subduction zones and their tectonic implications. // Talwani M, Pitman W C III, eds. Island Arcs, Deep Sea Trenches and Back Arc Basins. New York: American Geophysical Union, 163-174. |
| [17] | Kanamori H, Miyazawa M, Mori J. 2006. Investigation of the earthquake sequence off Miyagi prefecture with historical seismograms. Earth Planets Space, 58(12): 1533-1541. |
| [18] | Kido M, Osada Y, Fujimoto H, et al. 2011. Trenchnormal variation in observed seafloor displacements associated with the 2011 Tohoku-Oki earthquake. Geophys. Res. Lett., 38(24): L24303, doi: 10.1029/2011GL050057. |
| [19] | Kiser E, Ishii M. 2012. The March 11, 2011 Tohoku-Oki earthquake and cascading failure of the plate interface. Geophys. Res. Lett., 39(7): L00G25, doi: 10.1029/2012GL051170. |
| [20] | Kodair S, No T, Nakamura Y, et al. 2012. Coseismic fault rupture at the trench axis during the 2011 Tohoku-oki earthquake. Nature Geoscience, 5(9): 646-650, doi: 10.1038/NGEO1547. |
| [21] | Koketsu K, Yokota Y, Nishimura N, et al. 2011. A unified source model for the 2011 Tohoku earthquake. Earth Planet. Sci. Lett., 310(3-4): 480-487, doi: 10.1016/j.epsl.2011.09.009. |
| [22] | Kuroishi Y, Sagiya T, Sengoku A, et al. 2007. Report of the geodetic works in Japan for the period January 2003 to December 2006.http://www.soc.nii.ac.jp/geo-soc/iugg2007. |
| [23] | Lay T, Ammon C J, Kanamori H, et al. 2011. Possible large near trench slip during the 2011 MW9.0 off the Pacific coast of Tohoku earthquake. Earth, Planets and Space, 63(7): 687-692, doi: 10.5047/eps.2011.05.033. |
| [24] | Loveless J P, Meade B J. 2010. Geodetic imaging of plate motions, slip rates, and partitioning of deformation in Japan. J. Geophys. Res., 115(B2), doi: 10.1029/2008JB006248. |
| [25] | Loveless J P, Meade B J. 2011. Spatial correlation of interseismic coupling and coseismic rupture extent of the 2011 MW9.0 Tohoku-oki earthquake. Geophys. Res. Lett., 38(17): doi: 10.1029/2011GL048561. |
| [26] | Madariaga R, Métois M, Vigny C, et al. 2010. Central Chile finally breaks. Science, 328(5975): 181-182, doi: 10.1126/science.1189197. |
| [27] | Marone C. 1998. Laboratory-derived friction and their application to seismic faulting. Annu. Rev. Earth Planet. Sci., 26: 643-696. |
| [28] | Miura S, Takahashi N, Nakanishi A, et al. 2005. Structural characteristics off Miyagi forearc region, the Japan Trench seismogenic zone, deduced from a wide-angle reflection and refraction study. Tectonophysics, 407(3-4): 165-188. |
| [29] | Miyazaki S, McGuire J J, Segall P. 2011. Seismic and aseismic fault slip before and during the 2011 off the Pacific coast of Tohoku earthquake. Earth Planets Space, 63(7): 637-642. |
| [30] | Moreno M, Rosenau M, Oncken O. 2010. 2010 Maule earthquake slip correlates with pre-seismic locking of Andean subduction zone. Nature, 467(7312): 198-204, doi: 10.1038/nature09349. |
| [31] | Nakajima J, Hasegawa A. 2006. Anomalous low-velocity zone and linear alignment of seismicity along it in the subducted Pacific slab beneath Kanto, Japan: reactivation of subducted fracture zone? Geophys. Res. Lett., 33(16): L16309, doi: 10.1029/2006GL026773. |
| [32] | Nishimura T, Hirasawa T, Miyazaki S, et al. 2004. Temporal change of interplate coupling in northeastern Japan during 1995—2002 estimated from continuous GPS observations. Geophys. J. Int., 157(2): 901-916, doi: 10.1111/j.1365-246X.2004.02159.x. |
| [33] | Noda H, Lapusta N. 2013. Stable creeping fault segments can become destructive as a result of dynamic weakening. Nature, 493(7433): 518-523, doi: 10.1038/nature11703. |
| [34] | Ozawa S, Nishimura T, Suito H, et al. 2011. Coseismic and postseismic slip of the 2011 magnitude-9 Tohoku-Oki earthquake. Nature, 475(7356): 373-377, doi: 10.1038/nature10227. |
| [35] | Ozawa S, Nishimura T, Munekane H, et al. 2012. Preceding, coseismic, and postseismic slip of the 2011 Tokoku earthquake, Japan. .J. Geophys. Res., 117(B7): B07404, doi: 101029/2011JB009120. |
| [36] | Pollitz F F, Bürgmann R, Banerjee P. 2011. Geodetic slip model of the 2011 M9.0 Tohoku earthquake. Geophys. Res. Lett., 38(7): L00G08, doi: 10.1029/2011GL048632. |
| [37] | Prawirodirdjo L, McCaffrey R, Chadwell C D, et al. 2010. Geodetic observations of an earthquake cycle at the Sumatra subduction zone Role of interseismic strain segmentation. J. Geophys. Res., 115(B3), doi: 10.1029/2008JB006139. |
| [38] | Sagiya T, Miyazaki S, Tada T. 2000. Continuous GPS array and present-day crustal deformation of Japan. Pure and Applied Geophysics, 157(11-12): 2303-2322. |
| [39] | Sagiya T. 2004. A decade of GEONET: 1994—2003—the continuous GPS observation in Japan and its impact on earthquake studies. Earth Planets Space, 56(8): XXIX-XLI. |
| [40] | Sato M, Ishikawa T, Ujihara N. 2011. Displacement above the hypocenter of the 2011 Tohoku-Oki earthquake. Science, 332(6036): 1395, doi: 10.1126/science.1207401. |
| [41] | Scholz C H. 1998. Earthquakes and friction laws. Nature, 391(6662): 37-42. |
| [42] | Shao G F, Li X Y, Ji C, et al. 2011. Focal mechanism and slip history of the 2011 MW9.1 off the Pacific coast of Tohoku earthquake, constrained with teleseismic body and surface waves. Earth Planets Space, 63(7): 559-564, doi: 10.5047/eps.2011.06.028. |
| [43] | Taira A. 2001. Tectonic evolution of the Japanese island arc system. Annu. Rev. Earth Planet. Sci., 29: 109-134. |
| [44] | Tajima F, Mori J, Kennett B L N. 2013. A review of the 2011 Tohoku-Oki earthquake (MW9.0): large-scale rupture across heterogeneous plate coupling. Tectonophysics, 586: 15-34 |
| [45] | Takeuchi M, Sato T, Shinbo T. 2008. Stress due to the interseismic back slip and its relation with the focal mechanisms of earthquakes occurring in the Kuril and northeastern Japan arcs. Earth Planets Space, 60(6): 549-557. |
| [46] | The Headquarters for Earthquake Research Promotion. 2005. Summary of long-term evaluation of trench-type earthquakes. http://www.jishin.go.jp/main/p_hyoka02_chouki.htm. |
| [47] | Tse S T, Rice J R. 1986. Crustal earthquake instability in relation to the depth variation of friction slip properties. J. Geophys. Res., 91(B9): 9452-9472 |
| [48] | Uchida N, Matsuzawa T. 2011. Coupling coefficient, hierarchical structure, and earthquake cycle for the source area of the 2011 off the Pacific coast of Tohoku earthquake inferred from small repeating earthquake data. Earth Planets Space, 63(7): 675-679, doi: 10.5047/eps.2011.07.006. |
| [49] | Vigny C, Socquet A, Peyrat S, et al. 2011. The 2010 MW8.8 Maule megathrust earthquake of central chile, monitored by GPS. Science, 332(6036): 1417-1421, doi: 10.1126/science.1204132. |
| [50] | Wang R, Xia Y, Grosser H, et al. 2004. The 2003 Bam (SE Iran) earthquake: precise source parameters from satellite radar Interferometry. Geophys. J. Int., 159(3): 917-922, doi: 10.1111/j.1365-246X.2004.02476.x. |
| [51] | Ward S N, Barrientos S E. 1986. An inversion for slip distribution and fault shape from geodetic observations of 1983, Borah Peak, Idaho, earthquake. J. Geophys. Res., 91(B5): 9409-4919. |
| [52] | Yamaoka K. 2007. Earthquakes mechanism and prediction. http://www.soi.wide.ad.jp. |
| [53] | Yao H J, Gerstoft P, Shearer P M, et al. 2011. Compressive sensing of the Tohoku-Oki Mw9.0 earthquake: frequency-dependent rupture modes. Geophys. Res. Lett., 38(20): L20310, doi: 10.1029/2011GL049223. |
| [54] | Zhang Y, Wang R J, Zschau J, et al. 2014. Automatic imaging of earthquake rupture processes by iterative deconvolution and stacking of high-rate GPS and strong motion seismograms. J. Geophys. Res., 119(7): 5633-5650, doi: 10.1002/2013JB010469. |
| [55] | 刁法启, 熊熊, 倪四道等. 2011. 利用GPS位移反演日本MW9.0仙台地震及MW7.9强余震静态位错模型. 科学通报, 56(24): 1999-2005. |
| [56] | 刁法启, 熊熊, 郑勇. 2012. MW9.0日本Tohoku大地震静态位错模型: 陆地GPS资料和海底GPS/Acoustic资料联合反演的结果. 科学通报, 57(18): 1676-1683. |
| [57] | 中国地震局监测预报司. 2007. 亚洲地震概要. 北京: 地震出版社. |