 2023, Vol. 44
文章信息
- 姚承志, 张敏, 曾雨可, 张译匀, 吴霞, 熊文婧, 让蔚清.
- Yao Chengzhi, Zhang Min, Zeng Yuke, Zhang Yiyun, Wu Xia, Xiong Wenjing, Rang Weiqing
- 中国甲状腺癌发病和死亡趋势分析与预测
- Analysis and prediction of thyroid cancer morbidity and mortality trends in China
- 中华流行病学杂志, 2023, 44(6): 917-923
- Chinese Journal of Epidemiology, 2023, 44(6): 917-923
- http://dx.doi.org/10.3760/cma.j.cn112338-20221010-00869
-
文章历史
收稿日期: 2022-10-10


2. 南华大学附属第一医院中医科, 衡阳 421001
2. Department of Traditional Chinese Medicine, The First Affiliated Hospital of University of South China, Hengyang 421001, China
中国肿瘤登记数据及国际癌症研究中心报告显示,中国及全球甲状腺癌发病和死亡人数均有不同程度的上升[1-4]。提示中国及全球甲状腺癌防控形势日益严峻。随着人口老龄化、过度诊疗等因素的影响,甲状腺癌防控正面临新的挑战。为全面了解中国甲状腺癌发病和死亡趋势变化,更好地为甲状腺癌防控工作提供参考依据,本研究利用Joinpoint连接点回归模型描述中国1990-2019年甲状腺癌发病和死亡趋势,并通过构建GM(1,1)模型预测未来发病和死亡情况。
资料与方法1. 资料来源:来源于2019全球疾病负担(GBD)数据库(http://ghdx.healthdata.org/),按照相关步骤提取1990-2019年甲状腺癌发病和死亡数据[5]。为了提高可比性,便于比较国外甲状腺癌发病和死亡情况,标化率数据采用由GBD项目提供的2019年全球标准人口进行标化[6]。计算指标包括粗发病率(CIR)、粗死亡率(CMR)、年龄标化发病率(ASIR)、年龄标化死亡率(ASMR)。依照国际疾病分类第九版、第十版分别对1990-2001年、2002-2019年甲状腺癌数据进行提取,编码分别为193~193.9、226~226.9和C73~C73.9、D09.3、D09.8、D34~D34.9、D44.0。
2. 数据质量评价:中国地区数据主要可以追溯到两个来源:中国疾病监测点系统和生命统计系统,覆盖全国605个监测点,总监测人口约占全国的24%[7],包括33个省级行政单位(22个省、4个直辖市、5个自治区和2个特别行政区),并利用标准化工具确保各项数据的一致性[8]。本研究采用双录入的方式,将各项数据进行比对,确保数据准确性。
3. 研究方法:
(1)Joinpoint连接点回归模型:该模型将长期趋势科学地分成若干段,计算每个连接点的P值及其95%CI。指标包括年度变化百分比(APC),平均年度变化百分比(AAPC)[5]。以P < 0.05为差异有统计学意义。模型拟合采用Joinpoint 4.9.0.1软件进行分析,绘图采用Excel 2019软件。
(2)GM(1,1)模型:
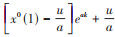
① 模型建立:利用matlabR2021a软件构建灰色模型GM(1,1)与结果可视化。以2012-2019年发病和死亡数据为基础预测2020-2029年发病和死亡情况。步骤包括构建原始时间序列x0(t)、累积生成序列(accumulating generation operator,AGO)x1(t)、紧邻均值序列z1(t)、建立GM(1,1)预测模型方程和逆AGO。可得预测模型:
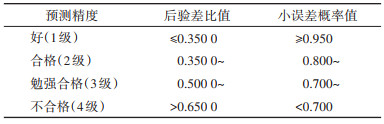
② 模型拟合检验和预测效果评价:残差检验法通过比较观察值与预测值的差值来计算平均相对误差(e)与预测精度(ρ),当e≤10.00%且ρ > 80.00%时认为预测结果较优。后验误差法通过计算后验差比(C)值与小误差概率(P)对模型精度进行等级判定。见表 1。
1. 总体发病和死亡趋势:1990-2019年全国CIR和ASIR呈上升趋势,AAPC值分别为4.15%(95%CI:3.86%~4.44%,P < 0.001)、2.47%(95%CI:2.12%~2.83%,P < 0.001)。全国CMR呈上升趋势,AAPC为2.09%(95%CI:1.92%~2.25%,P < 0.001)。ASMR总体呈波动下降趋势,AAPC为-0.29%(95%CI:-0.47%~ -0.10%,P=0.003)。见图 1。

|
| 图 1 1990-2019年全国及分性别甲状腺癌发病和死亡趋势 |
2. 分性别发病和死亡趋势:1990-2019年男性、女性的CIR和ASIR呈上升趋势,女性CIR和ASIR均始终高于男性,男性、女性CIR的AAPC值分别为5.98%(95%CI:5.65%~6.31%,P < 0.001)、3.23%(95%CI:2.94%~3.53%,P < 0.001),ASIR的AAPC值分别为3.98%(95%CI:3.68%~4.29%,P < 0.001),1.65%(95%CI:1.38%~1.93%,P < 0.001)。男性、女性CMR均呈上升趋势,AAPC值分别为3.68%(95%CI:3.45%~3.90%,P < 0.001)、0.60%(95%CI:0.50%~0.71%,P < 0.001)。男性ASMR呈先下降(1990-1994年)后上升(1994-2012年)再下降(2012-2019年)的波动趋势(AAPC=1.35%,95%CI:1.16%~1.53%,P < 0.001)。女性ASMR呈持续下降趋势(AAPC=-1.70%,95%CI:-1.82%~ -1.58%,P < 0.001)。见图 1。
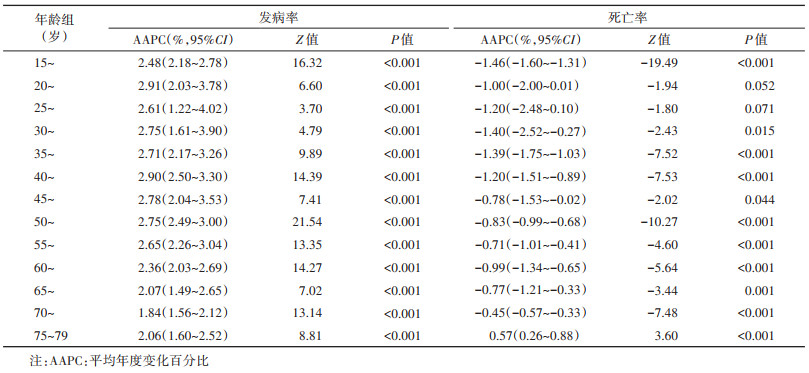
3. 年龄别发病和死亡趋势:除20~24岁组(P=0.052)、25~29岁组(P=0.071)死亡趋势差异无统计学意义,其余结果均差异有统计学意义(P < 0.05)。在发病趋势中,上升最快的是20~24岁组,AAPC=2.91%(95%CI:2.03%~3.78%,P < 0.001),其次为40~44岁组,AAPC=2.90%(95%CI:2.50%~3.30%,P < 0.001)。在死亡趋势中,除75~79岁组呈上升趋势外(AAPC=0.57%,95%CI:0.26%~0.88%,P < 0.001),其余年龄组均呈下降趋势。见表 2。在2019年,发病率在低年龄组时已经逐步升高,死亡率在50~54岁组前较低,其后快速升高。见图 2。

|
| 图 2 2019年全国分年龄组甲状腺癌发病和死亡情况 |
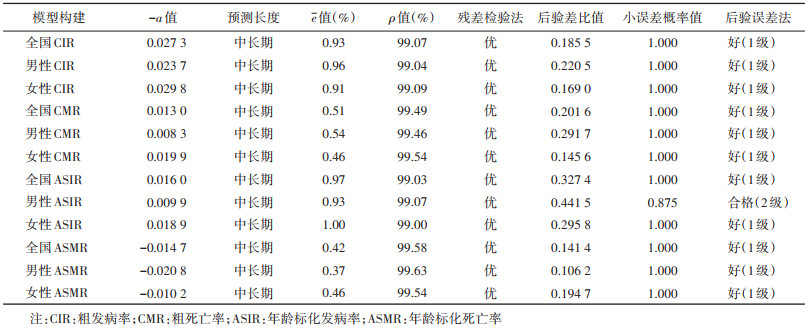
4. 模型评价:所有模型满足-a≤0.300 0,表明均可进行中长期预测。残差检验法结果显示:所有e≤10.00%且ρ > 80.00%,表明模型预测效果均优。后验误差法结果显示:预测精度除男性ASIR为合格(2级)外,其余均为好(1级)。见表 3。
5. 全国及分性别发病和死亡预测:CIR和ASIR均呈上升趋势,2029年全国、男性、女性CIR分别为3.57/10万、2.78/10万、4.40/10万,ASIR分别为2.38/10万、1.89/10万、2.88/10万。CMR呈上升趋势,ASMR相反,2029年全国、男性、女性CMR分别为0.57/10万、0.62/10万、0.53/10万,ASMR分别为0.33/10万、0.42/10万、0.27/10万。见图 3。

|
| 图 3 中国甲状腺癌发病和死亡的预测 |
全球甲状腺癌发病和死亡情况存在差异,一些国家发病率较高,然而许多国家死亡率较低[1, 9-11]。本研究结果显示,2019年中国甲状腺癌ASIR、ASMR分别为2.05/10万、0.39/10万,低于同年世界平均水平(2.83/10万、0.56/10万)、美国(5.59/10万、0.43/10万)、北非和中东地区总体水平(3.5/10万、0.5/10万)[11-12]。但有研究表明,甲状腺癌发生与社会经济水平等有关,发达国家男、女性发病风险分别比发展中国家高4.0倍、5.5倍[1-2, 13]。当前中国经济快速发展,提示需密切关注甲状腺癌防控。
本研究发现男、女性的CIR、ASIR呈上升趋势,女性CIR、ASIR始终高于男性,与其他研究结果一致[11-12, 14]。这可能与过度诊断有关:有研究认为甲状腺癌增加主要是由于超声等医学成像分辨率的提高过度诊断出大量亚临床乳头状癌[9],相较于男性,女性更愿意寻求医学诊治,过度诊断比例较高,发现乳头状癌(< 2 cm)的女性约为男性的4倍[1, 9, 14]。此外也应关注雌激素、不孕史等生理差异因素[1, 13]。近年来韩国、美国发病率保持稳定,甚至近10年美国女性发病率下降[1, 10-11],这可能与指南的更新有关。但目前相较于美国,中国过度诊断可能更为普遍[15]。提示进行甲状腺癌诊断时需谨慎,加强对女性群体发病风险的防控。
本研究发现男性CMR、ASMR分别在2008、2004年超过女性。可能是由于生活水平日益提升,超重/肥胖在男性群体中更多见,BMI水平越高与甲状腺癌死亡风险增加有关[12, 16]。经宣传教育后女性更倾向健康的生活方式,而男性不良生活习惯较多,影响甲状腺癌的发生和预后[17-18]。此外也要注意人口老龄化日益加深的影响,相较于女性,男性病程较晚,侵袭性较强,恶性率较高,预后较差[13, 19]。与2020年全球甲状腺癌ASMR相比,中国男性ASMR高于世界平均水平,女性相反[1]。随着人口老龄化加深,提示需加强宣传教育,保持健康体重,重视对男性群体死亡风险的防控。
甲状腺癌死亡率在50~54岁组前较低,其后快速升高,而发病率在低年龄组时已经快速升高,与其他研究结果基本一致[13, 20-21]。这可能与头颈部放疗史和电离照射史有关,儿童和青少年时期暴露于电离辐射是发生甲状腺癌的危险因素[1, 9, 22]。有研究报告发病高峰在50~54岁组,死亡高峰在≥75岁[20],本研究结果显示发病和死亡高峰均在75~79岁组。值得注意的是甲状腺癌发病率在40~44岁组与55~59岁组有两个小高峰,这可能与乳头状癌在中年时发病率达到峰值、男性进入更年期和女性进入围绝经期引起的生理变化,以及对中年人甲状腺的严密检查有关[10, 21, 23]。提示应重视高龄死亡风险和低龄时就已上升的发病风险。
值得思考的是2011年后全国CMR上升放缓,ASMR由上升转变为下降趋势。可能是由于2012年《甲状腺结节和分化型甲状腺癌诊治指南》的制定和实施,2012年的指南强调超声和细针穿刺活检对甲状腺癌诊断的作用,有助于避免不必要的手术和并发症;在手术切除范围上强调适应证,并重视淋巴结清扫,有效降低了转移复发的风险;更强调了对甲状腺结节的治疗建议,有效提升了诊治水平[24-25]。另外考虑灰色模型适用于小样本预测研究,因此本研究选取2012-2019年发病和死亡数据来预测未来10年情况。结果显示除ASMR有所下降外,其余指标均呈上升趋势,与其他研究结果基本一致[26]。
本研究数据来源于GBD数据库,包括发病、死亡及其粗率、标化率,更是特别关注指南所引起的预测变化,预测数据选择较合理。
本研究存在局限性。2020-2029年甲状腺癌的预测结果是基于模型预测的结果,其值可能随着数据完善、方法优化而发生变化,另外因数据库局限,未能更深入地分析城乡差异。
综上所述,全国、男性、女性ASMR近10年呈下降趋势,2019年中国甲状腺癌ASIR、ASMR低于世界平均水平,提示不断完善、规范的诊疗对甲状腺癌诊治发挥了重要作用。但全国、男性、女性的CIR、ASIR、CMR呈上升趋势,预测结果显示未来可能继续上升,且中国人口老龄化日益加剧,提示甲状腺癌防控仍然十分严峻。
利益冲突 所有作者声明无利益冲突
作者贡献声明 姚承志:统计分析、论文撰写;张敏、曾雨可、张译匀、吴霞、熊文婧:数据整理、论文修改;让蔚清:研究指导、论文修改、经费支持
| [1] |
Sung H, Ferlay J, Siegel RL, et al. Global cancer statistics 2020: GLOBOCAN estimates of incidence and mortality worldwide for 36 cancers in 185 countries[J]. CA Cancer J Clin, 2021, 71(3): 209-249. DOI:10.3322/caac.21660 |
| [2] |
Bray F, Ferlay J, Soerjomataram I, et al. Global cancer statistics 2018: GLOBOCAN estimates of incidence and mortality worldwide for 36 cancers in 185 countries[J]. CA Cancer J Clin, 2018, 68(6): 394-424. DOI:10.3322/caac.21492 |
| [3] |
赫捷, 魏文强. 2019中国肿瘤登记年报[M]. 北京: 人民卫生出版社, 2021: 198-199. He J, Wei WQ. 2019 China cancer registry annual report[M]. Beijing: People's Medical Publishing House, 2021: 198-199. |
| [4] |
赫捷. 2018中国肿瘤登记年报[M]. 北京: 人民卫生出版社, 2019: 178-179. He J. 2018 China cancer registry annual report[M]. Beijing: People's Medical Publishing House, 2019: 178-179. |
| [5] |
闫晓晋, 林是琦, 李佳佳, 等. 1990-2019年中国儿童青少年智力残疾疾病负担变化趋势研究[J]. 中华流行病学杂志, 2022, 43(8): 1262-1268. DOI:10.3760/cma.j.cn112338-20220303-00165 Yan XJ, Lin SQ, Li JJ, et al. Trends of the disease burden of intellectual disability among children and adolescents from 1990 to 2019 in China[J]. Chin J Epidemiol, 2022, 43(8): 1262-1268. DOI:10.3760/cma.j.cn112338-20220303-00165 |
| [6] |
GBD 2019 Demographics Collaborators. Global age-sex- specific fertility, mortality, healthy life expectancy (HALE), and population estimates in 204 countries and territories, 1950-2019: a comprehensive demographic analysis for the global burden of disease study 2019[J]. Lancet, 2020, 396(10258): 1160-1203. DOI:10.1016/S0140-6736(20)30977-6 |
| [7] |
Liu SW, Wu XL, Lopez AD, et al. An integrated national mortality surveillance system for death registration and mortality surveillance, China[J]. Bull World Health Organ, 2016, 94(1): 46-57. DOI:10.2471/BLT.15.153148 |
| [8] |
Ma QF, Li R, Wang LJ, et al. Temporal trend and attributable risk factors of stroke burden in China, 1990-2019: an analysis for the Global Burden of Disease Study 2019[J]. Lancet Public Health, 2021, 6(12): e897-906. DOI:10.1016/S2468-2667(21)00228-0 |
| [9] |
Seib CD, Sosa JA. Evolving understanding of the epidemiology of thyroid cancer[J]. Endocrinol Metab Clin North Am, 2019, 48(1): 23-35. DOI:10.1016/j.ecl.2018.10.002 |
| [10] |
Pizzato M, Li MM, Vignat J, et al. The epidemiological landscape of thyroid cancer worldwide: GLOBOCAN estimates for incidence and mortality rates in 2020[J]. Lancet Diabetes Endocrinol, 2022, 10(4): 264-272. DOI:10.1016/S2213-8587(22)00035-3 |
| [11] |
Schuster-Bruce J, Jani C, Goodall R, et al. A comparison of the burden of thyroid cancer among the European union 15+ countries, 1990-2019: estimates from the global burden of disease study[J]. JAMA Otolaryngol Head Neck Surg, 2022, 148(4): 350-359. DOI:10.1001/jamaoto.2021.4549 |
| [12] |
Nejadghaderi SA, Moghaddam SS, Azadnajafabad S, et al. Burden of thyroid cancer in North Africa and Middle East 1990-2019[J]. Front Oncol, 2022, 12: 955358. DOI:10.3389/fonc.2022.955358 |
| [13] |
Li YZ, Piao JM, Li M. Secular trends in the epidemiologic patterns of thyroid cancer in China over three decades: an updated systematic analysis of global burden of disease study 2019 data[J]. Front Endocrinol, 2021, 12: 707233. DOI:10.3389/fendo.2021.707233 |
| [14] |
Lamartina L, Leboulleux S, Borget I, et al. Global thyroid estimates in 2020[J]. Lancet Diabetes Endocrinol, 2022, 10(4): 235-236. DOI:10.1016/S2213-8587(22)00048-1 |
| [15] |
Zhu J, Sun KX, Wang J, et al. Clinicopathological and surgical comparisons of differentiated thyroid cancer between China and the USA: a multicentered hospital-based study[J]. Front Public Health, 2022, 10: 974359. DOI:10.3389/fpubh.2022.974359 |
| [16] |
Shin A, Cho S, Jang D, et al. Body mass index and thyroid cancer risk: a pooled analysis of half a million men and women in the Asia cohort consortium[J]. Thyroid, 2022, 32(3): 306-314. DOI:10.1089/thy.2021.0445 |
| [17] |
平卫伟, 谭红专, 曹文君, 等. 成年人生活方式与体质指数的相关性研究[J]. 中华疾病控制杂志, 2016, 20(11): 1184-1186. DOI:10.16462/j.cnki.zhjbkz.2016.11.027 Ping WW, Tan HZ, Cao WJ, et al. Correlation study between lifestyle and BMI in adults[J]. Chin J Dis Control Prev, 2016, 20(11): 1184-1186. DOI:10.16462/j.cnki.zhjbkz.2016.11.027 |
| [18] |
陆凤, 应丹妮, 龚巍巍, 等. 浙江省甲状腺癌患病影响因素的配对病例对照研究[J]. 中华流行病学杂志, 2018, 39(10): 1387-1393. DOI:10.3760/cma.j.issn.0254-6450.2018.10.018 Lu F, Ying DN, Gong WW, et al. Factors related to thyroid carcinoma in Zhejiang province: a matched case-control study[J]. Chin J Epidemiol, 2018, 39(10): 1387-1393. DOI:10.3760/cma.j.issn.0254-6450.2018.10.018 |
| [19] |
国家卫生健康委老龄健康司. 2020年度国家老龄事业发展公报[EB/OL]. (2021-10-15)[2022-11-21]. http://www.nhc.gov.cn/lljks/pqt/202110/c794a6b1a2084964a7ef45f69bef5423.shtml.
|
| [20] |
Wang JY, Yu FF, Shang YN, et al. Thyroid cancer: incidence and mortality trends in China, 2005-2015[J]. Endocrine, 2020, 68(1): 163-173. DOI:10.1007/s12020-020-02207-6 |
| [21] |
沈婉莹, 谢靖, 周维, 等. 2005-2015年中国甲状腺癌死亡趋势分析[J]. 实用预防医学, 2021, 28(6): 641-644. DOI:10.3969/j.issn.1006-3110.2021.06.001 Shen WY, Xie J, Zhou W, et al. Trend of deaths from thyroid cancer in China, 2005-2015[J]. Pract Prev Med, 2021, 28(6): 641-644. DOI:10.3969/j.issn.1006-3110.2021.06.001 |
| [22] |
Kobaly K, Kim CS, Mandel SJ. Contemporary management of thyroid nodules[J]. Annu Rev Med, 2022, 73: 517-528. DOI:10.1146/annurev-med-042220-015032 |
| [23] |
Miranda-Filho A, Lortet-Tieulent J, Bray F, et al. Thyroid cancer incidence trends by histology in 25 countries: a population-based study[J]. Lancet Diabetes Endocrinol, 2021, 9(4): 225-234. DOI:10.1016/S2213-8587(21)00027-9 |
| [24] |
亚明宏. 2012年中国版《甲状腺结节和分化型甲状腺癌诊治指南》解读[J]. 临床耳鼻咽喉头颈外科杂志, 2013, 27(16): 917-920. DOI:10.13201/j.issn.1001-1781.2013.16.004 Ya MH. Interpretation of the management guidelines for patients with thyroidnodules and differentiated thyroid cancer (2012 Chinese edition)[J]. J Clin Otorhinolaryngol Head Neck Surg, 2013, 27(16): 917-920. DOI:10.13201/j.issn.1001-1781.2013.16.004 |
| [25] |
田文, 罗晋. 中国与美国甲状腺结节与分化型甲状腺癌诊治指南比较[J]. 中国实用外科杂志, 2013, 33(6): 475-479. Tian W, Luo J. Comparison of thyroid nodules and differentiated thyroid cancer guidelines from American and Chinese[J]. Chin J Pract Surg, 2013, 33(6): 475-479. |
| [26] |
Wu JY, Zhao XY, Sun JZ, et al. The epidemic of thyroid cancer in China: Current trends and future prediction[J]. Front Oncol, 2022, 12: 932729. DOI:10.3389/fonc.2022.932729 |