文章信息
- 赵倩, 高文静, 余灿清, 吕筠, 逄增昌, 丛黎明, 曹卫华, 李立明.
- Zhao Qian, Gao Wenjing, Yu Canqing, Lyu Jun, Pang Zengchang, Cong Liming, Cao Weihua, Li Liming.
- 出生队列效应对体质指数遗传度的影响
- Association between birth cohort and the heritability of body mass index
- 中华流行病学杂志, 2017, 38(8): 1043-1049
- Chinese journal of Epidemiology, 2017, 38(8): 1043-1049
- http://dx.doi.org/10.3760/cma.j.issn.0254-6450.2017.08.009
-
文章历史
收稿日期: 2017-01-06
2. 266033 青岛市疾病预防控制中心;
3. 310051 杭州, 浙江省疾病预防控制中心
2. Qingdao Municipal Center for Disease Control and Prevention, Qingdao 266033, China;
3. Zhejiang Provincial Center for Disease Control and Prevention, Hangzhou 310051, China
1980-2014年全球肥胖率增加了将近一倍[1]。中国的超重率和肥胖率虽然低于全球水平,但依旧不容乐观。2014年中国成年人(≥18岁)超重率为35.4%,肥胖率为7.3%,相比2010年有大幅度增加,2010年超重率为30.1%,肥胖率为5.4%[1]。BMI因易于测量且与肥胖相关结局如心血管疾病关联较好[2-3],常作为肥胖的评价指标。
双生子研究、家系研究已发现遗传因素是肥胖的一个重要决定因素。既往研究提示BMI的遗传度在不同时期有所不同。首先,由于各个年龄生理状态不同,BMI的遗传度存在一定的年龄趋势,国外研究发现BMI的遗传度有随年龄上升的趋势[4-5]。第二,不同出生队列由于社会、经济、生活方式的变迁也会影响BMI的遗传度,随着科技高度发展,人们倾向于少体力活动[6]、高含糖饮料摄入[7]的生活方式,Wang等[8]发现体力活动对BMI的遗传度有效应修饰作用,体力活动少的人BMI的遗传度较高。
目前较少研究关注不同出生队列BMI遗传度的变化情况,不过一部分研究探讨了队列效应对吸烟、生育行为等行为因素遗传度的效应修饰作用[9-10]。我国1959-1961年是一个特殊的时期[11],曾有数百万人由于营养不良而死亡;而1980年后由于改革开放,中国城市化进程加快,人们的生活方式发生巨大改变[12-13],这些社会变迁可能会影响肥胖相关表型的遗传度。本研究基于中国双生子登记系统(the Chinese National Twin Registry,CNTR),探索不同出生队列BMI的遗传度变化情况。
对象与方法1.研究对象:本研究基于CNTR,所采用的数据来自18岁及以上基本登记(包括青岛和丽水),纳入两次调查的数据:基线数据于2001-2002年收集,随访数据来源于2011-2012年全国范围的登记数据。双生子的卵型鉴定采用基线时的卵型信息,基线时使用基因测序法进行鉴定,该方法卵型鉴定的可靠性为99.99%以上[14]。
2.研究方法:基线调查由经过培训的专门人员对调查对象的身高、体重进行测量。身高测量使用标准身高计,精确到1 cm;体重测量使用标准体重计,精确到0.1 kg。第二次随访时,由研究对象自报身高、体重来获得这些指标的相关信息,身高精确到1 cm,体重精确到1 kg。为了验证自报身高和体重的准确性,本项目组于2013年对部分自愿参与的双生子由经过培训的工作人员对其身高和体重进行测量,方法同基线调查。计算自报和测量身高、体重的相关系数:身高(809人)为0.944(0.936~0.951),体重(795人)为0.947(0.940~0.954)。BMI(kg/m2)通过体重(kg)除以身高(m)的平方获得。
3.统计学分析:
(1)描述性分析:使用SPSS 20.0对研究对象的基本情况进行描述,并根据均值t检验确定男女两性间差异是否具有统计学意义。分别计算每个表型同卵双生子(monozygotic twins,MZ)和异卵双生子(dizygotic twins,DZ)的组内相关系数(intra-class correlation coefficients,ICC)。
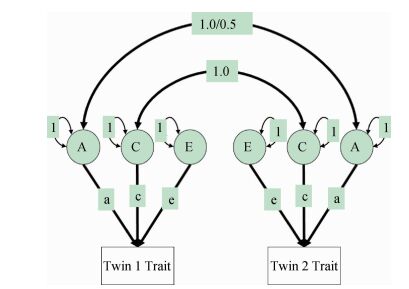
(2)遗传度计算:使用R3.2.5拟合结构方程模型计算遗传度。该模型中将总的表型变异分解为加性遗传变异(additive genetic variance,A)、非加性遗传变异(non-additive genetic variance,D)、共享环境变异(common environment variance,C)和特殊环境变异(special environment variance,E)。由于本研究数据资料未纳入分开抚养的双生子,不能区分C和D,故需要在ACE和ADE模型中进行选择,如果rMZ<2rDZ,拟合ACE模型,否则拟合ADE模型。图 1展示了结构方程模型的拟合思路,以ACE模型为例,ADE亦同。本研究中遗传度的定义为广义遗传度,即遗传因素所能解释的表型变异占总表型变异的比例[15],在ACE中,h2=a2/(a2+c2+e2);在ADE模型中,H2=(a2+d2)/(a2+d2+e2)。AE、CE和E为饱和模型ACE的嵌套模型,同理,AE、DE和E为饱和模型ADE的嵌套模型。
|
| 注:A:加性遗传效应;C:共享环境效应;E:特殊环境效应;a、c和e为通径系数 图 1 结构方程模型拟合 |
模型采用最大似然法进行参数估计,全模型ACE或ADE与嵌套模型AE、CE或DE、E模型分别进行比较,根据AIC(Akaike’s information criterion)进行选择,AIC越小,模型拟合优度与俭省度越好。如果rMZ>rDZ,提示存在遗传因素的影响,则如果AE和CE模型与全模型相比差异无统计学意义(P>0.05),选择拟合AE模型。
(3)出生队列效应:考虑1959-1961年我国经历的特殊时期及各亚组样本量均衡,将研究对象按照出生年份分为4个组:1958年及以前、1959-1961年、1962-1970年和1971年及以后。然后在每个亚组拟合结构方程进行遗传度计算。考虑BMI存在地区和性别差异,因此调整这两者进行ACE(或ADE)及其嵌套模型的拟合。
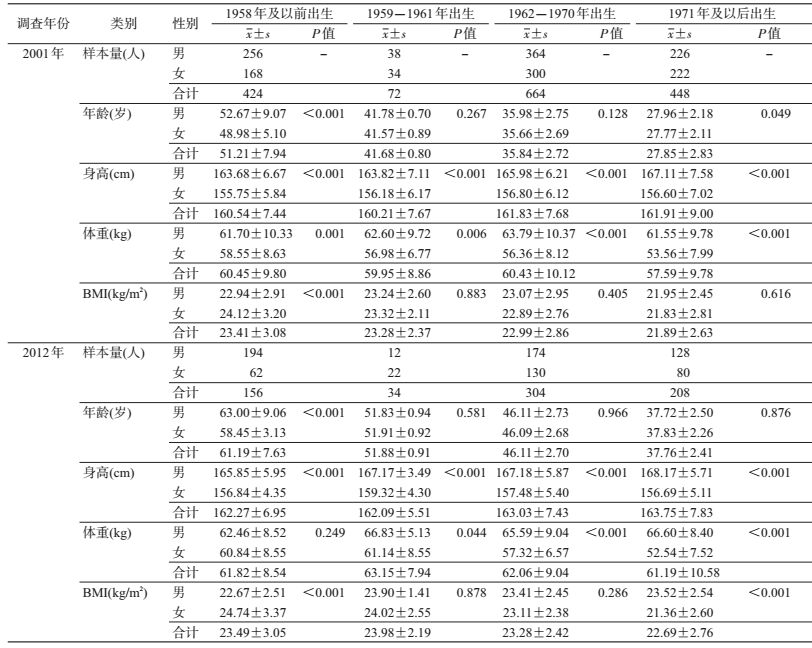
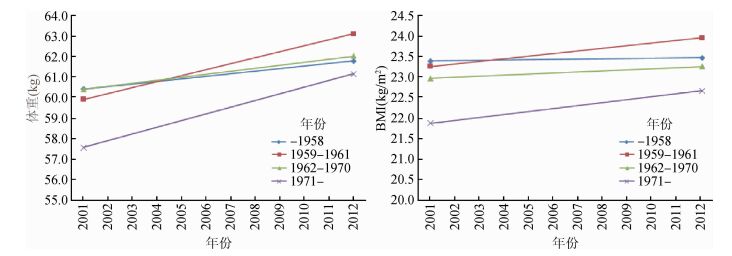
结果2001年(基线)时,共纳入804对同性别双生子,其中604对(76.4%)同卵双生子,442对(55.0%)男性双生子,394对(49.0%)来自青岛。2012年随访时纳入351对同性别双生子,其中265对(75.5%)同卵双生子,204对(58.1%)男性双生子,144对(41.0%)来自青岛。表 1展示不同出生队列身高、体重和BMI在3个时点的基本特征,每个出生队列中,2012年时的体重、BMI高于2001年。出生于1971年及以后的双生子,其体重在每个时点均低于其余出生队列(图 2);对于BMI,出生队列越晚,在每个时点的BMI越低,而出生于1959-1961年双生子在2012年时BMI高于其余出生队列(图 2)。其中,出生于1958年及以前的双生子在2001年和2012年时,男性的BMI略低于女性(P<0.05);出生于1971年及以后的双生子在2001年时,男性和女性的BMI差异无统计学意义(P=0.62),而到了2012年,男性的BMI高于女性(P<0.05)。
|
| 图 2 不同出生队列体重和BMI均数的时间趋势 |
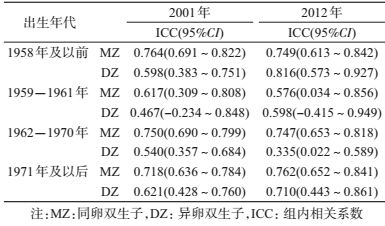
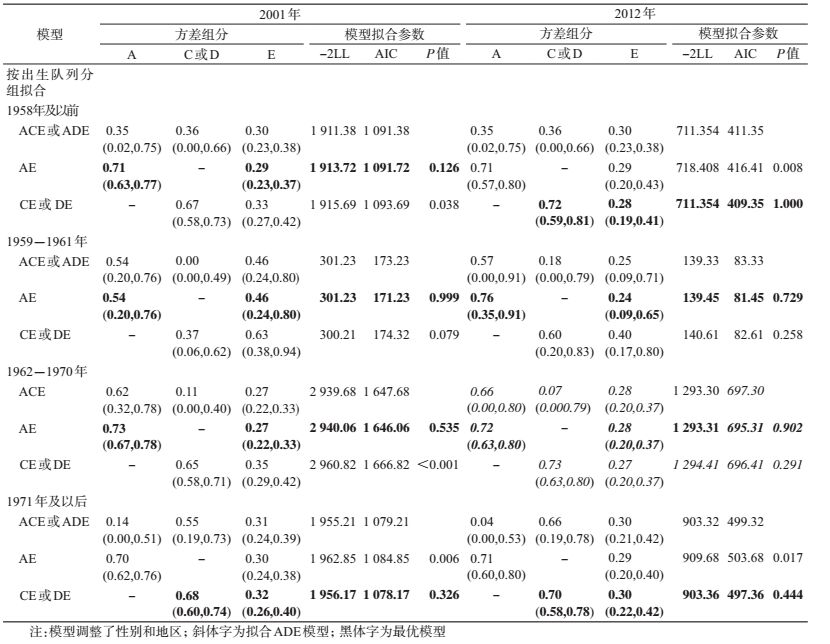
表 2展示了同卵和异卵双生子的ICC。对于BMI,大部分出生队列同卵双生子相关性高于异卵双生子,提示存在遗传效应对肥胖相关表型的影响。出生于1958年及以前和1959-1961年的双生子,同卵双生子的相关系数在2012年时与异卵双生子较为接近,提示存在共享环境效应对BMI的影响[16]。如果rMZ<2rDZ,拟合ACE模型,反之拟合ADE模型。BMI在不同出生队列模型拟合情况及最优模型见表 3,大部分时点拟合的最优模型为AE,为了增加各亚组间遗传度的可比性,最优模型为CE模型的时点亦拟合AE模型进行遗传度计算。
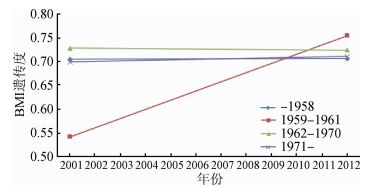
为探索遗传度的时间趋势,按出生队列分层描述其变化。遗传因素能解释BMI的表型变异为54%~82%。图 3展示了不同出生队列BMI遗传度的变化趋势。1959-1961年出生的双生子,其遗传度随年龄上升,其余出生队列未见明显年龄趋势。
|
| 注:MZ:同卵双生子,DZ:异卵双生子,ICC:组内相关系数 图 3 不同出生队列BMI遗传度的时间趋势 |
肥胖率和超重率逐年升高。较年长的一代成长在没有电视、汽车很少的年代[7],较年轻的一代出生于科技高度发展的时期,伴随着食物种类增多、能量消耗减少[7, 12],这样的环境变迁必会引起肥胖发生存在长期趋势。因此探索不同年代出生的人其肥胖的影响因素具有重要意义。本研究是国内第一个探索不同出生队列BMI遗传度的变化的双生子研究,为不同年代的人群制定预防策略提供参考依据。
中年时期体重增加较为普遍。本研究发现每个出生队列中,2012年双生子体重、BMI均高于2001年,出生于1971年及以后的双生子体重在每个时点均低于其余出生队列;出生队列越晚(除外1959-1961年),在每个时点的BMI越低。Allman-Farinelli等[7]在澳大利亚成年人发现年龄增加、现代生活方式的影响会增加肥胖患病率[17-19]。从2001-2012年,中国经济快速发展、城市化进程加速[12-13],由此引起的高能量食物的生产增加、含糖饮料消耗增加、体力活动减少等个体生活习惯的改变都会影响体重、BMI。出生于1971年及以后的个体,体重和BMI低于其余出生队列可能与其较年轻有关[7]。
BMI遗传度研究一直是双生子研究的一大热点。国外既往研究中,成年人BMI的遗传度范围为0.63~0.79[20-23],国内既往研究中BMI的遗传度范围为0.61~0.75[20, 24-25]。本研究中BMI的遗传度范围均在0.54~0.76之间,提示BMI为中高度遗传的性状。本研究发现1958年及以前、1962-1970年和1971年及以后3个出生队列BMI遗传度未见明显时间趋势。既往研究中对于成年人BMI遗传度的年龄趋势结论尚不一致。Zhou等[26]将中国双生子分为高年龄组(>37岁)和低年龄组(≤37岁)分别计算BMI遗传度,发现低年龄组遗传度高于高年龄组。一项Meta分析的结果也显示BMI的遗传度在中年时期降低[27]。Ortega-Alonso等[5]纳入217对出生于1925-1938年的女性双生子,利用结构方程模型探索BMI遗传度的时间趋势,结果发现双生子从43~71岁,BMI的遗传度从0.58增加到0.72。此外,部分研究发现BMI的遗传度未见明显时间趋势,Romeis等[28]纳入1939-1957出生的男性双生子对BMI的遗传度进行估计,发现BMI遗传度从20~50岁波动不大,稳定在0.63~0.69之间。Watson等[29]在美国双生子按年龄分组计算BMI的遗传度也有类似的发现。
此外,本研究还发现出生于三年(1959-1961年)自然灾害的双生子BMI的遗传度相对其他出生队列较为特殊,该出生队列出生的双生子BMI遗传度随年龄上升。出生队列效应反映某一代人群特殊的经历对其行为方式、健康状态等的影响。虽然机制尚不清楚,但可能由以下因素导致这种现象:第一,1959-1961年出生的个体在胎儿期处于中国三年自然灾害期间,由于母亲孕期影响不良可能导致胎儿生长受限[30],而这将会使其成年后超重、肥胖的风险更高[31-33],可能会影响BMI的遗传度。既往已有研究探索队列效应对吸烟和生育行为等行为因素遗传度的影响[9-10, 34],这些研究提出由于社会规范对某行为的约束力改变(鼓励或限制),使得该行为的发生率改变,从而影响其遗传度。第二,可能存在基因交互作用,胎儿时期暴露于营养不良的宫内环境可能会增加成年时期对不健康的生活方式易感性[35],不健康的生活方式会增加肥胖的遗传易感性[36],既往研究提示体力活动[8]、蛋白质摄入[37]、饮酒[38]等对BMI的遗传度有效应修饰作用。
本研究存在局限性。第一,限于研究对象的样本量,本研究无法同时按照出生年代和性别进行分组,探索不同出生队列不同性别BMI遗传度的变化情况;有研究提出,BMI的遗传度存在性别差异[39-40],后续研究可进一步探究出生队列效应对BMI遗传度影响的性别差异。再者,本研究中出生于1958-1961年的双生子样本量相对其余出生队列较少,2001年时,其遗传度低于其余出生队列,但可信区间较宽;但结合2001年和2012年的数据,出生于1958-1961年的双生子BMI的遗传度估计点值却呈现明显的时间趋势。第三,部分时点最优拟合模型为CE模型,为了方便各时点遗传度的比较拟合AE模型,这些时点可能会高估遗传度。
综上所述,本研究利用CNTR青岛和丽水两个地区的双生子,探索了不同出生队列BMI遗传度的时间趋势。结果发现2012年体重、BMI均高于2001年和2004年;出生于1971年及以后的双生子体重在每个时点均低于其余出生队列,出生队列越晚(除外1959-1961年组),在每个时点的BMI越低,可能与年龄较年轻有关。本研究还发现BMI为中高度遗传的性状;1959-1961年出生的双生子,BMI的遗传度均随年龄上升,其余出生队列遗传度较为稳定。
利益冲突: 无
| [1] | Finucane MM, Stevens GA, Cowan MJ, et al. National, regional, and global trends in body-mass index since 1980:systematic analysis of health examination surveys and epidemiological studies with 960 country-years and 9·1 million participants[J]. Lancet, 2011, 377(9765): 557–567. DOI:10.1016/S0140-6736(10)62037-5 |
| [2] | Barton M. Screening for obesity in children and adolescents:US Preventive Services Task Force recommendation statement[J]. Pediatrics, 2010, 125(2): 361–367. DOI:10.1542/peds.2009-2037 |
| [3] | Ashwell M, Gibson S. Waist-to-height ratio as an indicator of 'early health risk':simpler and more predictive than using a 'matrix' based on BMI and waist circumference[J]. BMJ Open, 2016, 6(3): e010159. DOI:10.1136/bmjopen-2015-010159 |
| [4] | Llewellyn CH, Trzaskowski M, Plomin R, et al. From modeling to measurement:developmental trends in genetic influence on adiposity in childhood[J]. Obesity, 2014, 22(7): 1756–1761. DOI:10.1002/oby.20756 |
| [5] | Ortega-Alonso A, Sipilä S, Kujala UM, et al. Genetic influences on change in BMI from middle to old age:a 29-year follow-up study of twin sisters[J]. Behav Genet, 2009, 39(2): 154–164. DOI:10.1007/s10519-008-9245-9 |
| [6] | McGee DL. Body mass index and mortality:a meta-analysis based on person-level data from twenty-six observational studies[J]. Ann Epidemiol, 2005, 15(2): 87–97. DOI:10.1016/j.annepidem.2004.05.012 |
| [7] | Allman-Farinelli MA, Chey T, Bauman AE, et al. Age, period and birth cohort effects on prevalence of overweight and obesity in Australian adults from 1990 to 2000[J]. Eur J Clin Nutr, 2008, 62(7): 898–907. DOI:10.1038/sj.ejcn.1602769 |
| [8] | Wang BQ, Gao WJ, Lv J, et al. Physical activity attenuates genetic effects on BMI:results from a study of Chinese adult twins[J]. Obesity, 2016, 24(3): 750–756. DOI:10.1002/oby.21402 |
| [9] | Domingue BW, Conley D, Fletcher J, et al. Cohort effects in the genetic influence on smoking[J]. Behav Genet, 2016, 46(1): 31–42. DOI:10.1007/s10519-015-9731-9 |
| [10] | Briley DA, Harden KP, Tucker-Drob EM. Genotype×cohort interaction on completed fertility and age at first birth[J]. Behav Genet, 2015, 45(1): 71–83. DOI:10.1007/s10519-014-9693-3 |
| [11] | Li YP, Jaddoe VW, Qi L, et al. Exposure to the Chinese famine in early life and the risk of metabolic syndrome in adulthood[J]. Diabetes Care, 2011, 34(4): 1014–1018. DOI:10.2337/dc10-2039 |
| [12] | Hou XH, Liu Y, Lu HJ, et al. Ten-year changes in the prevalence of overweight, obesity and central obesity among the Chinese adults in urban Shanghai, 1998-2007-comparison of two cross-sectional surveys[J]. BMC Public Health, 2013, 13: 1064. DOI:10.1186/1471-2458-13-1064 |
| [13] | Lao XQ, Ma WJ, Sobko T, et al. Overall obesity is leveling-off while abdominal obesity continues to rise in a Chinese population experiencing rapid economic development:analysis of serial cross-sectional health survey data 2002-2010[J]. Int J Obes, 2015, 39(2): 288–294. DOI:10.1038/ijo.2014.95 |
| [14] |
吕筠, 詹思延, 秦颖, 等.
流行病学研究中的双生子卵性鉴定[J]. 北京大学学报:医学版, 2003, 35(2): 212–214.
Lv J, Zhan SY, Qin Y, et al. Identification of zygosity in epidemiological research[J]. J Peking Univ:Health Sci, 2003, 35(2): 212–214. DOI:10.3321/j.issn.1671-167X.2003.02.029 |
| [15] | Visscher PM, Hill WG, Wray NR. Heritability in the genomics era-concepts and misconceptions[J]. Nat Rev Genet, 2008, 9(4): 255–266. DOI:10.1038/nrg2322 |
| [16] | Tenesa A, Haley CS. The heritability of human disease:estimation, uses and abuses[J]. Nat Rev Genet, 2013, 14(2): 139–149. DOI:10.1038/nrg3377 |
| [17] | Keyes KM, Utz RL, Robinson W, et al. What is a cohort effect? Comparison of three statistical methods for modeling cohort effects in obesity prevalence in the United States, 1971-2006[J]. Soc Sci Med, 2010, 70(7): 1100–1108. DOI:10.1016/j.socscimed.2009.12.018 |
| [18] | Allman-Farinelli MA, Chey T, Merom D, et al. The effects of age, birth cohort and survey period on leisure-time physical activity by Australian adults:1990-2005[J]. Br J Nutr, 2009, 101(4): 609–617. DOI:10.1017/S0007114508019879 |
| [19] | Härkönen JT, Mäkelä P. Age, period and cohort analysis of light and binge drinking in Finland, 1968-2008[J]. Alcohol Alcohol, 2011, 46(3): 349–356. DOI:10.1093/alcalc/agr025 |
| [20] | Li SX, Duan HM, Pang ZC, et al. Heritability of eleven metabolic phenotypes in Danish and Chinese twins:a cross-population comparison[J]. Obesity, 2013, 21(9): 1908–1914. DOI:10.1002/oby.20217 |
| [21] | Tarnoki AD, Tarnoki DL, Bogl LH, et al. Association of body mass index with arterial stiffness and blood pressure components:a twin study[J]. Atherosclerosis, 2013, 229(2): 388–395. DOI:10.1016/j.atherosclerosis.2013.05.001 |
| [22] | Song Y, Lee K, Sung J, et al. Genetic and environmental relationships between Framingham Risk Score and adiposity measures in Koreans:the Healthy Twin study[J]. Nutr Metab Cardiovasc Dis, 2012, 22(6): 503–509. DOI:10.1016/j.numecd.2010.09.004 |
| [23] | Carlsson S, Ahlbom A, Lichtenstein P, et al. Shared genetic influence of BMI, physical activity and type 2 diabetes:a twin study[J]. Diabetologia, 2013, 56(5): 1031–1035. DOI:10.1007/s00125-013-2859-3 |
| [24] | Wu T, Snieder H, Li LM, et al. Genetic and environmental influences on blood pressure and body mass index in Han Chinese:a twin study[J]. Hypertens Res, 2011, 34(2): 173–179. DOI:10.1038/hr.2010.194 |
| [25] | Liu R, Liu X, Arguelles LM, et al. A population-based twin study on sleep duration and body composition[J]. Obesity, 2012, 20(1): 192–199. DOI:10.1038/oby.2011.274 |
| [26] | Zhou B, Gao WJ, Lv J, et al. Genetic and environmental influences on obesity-related phenotypes in Chinese twins reared apart and together[J]. Behav Genet, 2015, 45(4): 427–437. DOI:10.1007/s10519-015-9711-0 |
| [27] | Nan C, Guo BL, Warner C, et al. Heritability of body mass index in pre-adolescence, young adulthood and late adulthood[J]. Eur J Epidemiol, 2012, 27(4): 247–253. DOI:10.1007/s10654-012-9678-6 |
| [28] | Romeis JC, Grant JD, Knopik VS, et al. The genetics of middle-age spread in middle-class males[J]. Twin Res, 2004, 7(6): 596–602. DOI:10.1375/1369052042663896 |
| [29] | Watson NF, Harden KP, Buchwald D, et al. Sleep duration and body mass index in twins:a gene-environment interaction[J]. Sleep, 2012, 35(5): 597–603. DOI:10.5665/sleep.1810 |
| [30] | Hoet JJ, Hanson MA. Intrauterine nutrition:its importance during critical periods for cardiovascular and endocrine development[J]. J Physiol, 1999, 514(3): 617–627. DOI:10.1111/j.1469-7793.1999.617ad.x |
| [31] | Roseboom T, de Rooij S, Painter R. The Dutch famine and its long-term consequences for adult health[J]. Early Hum Dev, 2006, 82(8): 485–491. DOI:10.1016/j.earlhumdev.2006.07.001 |
| [32] | Yang Z, Zhao W, Zhang X, et al. Impact of famine during pregnancy and infancy on health in adulthood[J]. Obes Rev, 2008, 9(Suppl 1): S95–99. DOI:10.1111/j.1467-789X.2007.00447.x |
| [33] | Wang YH, Wang XL, Kong YH, et al. The Great Chinese famine leads to shorter and overweight females in Chongqing Chinese population after 50 years[J]. Obesity, 2010, 18(3): 588–592. DOI:10.1038/oby.2009.296 |
| [34] | Treur JL, Vink JM, Boomsma DI, et al. Spousal resemblance for smoking:underlying mechanisms and effects of cohort and age[J]. Drug Alcohol Depend, 2015, 153: 221–228. DOI:10.1016/j.drugalcdep.2015.05.018 |
| [35] | Li YP, Ley SH, Tobias DK, et al. Birth weight and later life adherence to unhealthy lifestyles in predicting type 2 diabetes:prospective cohort study[J]. BMJ, 2015, 351: h3672. DOI:10.1136/bmj.h3672 |
| [36] | Temelkova-Kurktschiev T, Stefanov T. Lifestyle and genetics in obesity and type 2 diabetes[J]. Exp Clin Endocrinol Diabetes, 2012, 120(1): 1–6. DOI:10.1055/s-0031-1285832 |
| [37] | Silventoinen K, Hasselbalch AL, Lallukka T, et al. Modification effects of physical activity and protein intake on heritability of body size and composition[J]. Am J Clin Nutr, 2009, 90(4): 1096–1103. DOI:10.3945/ajcn.2009.27689 |
| [38] | Liao CX, Gao WJ, Cao WH, et al. The association of cigarette smoking and alcohol drinking with body mass index:a cross-sectional, population-based study among Chinese adult male twins[J]. BMC Public Health, 2016, 16: 311. DOI:10.1186/s12889-016-2967-3 |
| [39] | Cornes BK, Zhu G, Martin NG. Sex differences in genetic variation in weight:a longitudinal study of body mass index in adolescent twins[J]. Behav Genet, 2007, 37(5): 648–660. DOI:10.1007/s10519-007-9165-0 |
| [40] | Schousboe K, Willemsen G, Kyvik KO, et al. Sex differences in heritability of BMI:a comparative study of results from twin studies in eight countries[J]. Twin Res, 2003, 6(5): 409–421. DOI:10.1375/136905203770326411 |
 2017, Vol. 38


