 2024, Vol. 35


b Institute for Future Sciences, University of South China, Changsha 410000, China;
c Hunan Key Laboratory of Biomedical Nanomaterials and Devices, Hunan University of Technology, Zhuzhou 412007, China;
d College of Packing and Materials Engineering, Hunan University of Technology, Zhuzhou 412007, China;
e Department of Food Science and Nutrition, College of Sciences, Taif University, P.O. Box 11099, Taif 21944, Saudi Arabia
Heavy metal pollution is caused mainly by the leaching of metals from mining, smelting, casting and other metal-based industrial activities [1,2]. Mercury ions (Hg2+) is one of the most toxic heavy metal ions known to human, causing not only environmental pollution but also migrates into food and drinking water, posing a serious threat to public health [3]. Therefore, the U.S. Environmental Protection Agency (EPA) has set a maximum permissible Hg2+ limit of 2 ppb in drinking water [4]. Thus, the development of rapid and effective techniques for detection of trace Hg2+ concentration is urgently required.
In the recent literature, the detection of Hg2+ has been attracting significant attention, and various methods have been proposed for its detection, including colorimetric method [5], fluorescence method [6], electrochemical sensors [7]. Colorimetric and fluorescence methods suffer from low sensitivity and do not meet detection requirements. Electrochemical sensors for Hg2+ detection have advantages such as simplicity, portability, low cost, rapid response and high sensitivity, which have become the trend for Hg2+ detection strategies [8–11]. However, most of them have poor selectivity and suboptimal sensitivity, especially in the presence of analogues. Therefore, signal amplification, sensitivity and specificity are the key factors for improving the performance of electrochemical sensors in the construction of electrochemical sensors.
Black phosphorus (BP) has attracted a lot of attention from researchers since it was exfoliated from bulk black phosphorus (Bulk-BP) in 2014 [12–14]. BP with pleated honeycomb structure and weak van der Waals forces between the layers have advantages such as wide tunable band gap, high anisotropy, high carrier mobility, large specific surface area, excellent electrical properties and high biocompatibility, and have been applied in the construction of biosensors [15,16]. However, BP is unstable to oxygen and water under environmental conditions and are also easily degraded, which limits their application to some extent. In recent years, the long-term hydroxide stability of BP under environmental conditions has become a critical issue to be addressed. So far, various strategies such as capping protection, covalent aromatic diazo functionalization [17], heteroatom doping, ligand surface coordination, and hybridization with other functional materials [18,19] have been used to achieve environmental protection of BP [20–22]. Researchers have shown that, graphene can be used not only as an effective cap layer to protect BP from its structural and chemical degradation while still maintaining its primary electronic properties, but also as an active layer to modulate the carrier dynamics and optical properties of BP [23,24]. Recent studies by high-energy mechanical milling of BP and graphite have shown that, stable P-C bonds may be formed between them [25].
Porous graphene (PG) has received much attention as a unique carbon nanomaterial that retains the excellent properties of graphene [25–31] with unique porous structure and structural stability, as well as larger specific surface area and pore volume than pristine graphene and is very favorable for electrochemical applications in supercapacitors and sensors, because of its low fabrication cost and mild reaction conditions through hydrothermal preparation [32–34].
In recent years, gold nanoparticles (AuNPs) has been widely used in various fields due to its unique properties, including chemical stability, good electronic properties, remarkable catalytic activity, and excellent biocompatibility [35,36]. For these reasons, nanocomposites modified with AuNPs have become ideal substrates for immobilized biomolecules, such as aptamers, and are widely used for biosensing [37,38].
Aptamer (Apt) [39,40] is a small fragment of DNA or RNA that specifically recognizes the corresponding ligand with a wide range of targets, such as ions [41], small molecules [42], peptides, proteins, cells [43] and tissues [44], and exhibits strong binding affinity for the target.
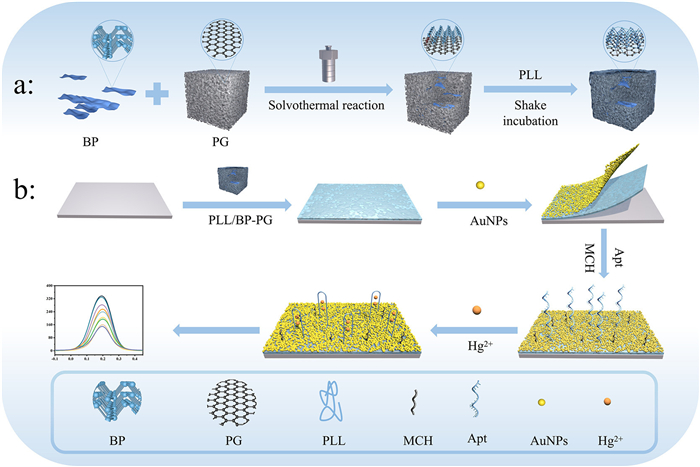
Inspired by this, we proposed a new strategy to develop an aptamer-based electrochemical sensor for detection of Hg2+ by modifying AuNPs on the surface of glassy carbon electrodes (GCE) modified with a polylysine (PLL)-coated black phosphorus-porous graphene (BP-PG) nanocomposite (PLL/BP-PG). BP-PG was synthesized by the solvothermal method. The presence of C—O and C=O bonds in the PG increased the structural disorder and lowered the energy barrier of the chemical reaction, which promoted the formation of P-C bonds, and P-O-C making the electrochemical properties of PG and BP synergistic and improving the stability and electrical conductivity of BP materials. BP was then combined with PG reaction, to effectively inhibit accumulation of PG nanosheets, and protect BP to reduce its oxidation. PLL [45,46] is a cationic biopolymer with good biocompatibility and water solubility. PLL/BP-PG is obtained by incubating the BP-PG with PLL solution to enhance the water solubility of the composites and stably dispersity in aqueous solution. PLL can be attached to the BP-PG surface through hydrophobic interaction of its butyl chain with the BP surface, and the electrostatic interaction of the protonated amino group on PLL with negative charge on the deprotonated PxOy group remaining on the BP-PG. The experimental results showed that, the Apt/AuNPs/PLL/BP-PG/GCE sensor achieved ultra-sensitive detection of Hg2+ at the nanomolar level, with very low detection limits, high sensitivity, good selectivity, reproducibility and stability. We evaluated the applicability of the sensor for detection of Hg2+ in real samples. Our proposed strategy can be extended to other nanomaterials, and is expected to provide an approach in the design of electrochemical sensors or biosensors for the detection of various targets. The chemicals and materials are clearly described in Supporting information (S1 part).
The PLL/BP-PG preparation process is shown in Scheme 1a. BP-PG was synthesized by the solvothermal method, where PG was dispersed in N-methylpyrrolidone (NMP) solution (CBP = 3.69 mg/mL) and mixed well with BP solution (CPG = 1.2 mg/mL) by mass ratio. The preparation of BP and PG is clearly described in S2 part (Supporting information). Oxygen in the reaction system was removed, sonicated for 1 h, and subsequently transferred to the reactor for 6 h at 160 ℃ to obtain BP-PG dispersion and stored at 4 ℃.

|
Download:
|
| Scheme 1. (a) Preparation of polylysine/black phosphorus-porous graphene composite, (b) flow chart of electrochemical aptamer sensor for Hg2+ detection and its detection principle. | |
The 300 µL of BP-PG dispersion was centrifuged at 11,000 rpm for 20 min to remove the NMP solvent and washed twice with anhydrous ethanol and ultrapure water, respectively. Then 300 µL of aqueous sodium carboxymethyl cellulose (CMC) solution was added, shaken and mixed, followed then by addition of 200 µL of 2 mg/mL of aqueous PLL solution, which was shaken for 1 h at room temperature, followed by incubation at 4 ℃ for 12 h, so that the PLL and BP-PG solution was fully combined to prepare the PLL/BP-PG composite, which was stored at low temperature and protected from light.
Pretreatment of the glassy carbon electrode: The GCE was ground and polished with 0.03 µm alumina powder, followed by a brief sonic treatment in ultrapure water and natural drying in air.
Modification of glassy carbon electrode: A simple drop coating technique was used to modify the glassy carbon electrode in the experiment, and specific steps were as follows: first, 5 µL PLL/BP-PG was added dropwise on the treated GCE surface and dried at room temperature with argon gas. 3 µL of AuNPs were then applied dropwise on its surface and dried at room temperature in argon atmosphere after the PLL/BP-PG was completely dried, and the AuNPs were bonded to the PLL by coulombic forces. 3 µL of 5 nmol/L aptamer activated by TCEP solution was then applied dropwise on the electrode surface and incubated at room temperature with humidity, and after the thiolated aptamer was bound to the electrode surface with Au-S bond, the excess liquid on the electrode surface was rinsed off with phosphate buffer saline (PBS) to obtain the mercury ion electrochemical aptamer sensor (Apt/AuNPs/PLL/BP-PG/GCE), and finally the prepared sensors were used for electrochemical detection.
We characterized the structural morphology of the prepared PG, BP, BP-PG and PLL-BP-PG by scanning electron microscope (SEM) and energy dispersive X-ray spectrometer (EDS). Figs. S2a and d (Supporting information) shows the morphology of the few-layered BP obtained by liquid ultrasonic exfoliation of bulk black phosphorus crystals, from which it can be seen that, our prepared BP showed monolayers and few-layered flakes, in which the lateral size of BP can reach several hundred nm, proving that, we successfully prepared black phosphorus nanosheets with excellent properties. Figs. S2b and e (Supporting information) shows the SEM images of porous graphene. As shown in the figure, the surface of PG was inhomogeneous and irregular compared with smooth surface structure of graphene, and the pores within the PG surface were of different sizes. This indicates that, KOH has effectively etched graphene to form a large number of pores, and these pores can accelerate ion diffusion and transfer to promote electrochemical kinetics and can be applied as an effective substrate material for sensor construction due to its large specific surface area. Figs. S2c and f (Supporting information) shows the SEM images of BP-PG, from which we can see that PG was successfully wrapped and covered on the surface of BP nanosheets, and BP nanosheets were in close contact with PG flakes to form BP-PG composites.
The EDS images of BP-PG (Fig. S2g in Supporting information) demonstrate that, the BP nanosheets were uniformly distributed throughout the PG framework, indicating that, the reaction between BP and PG generated a P-C bond to form a stable complex structure, and the combination of the two effectively prevented the oxidative degradation of BP in the environment, while the presence of BP also well controlled the agglomerative stacking of PG, so that the two can perform better.
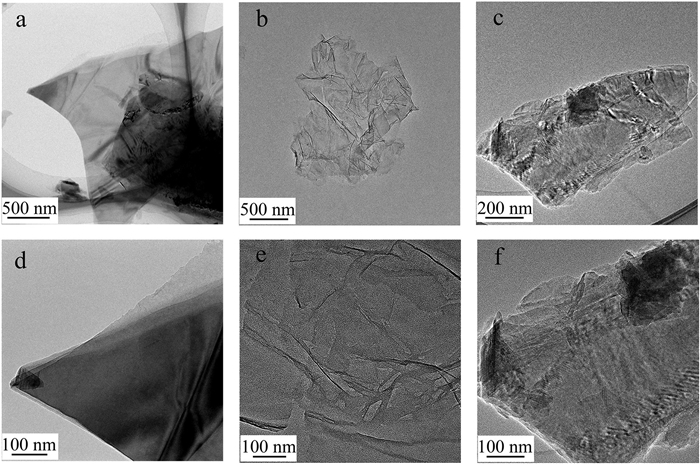
In addition to the above characterization, transmission electron microscopy (TEM) characterization was necessary to explore the detailed interconnections between the graphene backbone and BP nanosheets. As shown in Figs. 1a and d, it can be seen from the figure that, our prepared BP presented single-layer and few-layer flakes, and the lateral dimensions of the main BP nanosheets were about hundreds of nanometers. Figs. 1b and e shows the morphology of porous graphene flakes with folded flake edges. Compared with graphene flakes, porous graphene has a large number of pore structures with pore sizes ranging from nanometers to hundreds of nanometers, so the open porous network is easily accessible to BP nanosheets. As shown in Figs. 1c and f, BP nanosheets with lateral dimensions less than 200 nm were completely wrapped by porous graphene, forming a shell structure, which indicates that, the BP nanosheets were stably embedded in porous graphene sheets through strong interactions. Outside the porous graphene sheets, few independent BP nanosheets were observed, and most BP nanosheets were tightly wrapped between the porous graphene sheets. Upon closer inspection, the BP nanosheets in the core of the shell exhibited different color shades due to different thicknesses. This trend was consistent with the SEM observations. Since the lateral dimensions of the BP nanosheets are mainly around a few hundred nanometers, most of the forms showed wrapping interactions, which led to stronger interactions. For some larger BP flakes, they filled the large pores of porous graphene and promoted the tendency to become mesoporous.

|
Download:
|
| Fig. 1. TEM images of (a) BP, (b) PG at 500 nm. TEM images of (c) BP-PG at 200 nm. TEM images of (d) BP, (e) PG and (f) BP-PG at 100 nm. | |
Fig. S3a in Supporting information shows the Raman spectra of PG, BP and BP-PG [47]. The inset shows the magnified Raman peaks for BP, which has three classical characteristic peaks in 250–550 cm−1: two out-of-plane vibration peaks, Ag1 peak for out-of-plane vibration at 362 cm−1 and Ag2 peak for out-of-plane vibration in the z-direction at 466 cm−1; and one in-plane vibration peak, B2g peak for in-plane vibration in the armchair direction at 439 cm−1. The positions of the Ag2 peaks and intensities of the Ag2/Ag1 and Ag2/B2g ratios showed preparation of a few layers of BP that maintained good structural properties and can be applied to the next experiments. The PG sample has two distinctive characteristic peaks at wave numbers 1341 and 1593 cm−1, which are attributed to the D and G peaks, respectively. Usually, the G peak is a characteristic peak for sp2 hybridized carbon, and the D peak is associated with defects inside graphene, indicating that, the crystal structure of graphite is destroyed during activation of KOH in graphene, resulting in lattice defects. In the Raman spectrograms for BP-PG composites, the characteristic peaks for BP and PG were very obvious, showing the Ag1, Ag2 and B2g modes of BP and unique G and D mode features for PG, and a small peak near 830 cm−1 corresponding to the P-C bond, which proved the successful preparation of our BP-PG composites.
X-ray diffraction (XRD) is the most widely used technique to characterize the crystalline phases of synthetic materials, and we used it (Fig. S3b in Supporting information) to investigate the composition and chemical states of BP, PG, and BP-PG [48,49]. The BP showed multiple diffraction peaks indicating the polycrystalline structure of phosphorus. The three peaks located around 16.8°, 34.2° and 55.8° corresponded to the (020), (040) and (060) facets of the orthorhombic crystalline phase of BP, respectively, this indicating that, we have successfully prepared black phosphorus nanosheets that maintained good structural properties using ultrasound. The XRD strong diffraction peak for PG at 2θ = 24.3° is consistent with plane of (002) hexagonal crystalline graphite, indicating the presence of graphitic structure in this sample. In addition, such a peak also appeared in the XRD spectrum for BP-PG, which proved presence of PG in BP-PG. However, the diagnostic peaks for BP were not obvious in the XRD patterns for BP-PG composites, which may be related to oxidation of BP accompanying the individual reaction processes and destructive reaction processes caused by the formation of P-C, P-O-C bonds and PxOy.
The electronic structure and surface composition information of BP, BP-PG, and PLL/BP-PG were investigated using X-ray photoelectron spectroscopy (XPS) [47,49]. Fig. S3c (Supporting information) shows the XPS full-scan profiles of BP, BP-PG, and PLL/BP-PG. The XPS full scan spectrum of BP-PG showed the presence of carbon, nitrogen, oxygen and phosphorus elements. The presence of a large number of KOH activation-induced defects in the PG structure under solvothermal reaction conditions favors the coupling of PG with BP. The XPS patterns for PLL/BP-PG showed a significant increase in the elemental nitrogen content compared to BP-PG, which was attributed to the functionalized coating of BP-PG by PLL, which further reduced the oxidative decomposition of BP-PG composites. It was shown that, the PLL with free NH2 groups provided a good, functionalized coating of BP-PG.
Fig. S3d (Supporting information) shows the high-resolution XPS pattern for C 1s of BP-PG, where the peaks at 284.7, 286.1, and 287.1 eV were related to the sp2 carbon, C—O bond, and C=O bond of PG, respectively. The presence of C—O and C=O bonds in the PG increases the structural disorder and lowers the energy barrier for chemical reactions, which facilitates the formation of P-C bonds. We observed a peak located at ~284.0 eV in the C 1s pattern of PG-BP, demonstrating that, the phosphorene and graphene are not only contact bonds, but also chemical bonds, indicating the formation of P-C bonds. The formation of robust P-C bond makes the electrochemical properties of PG and BP synergistic, which improves the stability and conductivity of BP material. And when BP is combined with PG, the presence of BP can effectively inhibit the accumulation of PG nanosheets, which makes the composite material exert more electrochemical properties.
Fig. S3e (Supporting information) shows the high-resolution XPS pattern for P 2p of BP-PG, in which two main peaks located at 130.0 and 131.0 eV, representing the P 2p3/2 and P 2p1/2 bimodal peaks, respectively, were assigned to the P-P bond. Meanwhile, a broad and weak peak at 134.72 eV indicates that, the BP nanosheets are partially oxidized during the reaction with PG, revealing the formation of most common phosphorus oxide (PxOy). In addition, we detected the P-C band at 134.1 eV and the P-O-C band at 133.1 eV in the figure, which are consistent with results from the C 1s spectrum. This further confirms the existence of covalent bonds between BP and PG, and these covalent bonds can effectively improve the electrochemical properties of the electrode materials, and this contributes significantly to the stability of BP in the electrode construction process.
Experimental conditions are important for developing the sensor, such as the dispersion solvent of BP-PG, the contents of BP and PG in the complex PLL/BP-PG, the dripping amount of PLL/BP-PG, the incubation time of aptamer on the electrode surface and the incubation time of aptamer with mercury ions. The optimization of conditions is described in detail in Supporting information (S3 part).
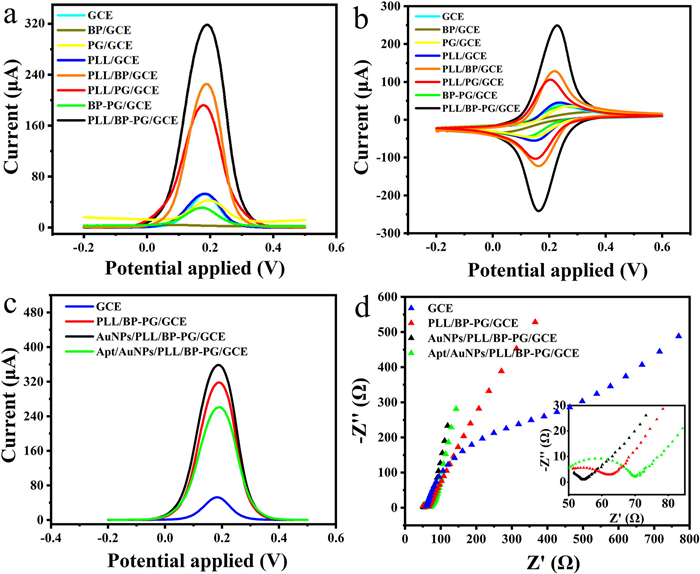
To verify the electrochemical properties of the prepared materials, we performed DPV as well as cyclic voltammetry (CV) tests on GCE, BP/GCE, PG/GCE, PLL/GCE, PLL-BP/GCE, PLL-PG/GCE, BP-PG/GCE, and PLL/BP-PG/GCE. As shown in Figs. 2a and b, the DPV curves and CV curves for GCE showed relatively small peak currents, and the current values did not increase significantly relative to those of GCE after we modified the electrode with PLL, which proved that, PLL acted as a protective dispersion for the black phosphorus nanosheets and did not have a significant enhancement effect on the electrochemical signal. The current signal was significantly reduced after modification of BP or PG on the electrode relative to the bare electrode, which was due to the fact that, BP or PG were negatively charged and repelled the ferricyanide ions in the buffer, which hindered the electron transfer on the electrode surface, resulting in low current values. In contrast, the PLL-BP and PLL-PG current value increases compared to GCE, which is because PLL coating of BP or PG can eliminate the electrostatic repulsion. After modification of BP-PG on the electrode, the electrochemical signal value was still lower than that of the bare electrode. Moreover, the current signal for PLL/BP-PG was higher than that of PLL-BP and PLL-PG. According to Randles-Sevcik formula (ip = (2.69×10⁵)n3/2AD1/2v1/2C), the effective area of modified electrode (PLL/BP-PG/GCE) is 6 times that of bare electrode, which proves that the composite of the material further greatly improves the electrochemical performance of the material, which can indicate that PLL/BP-PG composite can be used as an effective component to amplify the electrical signal.

|
Download:
|
| Fig. 2. (a) DPV plot. (b) CV plot for GCE, BP/GCE, PG/GCE, PLL/GCE, PLL/BP/GCE, PLL/PG/GCE, BP-PG/GCE, PLL/BP-PG/GCE. (c) DPV plot, (d) EIS plot for GCE, PLL/BP-PG/GCE, AuNPs/PLL/BP-PG/GCE, Apt/PLL/BP-PG/GCE. | |
To investigate the interfacial transport properties of the modified electrodes, electrochemical differential pulse voltammetry (DPV) tests as well as electrochemical impedance (EIS) tests were performed on GCE, PLL/BP-PG/GCE, AuNPs/PLL/BP-PG/GCE, and Apt/AuNPs/PLL/BP-PG/GCE. As shown in Fig. 2c, the DPV current of GCE was very small, and DPV current increased significantly after modifying the GCE with PLL/BP-PG composite, indicating that, PLL/BP-PG has good conductivity, and the DPV current increased further after modifying a layer of AuNPs on it. In the next step, we incubated Apt on the electrode surface to form Au-S bonds, which immobilized Apt on the electrode surface, and the DPV current was significantly decreased. This is due to the negative charge of Apt, which repels the ferricyanide ions in the buffer and hinders the electron transfer on the electrode surface, thus leading to the decrease of DPV current.
Fig. 2d shows the Nyquist plots of different electrodes. Modification of GCE with PLL/BP-PG/GCE resulted in a decreased Rct from 366.6 Ω to 11.0 Ω, indicating excellent conductivity of PLL/BP-PG/GCE. AuNPs/PLL/BP-PG/GCE exhibited minimal semi circularity (Rct = 4.0 Ω), indicating further improved electron transfer. Incubation of Apt on the electrode surface to form Au-S bonds immobilized the Apt on the electrode surface, resulting in a significant increase in Rct to 20.1 Ω. This is due to the negative charge of Apt, which repels ferricyanide ions in the buffer and hinders electron transfer on the electrode surface, resulting in increased impedance value. The above results prove that, our stepwise modification of the glassy carbon electrode was successful and completed the initial feasibility verification of the sensor.
The Hg2+ detection was performed as follows: the prepared sensors were incubated in PBS buffer with different concentrations of Hg2+ standard solutions for 80 min, and then rinsed with PBS buffer three times, and then transferred to the electrochemical cell for DPV measurements. The buffer was treated with argon gas before the experiment.
Scheme 1b describes the detection mechanism for proposed electrochemical aptamer sensor for Hg2+ detection. When the detection solution contained the Hg2+, the aptamer specifically recognized Hg2+ and then folds into a T-Hg2+-T mediated hairpin structure, which leads to an increase in the spatial potential resistance on the sensor surface and subsequently greatly reduces the electron transfer rate. At this point, when using electrochemical detection methods (such as the DPV method), at this time, due to the change in the state of the electrode surface, we can achieve the detection of Hg2+ by detecting the change in the electrochemical signal.
To investigate the cycling stability of PLL/BP-PG in oxygenated aqueous system, we performed 50 consecutive CV scans in aqueous PBS solution containing 5 mmol/L K3[Fe(CN)6], 0.1 mol/L KCl. Apparently, the CV of PLL/BP-PG did not change much during 50 cycles (Fig. S6a in Supporting information), demonstrating the good cycling stability of PLL/BP-PG.
To investigate the rate-limiting step (diffusion or adsorption), cyclic voltammetry scans were performed on the electrode at different scan rates from 20 mV/s to 270 mV/s, and the two peak shapes of the CV peaks in Fig. S6b (Supporting information) remained almost constant. During the scan, the anode and cathode peak currents increase linearly with the square root of the scan rate (v1/2) (Fig. S6c in Supporting information), which is typical of diffusion-controlled processes.
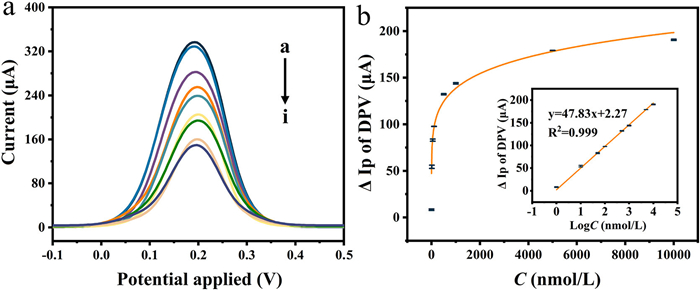
The sensitivity of the Hg2+ aptamer sensor was investigated by DPV (potential range: −0.2–0.5 V) to validate the proposed sensor system. We can see the current response of the constructed sensor to different concentrations of Hg2+ in Fig. 3a. As the Hg2+ concentration was increased, the peak DPV current gradually decreased which is due to the aptamer binding to Hg2+.

|
Download:
|
| Fig. 3. (a) DPV curves of Apt/AuNPs/PLL/BP-PG/GCE after incubation with different concentrations of Hg2+ (a–i: 0, 1, 10, 50, 100, 500, 1000, 5000 and 10,000 nmol/L). (b) Linear plot of peak current difference of DPV versus logarithm of Hg2+ concentration in the range of 1–10,000 nmol/L. | |
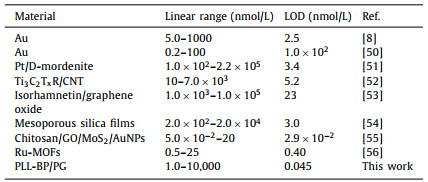
The aptamer captured the mercury ions in the detection solution, reacted with bind Hg2+, and then folds into a T-Hg2+-T mediated hairpin-like structure, which led to a further increase in the spatial potential resistance on the sensor surface, impeding the transfer of ions on the electrode surface, and then greatly reducing the electron transfer rate. The more was Hg2+ in a certain concentration range, the more was the aptamer folds, resulting in the decreased peak DPV current with increased Hg2+ concentration. We plotted the logarithm of Hg2+ concentration and its corresponding DPV peak current difference as a concentration-current relationship, and the results shown in Fig. 3b show that, the DPV peak current difference (ΔIp) of our constructed sensor was linearly correlated with logarithm of Hg2+ concentration (logC) in the range of 1–10,000 nmol/L with linear equation ΔIp = 47.83logC + 2.27, with a linear correlation coefficient R2 of 0.999 and limit of detection (LOD) of 0.045 nmol/L. The above results indicate that, the sensor has good monitorability for Hg2+. The simple structure and easy operation of this electrochemical aptamer sensor provide a simple and sensitive method for the detection of Hg2+, which is expected to be used for the detection of trace Hg2+ in real samples. As shown in Table 1, the analytical performance of Apt/AuNPs/PLL/BP-PG/GCE has a lower detection limit and wider detection range compared with the previously reported sensors.
|
|
Table 1 Comparison of analytical properties of different assays toward Hg2+. |
To investigate the stability of the Apt/AuNPs/PLL/BP-PG/GCE, the electrochemical aptamer sensor was stored at 4 ℃. As shown in Fig. S7a (Supporting information), the DPV was characterized after one week and the peak DPV current did not change significantly. After 15 d, the corresponding peak DPV current value was about 95.7% of the initial value, indicating that the sensor has good stability.
To investigate the reproducibility of Apt/AuNPs/PLL/BP-PG/GCE, six Apt/AuNPs/PLL/BP-PG/GCE sensors were prepared simultaneously under optimal conditions, and after incubation with the target ions, a three-electrode system was constructed with the sensor, and the six electrodes were recorded in aqueous solutions containing 5 mmol/L K3[Fe(CN)6], 0.1 mol/L KCl The DPV current response in aqueous PBS solution containing 5 mmol/L K3[Fe(CN)6], 0.1 mol/L KCl. The electrochemical response signal values of the six electrodes did not differ significantly (Fig. S7b in Supporting information), indicating that the sensor has good reproducibility.
To evaluate the specificity of Apt/AuNPs/PLL/BP-PG/GCE for the detection of Hg2+, we compared the peak current changes of DPV at a concentration of 100 nmol/L for solutions containing 50 nmol/L Hg2+ or other metal ions (Cu2+, Zn2+, Pb2+, Co2+, Mn2+, Ba2+, Ca2+). A PBS solution without any of the above metal ions was used as a blank. As shown in Figs. S7c and d (Supporting information), the peak current change value of DPV in the experimental group without Hg2+ was smaller than that of the mixture containing Hg2+ and Hg2+, which indicates that the aptamer sensor has a larger electrochemical response to the experimental group containing Hg2+, indicating that the sensor has specific recognition ability and high specificity for Hg2+.
Apt/AuNPs/PLL/BP-PG/GCE combined with DPV technique was used to quantify the Hg2+ concentration in the actual samples. Water samples and soil samples collected from the Xiangjiang River, and vegetables purchased from local supermarkets in Zhuzhou were used as actual samples for experimental tests in this laboratory. The actual samples were digested, and the solutions obtained were diluted proportionally with PBS buffer. The standard addition method was used to dilute the purchased Hg2+ standard solutions to different concentrations into the samples to simulate contaminated water, soil and foodstuffs respectively, and then the recoveries were determined. The results for food samples and environmental samples are listed in Table S1 (Supporting information) with recoveries in the range of 93.68%–102.43%. It indicates that the sensor we built has good detection accuracy for monitoring of Hg2+ in the actual samples. The results indicate that our constructed electrochemical aptamer sensor can be used for the analysis of real samples.
In this study, an ultra-sensitive and label-free electrochemical sensor was developed for the detection of Hg2+. This method combines the advantages of modified materials and aptamers and improves the electrochemical behavior of electrodes in analyte detection. The results show that our sensor has wide linear response range (1.0–10,000 nmol/L), low detection limit (0.045 nmol/L), good selectivity, good stability and good reproducibility, and the detection of Hg2+ is not interfered by other metals, which indicates that it has good anti-interference. In addition, we can detect other targets by using different aptamers, which has the potential prospect of promoting the detection of other targets in field monitoring.
Declaration of competing interestThe authors declare that they have no known competing financial interests or personal relationships that could have appeared to influence the work reported in this paper.
AcknowledgmentsThis work was financially supported by the NSF of China (No. 61871180), 2022 Special Project for the Construction of Innovative Provinces to Fight the COVID-19 Outbreak (No. 2022SK2115), Natural Science Foundation of Hunan Province of China (Nos. 2022JJ30230, 2021JJ30213) and the Deanship of Scientific Research, Taif University.
Supplementary materialsSupplementary material associated with this article can be found, in the online version, at doi:10.1016/j.cclet.2024.109561.
| [1] |
Z.Y. Li, Z.W. Ma, T.J. van der Kuijp, et al., Sci. Total. Environ. 468-469 (2014) 843-853. DOI:10.1016/j.scitotenv.2013.08.090 |
| [2] |
Q.Q. Yang, Z.Y. Li, X.N. Lu, et al., Sci. Total. Environ. 642 (2018) 690-700. DOI:10.1016/j.scitotenv.2018.06.068 |
| [3] |
J.L.M. do Nascimento, K.R.M. Oliveira, M.E. Crespo-Lopez, et al., Indian J. Med. Res. 128 (2008) 373-382. |
| [4] |
C.W. Liu, T.C. Tsai, M. Osawa, et al., Anal. Chim. Acta 1033 (2018) 137-147. DOI:10.1016/j.aca.2018.05.037 |
| [5] |
J.L. Chen, P.C. Yang, T. Wu, et al., Spectrochim. Acta Part A 199 (2018) 301-307. DOI:10.1016/j.saa.2018.03.077 |
| [6] |
J. Nie, T. Xu, Q. Liu, et al., J. Fluoresc. 32 (2022) 1755-1759. DOI:10.1007/s10895-022-02949-8 |
| [7] |
J. Zhou, D. Wei, C.C. Hu, et al., Mater. Express 12 (2022) 802-809. DOI:10.1166/mex.2022.2212 |
| [8] |
J.Y. Zhuang, L.B. Fu, D.P. Tang, M.D. Xu, G.N. Chen, Biosens. Bioelectron. 39 (2013) 315-319. DOI:10.1016/j.bios.2012.07.015 |
| [9] |
Y. Liu, Y. Deng, T.T. Li, et al., J. Biomed. Nanotechnol. 14 (2018) 2156-2161. DOI:10.1166/jbn.2018.2655 |
| [10] |
C.Y. Mei, D.J. Lin, C.C. Fan, et al., Biosens. Bioelectron. 80 (2016) 105-110. DOI:10.1016/j.bios.2016.01.009 |
| [11] |
H. Xie, Y.Y. Niu, Y. Deng, J. Chin. Chem. Soc. 68 (2020) 114-120. |
| [12] |
L.K. Li, Y.J. Yu, G.J. Ye, et al., Nat. Nanotechnol. 9 (2014) 372-377. DOI:10.1038/nnano.2014.35 |
| [13] |
L. Zhang, Z.J. Wang, B. Ma, et al., Chin. Chem. Lett. 33 (2022) 4640-4644. DOI:10.1016/j.cclet.2021.12.046 |
| [14] |
J. Zou, Y.L. Zou, H.T. Wang, et al., Chin. Chem. Lett. 34 (2023) 107378. DOI:10.1016/j.cclet.2022.03.101 |
| [15] |
V. Kumar, J.R. Brent, M. Shorie, et al., ACS Appl. Mater. Interfaces 8 (2016) 22860-22868. DOI:10.1021/acsami.6b06488 |
| [16] |
H. Huang, C.X. Zhang, J. Zhou Jie, et al., Biosensors 12 (2022) 775. DOI:10.3390/bios12100775 |
| [17] |
T.T. Ma, J. Zhou, D. Wei, et al., Biosensors 13 (2023) 735. DOI:10.3390/bios13070735 |
| [18] |
T.T. Ma, C.X. Zhang, J. Zhou, et al., Electrochim. Acta 471 (2023) 143343. DOI:10.1016/j.electacta.2023.143343 |
| [19] |
G. Yanalak, F. Doganay, Z. Eroglu, et al., Appl. Surf. Sci. 14975 (2021) 557. |
| [20] |
Y. Abate, D. Akinwande, S. Gamage, et al., Adv. Mater. 30 (2018) e1704749. DOI:10.1002/adma.201704749 |
| [21] |
S. Kuriakose, T. Ahmed, S. Balendhran, et al., 2D Mater. 5 (2018) 32001. DOI:10.1088/2053-1583/aab810 |
| [22] |
Z.H. Hu, T.C. Niu, R. Guo, et al., Nanoscale 10 (2018) 21575-21603. DOI:10.1039/C8NR07395C |
| [23] |
Y.Q. Cai, G. Zhang, Y.W. Zhang, J. Phys. Chem. C 119 (2015) 13929-13936. DOI:10.1021/acs.jpcc.5b02634 |
| [24] |
Y.J. Cai, S.L. Li, Y.G. Zhou, et al., J. Phys. D Appl. Phys. 53 (2020) 025107. DOI:10.1088/1361-6463/ab4eea |
| [25] |
J. Sun, G.Y. Zheng, H.W. Lee, et al., Nano Lett. 14 (2014) 4573-4580. DOI:10.1021/nl501617j |
| [26] |
Y.V. Manohara Reddy, J.H. Shin, V.N. Palakollu, et al., Adv. Colloid Interface Sci. 304 (2022) 102664. DOI:10.1016/j.cis.2022.102664 |
| [27] |
D. Ilager, N.P. Shetti, Y. Foucaud, M. Badawi, T.M. Aminabhavi, Chemosphere 292 (2022) 133450. DOI:10.1016/j.chemosphere.2021.133450 |
| [28] |
S.D. Bukkitgar, N.P. Shetti, K.R. Reddy, T.A. Saleh, T.M. Aminabhavi, FlatChem 23 (2020) 100183. DOI:10.1016/j.flatc.2020.100183 |
| [29] |
M.M. Shanbhag, N., . P. . Shetti, S., . J. . Malode, R.S. Veerapur, K.R. Reddy, FlatChem 28 (2021) 100255.
|
| [30] |
R.R. Sawkar, M.M. Shanbhag, S.M. Tuwar, K. Mondal, N.P. Shetti, Catalysts 12 (2022) 1166. DOI:10.3390/catal12101166 |
| [31] |
V.B. Patil, M.M. Shanbhag, R.R. Sawkar, S.M. Tuwar, N.P. Shetti, Mater. Chem. Phys. 296 (2023) 127238. DOI:10.1016/j.matchemphys.2022.127238 |
| [32] |
J.F. Hu, Y.Q. Li, G.W. Gao, et al., Sensors 17 (2017) 2594. DOI:10.3390/s17112594 |
| [33] |
T.T. Liang, X.G. Guo, J. Wang, et al., Mater. Lett. 254 (2019) 28-32. DOI:10.1016/j.matlet.2019.06.100 |
| [34] |
L. Luan, Chem. Sens. 39 (2019) 55-59. |
| [35] |
N. Elahi, M. Kamali, M.H. Baghersad, Talanta 184 (2018) 537-556. DOI:10.1016/j.talanta.2018.02.088 |
| [36] |
Z. Hua, T. Yu, D.H. Liu, et al., Biosens. Bioelectron. 179 (2021) 113076. DOI:10.1016/j.bios.2021.113076 |
| [37] |
Y. Liu, T.T. Li, G.J. Yang, et al., Chin. Chem. Lett. 33 (2022) 1913-1916. DOI:10.1016/j.cclet.2021.11.025 |
| [38] |
Y. Liu, Y.X. Lai, G.J. Yang, et al., J. Biomed. Nanotechnol. 13 (2017) 1253-1259. DOI:10.1166/jbn.2017.2424 |
| [39] |
L. He, R.R. Huang, P.F. Xiao, et al., Chin. Chem. Lett. 32 (2021) 1593-1602. DOI:10.1016/j.cclet.2020.12.054 |
| [40] |
Y. Liu, G.J. Yang, T.T. Li, et al., Chin. Chem. Lett. 32 (2021) 1957-1962. DOI:10.1016/j.cclet.2021.01.016 |
| [41] |
W.F. Guo, C.X. Zhang, T.T. Ma, et al., J. Nanobiotechnol. 19 (2021) 166. DOI:10.1186/s12951-021-00914-4 |
| [42] |
W.F. Guo, C.C. Hu, S. Li, et al., Anal. Chim. Acta 1241 (2023) 340780. DOI:10.1016/j.aca.2023.340780 |
| [43] |
Z.K. Guo, Y. Liu, N.Y. He, et al., Chin. Chem. Lett. 32 (2021) 40-47. DOI:10.1016/j.cclet.2020.11.061 |
| [44] |
M. Liu, L. Xi, T. Tan, et al., Chin. Chem. Lett. 32 (2021) 1726-1730. DOI:10.1016/j.cclet.2020.11.072 |
| [45] |
M.C. Zheng, M. Pan, W.C. Zhang, et al., Bioact. Mater. 6 (2021) 1878-1909. |
| [46] |
Y. Zhao, Y.H. Zhang, Z. Zhuge, et al., Anal. Chem. 90 (2018) 3149-3155. DOI:10.1021/acs.analchem.7b04395 |
| [47] |
J.Y. Cai, X.D. Gou, B.L. Sun, et al., Biosens. Bioelectron. 137 (2019) 137. |
| [48] |
C.X. Hao, B.C. Wang, F.S. Wen, et al., Nanotechnology 29 (2018) 235604. DOI:10.1088/1361-6528/aab83a |
| [49] |
J.Y. Zhang, H. Shin, W. Lu, ACS Appl. Mater. Interfaces 13 (2021) 25946-25959. DOI:10.1021/acsami.1c03583 |
| [50] |
C. Tortolini, P. Bollella, M.L. Antonelli, et al., Biosens. Bioelectron. 67 (2015) 524-531. DOI:10.1016/j.bios.2014.09.031 |
| [51] |
S. Sakthinathan, P. Tamizhdurai, A. Ramesh, et al., Microporous Mesoporous Mater. 292 (2020) 109770. DOI:10.1016/j.micromeso.2019.109770 |
| [52] |
Y.X. Xia, J.T. Li, G.B. Zhu, et al., Sens. Actuators B: Chem. 355 (2022) 131247. DOI:10.1016/j.snb.2021.131247 |
| [53] |
L. Sun, B. Gao, W. Jiang, et al., Int. J. Electrochem. Sci. 13 (2018) 4933-4945. DOI:10.20964/2018.05.77 |
| [54] |
M.Q. Zhang, Y.Q. Zou, X.Y. Zhou, et al., Front. Chem. 10 (2022) 952936. DOI:10.3389/fchem.2022.952936 |
| [55] |
R. Wang, C.Y. Xiong, Y. Xie, et al., Chin. J. Anal. Chem. 50 (2022) 100066. DOI:10.1016/j.cjac.2022.100066 |
| [56] |
C.Y. Xiong, Y.H. Xu, C. Bian, et al., Sensors 20 (2020) 6686. DOI:10.3390/s20226686 |