 2024, Vol. 35


b School of Chemistry and Life Science, Anshan Normal University, Liaoning Key Laboratory of Development and Utilization for Natural Products Active Molecules, Anshan 114007, China;
c Biomedical Analysis Center, Army Medical University, Chongqing 400038, China;
d School of Pharmacy, Weifang Medical University, Weifang 261053, China;
e College of Chemistry, Baicheng Normal University, Baicheng 137000, China
As one type of serine–related endopeptidase, chymotrypsin (CHT) is distributed in the human digestive system, whose main function is to cleave the carboxyl side of the polypeptide chain adjacent to aromatic amino acid residues [1,2]. It was reported that the mean values of chymotrypsin in human sera were 24.6 ± 8.3 µg/L in adults and 20.9 ± 8.8 µg/L in newborns. In amniotic fluid at the 18th week of pregnancy the values were in the range of 5–70 µg/L [3]. It has been verified that CHT not only has higher hydrolysis efficiency than other similar trypsin, but also gets involved in numerous physiological processes including cell division, apoptosis, and digestion of protein [4–6]. Furthermore, CHT also participates in postoperative wound healing, prevention of local edema, pneumonia, otitis media and rhinitis [7,8]. Unfortunately, abnormal level of CHT is closely associated to inflammatory arthritis, diabetes, cystic fibrosis, multiple myeloma, Alzheimer's disease, chronic pancreatitis, and especially pancreatic cancer [9–15]. Hence, real-time in vitro and in vivo monitoring CHT activity is vital to clinical diagnosis of CHT-related disorders and pertinent medication development.
Up to now, multiple techniques for detecting CHT have been explored including enzyme-linked immunosorbent assay (ELISA), inductively coupled plasma mass spectrometry (ICP-MS), Western blotting (WB) and high-performance liquid chromatography (HPLC), which usually encountered the dilemma such as incapability for in-situ imaging of CHT in vivo, necessity of expensive instruments, and tedious and complicated pretreatment process [16–20]. Recently, small-molecule fluorescent probes have been gradually applied in monitoring of CHT activity, owing to their excellent sensitivity and selectivity, real-time bioimaging ability, and non-invasiveness [21–32]. Nevertheless, the defects such as short emission wavelength, small Stokes shift, long response time and susceptibility to background fluorescence have severely hindered the accurate assessment of CHT activity in complex organisms and limited its practical application in vitro and in vivo [33–41]. Especially, peptide-based CHT-selective fluorescent probes had to face the predicament of degradation and failure in the realization of long-term bioimaging [42–44]. Therefore, there is an urgent necessity for non-peptide-based CHT-selective fluorescent probes with excellent property.
Herein, TCF-CHT, a brand-new non-peptide-based long-wavelength emission fluorescent probe for measuring CHT activity has been designed by adopting TCF-OH as the chromogenic unit and a mimetic peptide substrate 4-bromobutyryl as the recognition group, respectively. Theoretically, TCF-OH, as a non-linear optical chromophore, owns an interesting donor-π-acceptor (D-π-A) structure, which is suitable for the design of novel long-wavelength emission fluorescent probe and can effectively avoid the interference from background fluorescence [45–52]. To our satisfaction, TCF-CHT exhibited excellent selectivity and sensitivity towards CHT, accompanied by a significant "turn-on" long-wavelength emission at 670 nm and remarkable Stokes shift (140 nm). In addition, the successful application of TCF-CHT in imaging endogenous CHT in cells, zebrafish and tumor-bearing mice validated its potential in the early diagnosis of CHT-related diseases.
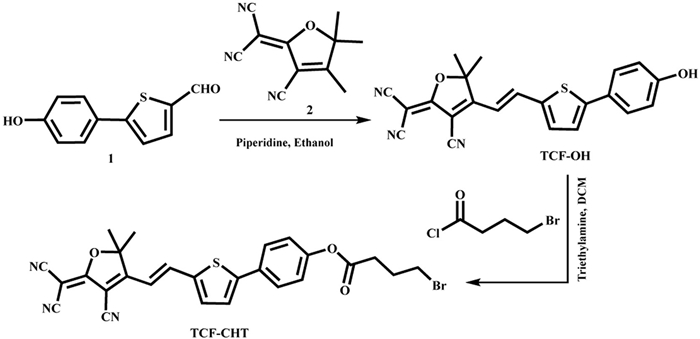
The synthetic route of TCF-CHT was depicted in Scheme 1. Compounds 1 and 2 were prepared according to previously described methods [48,53]. All compounds were evaluated through 1H NMR, 13C NMR and HR-MS (Figs. S1-S12 in Supporting information). The probe TCF-CHT was designed by attaching a mimetic peptide substrate 4-bromobutyryl as recognition group to parent fluorophore TCF-OH. The purpose of the introduction of thiophene in parent fluorophore TCF-OH is to prolong the π-conjugated system, which may lead to long-wavelength emission, larger Stokes shift, stronger cell permeability and less biological damage [54]. What is more, the acylation of hydroxyl groups in TCF-CHT may inhibit the intramolecular charge transfer (ICT) and consequently quench the fluorescence emission, which can efficiently improve the sensitivity for the detection of CHT activity.

|
Download:
|
| Scheme 1. Synthetic route of TCF-CHT. | |
UV–vis absorption and fluorescence responses of TCF-CHT before and after the addition of CHT, as well as the parent fluorophore TCF-OH, were explored in detail in PBS/DMSO solution (6:4, v/v, 10 mmol/L, pH 7.4). TCF-CHT itself showed an absorption maximum at 500 nm and weak fluorescence at 670 nm when excited at 530 nm. After the introduction of CHT, the maximal absorption peak of TCF-CHT was red-shifted to 530 nm, as well a significant fluorescence enhancement at 670 nm, which coincided with the absorption and fluorescence spectrum of TCF-OH. In the meanwhile, an eye-catching color change could be found by naked eye (Figs. 1a and b). These results gave us a hint that TCF-CHT may react with CHT to produce TCF-OH at the proper conditions.

|
Download:
|
| Fig. 1. (a) UV–vis absorption and (b) fluorescence emission spectra of TCF-OH (2 µmol/L) and TCF-CHT (2 µmol/L) before and after incubation with CHT (66.7 µg/mL). (c) Fluorescence spectra of TCF-CHT (2 µmol/L) incubated with CHT (0–100 µg/mL). (d) Changing trend of F670 nm of TCF-CHT (2 µmol/L) with the varying CHT concentrations (0–100 µg/mL). Insert of (d): linear relationship between F670 nm and CHT level (0–20 µg/mL). (e) Time-dependence of fluorescence intensity of TCF-CHT (2 µmol/L) at 670 nm in the presence of varying CHT level. (f) Lineweaver-Burke plot for the reaction between TCF-CHT and CHT (66.7 µg/mL) at 37 ℃. λex/λem = 530/670 nm and slit = 5 nm/5 nm. | |
What is more, fluorescence titration experiments exhibited that the fluorescence intensity at 670 nm enhanced about 5-fold within 30 min as the concentration of CHT was gradually elevated from 0 to 100 µg/mL (Fig. 1c). There was an excellent linear relationship between the fluorescence intensity at 670 nm and the concentration of CHT in the range of 0–20 µg/mL (Fig. 1d). The detection limit for CHT was calculated to be 8.9 ng/mL by the equation of 3σ/k (k is the slope of calibration curve and σ is the standard deviation of F670 nm of 16 blank samples), which was lower than other previously reported CHT-selective fluorescent probes (Table S1 in Supporting information).
The fluorescent response speed of TCF-CHT towards CHT with different concentration level (0, 16.7, 33.3, 50 and 66.7 µg/mL) were also examined. As shown in Fig. 1e, the fluorescent response of TCF-CHT accelerated and the fluorescence intensity increased with the enhancement of CHT level. When the CHT level was up to 66.7 µg/mL, the maximum intensity was observed at 670 nm within approximately 30 min, indicating the reaction between TCF-CHT and CHT could achieve balance in a relatively short period. Based on the Lineweaver-Burk equation, the maximum enzymatic reaction rate (Vmax) and Michaelis constant (Km) were calculated to be 0.75 µmol L−1 min−1 and 10.45 µmol/L, underscoring that TCF-CHT had a remarkable affinity and selectivity for CHT (Fig. 1f).
Considering that pH and temperature played vital roles in the reactivity of the probe [55–57], the effect of pH and temperature on the fluorescence intensity at 670 nm were evaluated respectively in the absence and presence of CHT. As shown in Fig. S13a (Supporting information), the free TCF-CHT emitted slightly in the pH range of 4.0 to 10.0. After incubated with CHT for 30 min, the fluorescence intensity at 670 nm displayed evident enhancement and reached the maximum at pH 6.0, which also kept relatively high at pH 7.4. In the addition, the reaction accelerated as the temperatures grew up from 25 ℃ to 37 ℃ (Fig. S13b in Supporting information). However, due to the inevitable affection of high temperature for enzyme activity, F670 nm of the reaction system at 45 ℃ was lower than that in other temperatures. Hence, it could be concluded that TCF-CHT was suitable for the monitoring of CHT activity under physiological conditions.
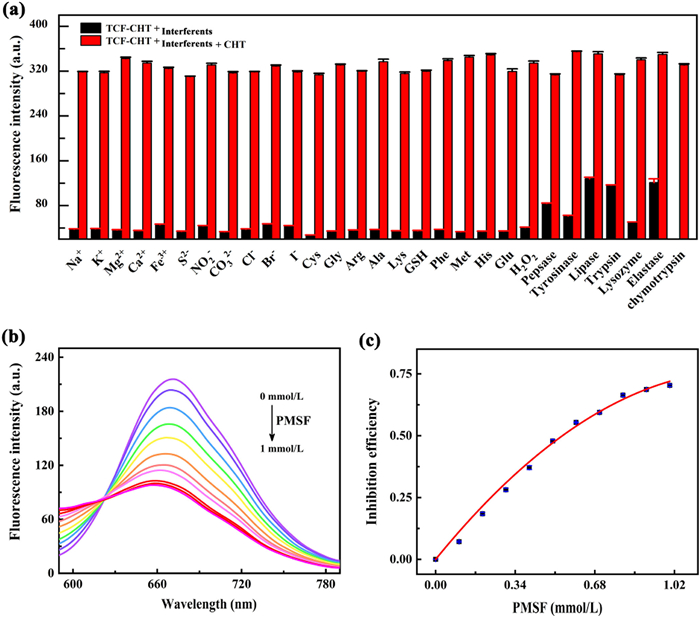
Selectivity is one of the most crucial factors influencing the application potential of fluorescent probes [58–62]. Hence, various interferents including common endogenous ions and substances were investigated for the selectivity of TCF-CHT towards CHT. As depicted in Fig. 2a, the fluorescence intensity of the coexistent system of TCF-CHT and these potential interferents exhibited no significant change, whereas increased dramatically after the addition of CHT, validating excellent selectivity and anti-interference capability of TCF-CHT.

|
Download:
|
| Fig. 2. (a) Fluorescence intensity of TCF-CHT (2 µmol/L) in the presence of CHT (66.7 µg/mL) and different interferents (100 µmol/L) except pepsase (6.67 mg/mL), tyrosinase (100 µg/mL), lipase (3.33 µg/mL), trypsin (40 µg/mL), lysozyme (5 µg/mL) and elastase (3.33 mg/mL). (b) Fluorescence emission spectra of TCF-CHT (2 µmol/L) incubated with CHT (33.3 µg/mL) and various concentration of PMSF (0–1.0 mmol/L). (c) Inhibitory efficiency of PMSF on CHT (33.3 µg/mL) activity. | |
In recent years, inhibitor screening with novel fluorescent probe has made increasing contribution to new drug discovery. Herein, TCF-CHT was indeed utilized to evaluate the inhibit ability of PMSF, an inhibitor of CHT. As expected, CHT activity progressively decreased with increasing PMSF concentrations (Fig. 2b). The inhibitory capacity of PMSF was further assessed by the half maximal inhibitory concentration (IC50). The calculation of the inhibition efficiency relied on the inhibition formula (F0-F1)/(F0-F2), where F0 and F1 are the fluorescence intensities of the mixtures of TCF-CHT and CHT in the absence and presence of PMSF, respectively, whereas F2 represents the fluorescence intensity of TCF-CHT in the absence of PMSF and CHT. Based on the calculations, the relationship between the inhibition efficiency and the inhibitor concentration was plotted. As shown in Fig. 2c, IC50 of PMSF was calculated to be 0.55 mmol/L. The results contended that PMSF could effectively inhibit CHT activity in organisms and provided a promising method to screening other CHT inhibitors.
The responding mechanism of TCF-CHT towards CHT were firstly explored by HR-MS and HPLC. A major peak of m/z = 408.0773 for [M + Na]+ of TCF-OH appeared in the high resolution mass spectrum of the reaction solution of TCF-CHT and CHT (Fig. S14a in Supporting information), indicating the formation of the parent fluorophore TCF-OH. The results from HPLC analysis exhibited that the parent fluorophore TCF-OH and the probe TCF-CHT showed a single peak at 10.129 min and 10.686 min, respectively. When reacted with CHT for 30 min, the peak at 10.691 min corresponding to TCF-CHT was significantly weakened and a new peak at 10.111 min indicative of TCF-OH appeared, affirming that the fluorescence enhancement in the coexistent system of TCF-CHT and CHT resulted from the generation of the parent fluorophore TCF-OH.
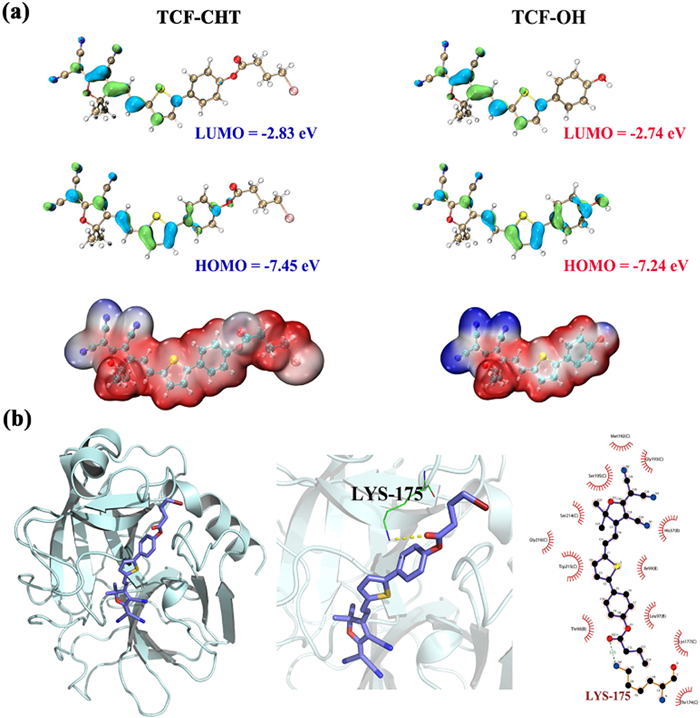
To further understand the luminescence mechanism during the recognition, theoretical calculation was carried out. DFT (density functional theory) theoretical calculation illustrated the spatial distribution of HOMO (highest occupied molecular orbital) and LUMO (lowest unoccupied molecular orbital) of TCF-CHT, predominantly localized within the entire fluorophore. Conversely, no significant alterations were observed in the electronic density distribution of HOMO and LUMO in TCF-OH (Fig. 3a). The difference in orbital energy levels between LOMO and HOMO for TCF-CHT and TCF-OH were determined to be 4.62 eV and 4.50 eV, respectively. This finding elucidated the small red shift in the maximum absorption wavelengths of TCF-CHT when the CHT was present. The intense fluorescence emission of TCF-CHT upon interacting with CHT could be attributed to the allowed S1 to S0 transition (670 nm, f = 1.4833). Additionally, the electrostatic potential distribution diagram of TCF-CHT and TCF-OH revealed a distinct electronic pushing and drawing effect characteristic of ICT in TCF-OH (Fig. 3a), which finally led to a strong fluorescence emission. Furthermore, the binding ability between TCF-CHT and CHT was evaluated using molecular docking simulation, which confirmed the high binding affinity of TCF-CHT towards CHT (PDB entry: 2P8O) (Fig. 3b). Notably, TCF-CHT formed a hydrogen bond with the amino acid LYS-175 in CHT, resulting in a binding energy of −7.2 kcal/mol.

|
Download:
|
| Fig. 3. (a) Electrostatic potential distribution and frontier molecular orbitals of TCF-CHT and TCF-OH. (b) Theoretical calculation of the interaction between TCF-CHT and CHT. | |
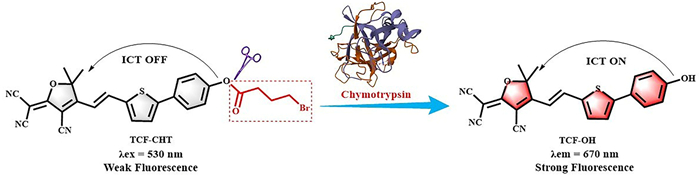
Based on the discussion above mentioned, the recognition mechanism of TCF-CHT towards CHT was illustrated in Scheme 2. The ester bond between parent fluorophore TCH-OH and recognition group 4-bromobutyryl was specifically hydrolyzed by CHT, resulting in the restoration of ICT process in TCF-OH and the consequent release of remarkable fluorescence.

|
Download:
|
| Scheme 2. Schematic illustration of the recognition mechanism between TCF-CHT and CHT. | |
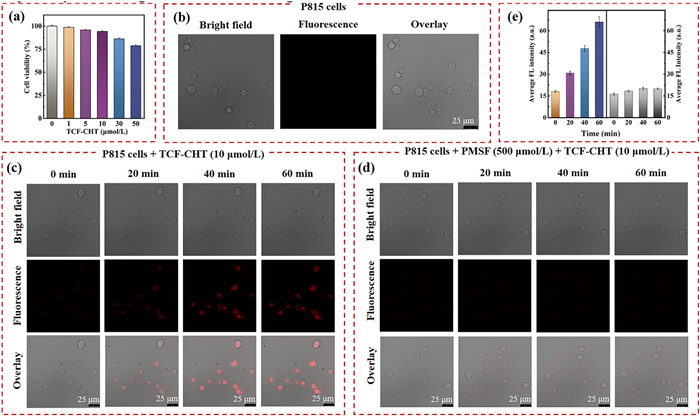
P815 and HepG2 cells were served as model cells to assess the cytotoxicity of the probe TCF-CHT in the CCK-8 assay. The survival rate of P815 cells after treatment with varied levels of TCF-CHT (0–50 µmol/L) was greater than 80% (Fig. 4a), indicating that TCF-CHT has low biotoxicity to P815 cells, and could be applied in in vivo imaging of CHT.

|
Download:
|
| Fig. 4. Fluorescence imaging of endogenous CHT in P815 cells with TCF-CHT. (a) Cell viability of P815 cells treated with TCF-CHT at various concentration levels (from 0 to 50 µmol/L). (b) Background fluorescence of P815 cells. (c) P815 cells treated with TCF-CHT (10 µmol/L) at different times. (d) P815 cells sequentially incubated with PMSF (500 µmol/L) for 30 min and TCF-CHT (10 µmol/L) at different times. (e) Relative mean fluorescence intensities of (c) (Left) and (d) (Right). λex/λem = 530/650–690 nm. | |
P815 tumor cells, in which CHT was overexpressed [39], were firstly selected to evaluate the capability of TCF-CHT in imaging endogenous CHT in living systems. As shown in Fig. 4b, P815 cells itself showed no fluorescence. After incubation with TCF-CHT (10 µmol/L), P815 cells gradually exhibited red fluorescence with the extended incubation time (Fig. 4c). However, P815 tumor cells hardly showed any fluorescence after the sequential incubation with the inhibitor PMSF (500 µmol/L, 30 min) and TCF-CHT (10 µmol/L, 60 min), which may be attributed to the inhibition of the secretion of CHT by the inhibitor PMSF (Fig. 4d). Importantly, the relative mean fluorescence intensity at 60 min in P815 cells only incubated with TCF-CHT was approximately 3-fold higher than that in the cells pretreated with PMSF (Fig. 4e).
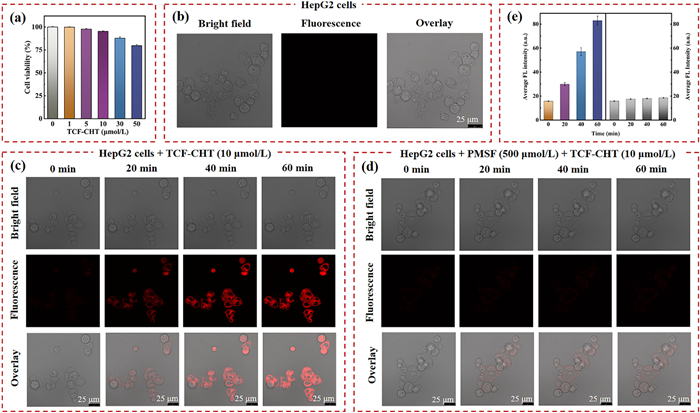
HepG2 cells, another typical representative of CHT existence [63,64], was also chosen to check the cell imaging ability of TCF-CHT. The survival rate of HepG2 cells was also greater than 80% upon the treatment of TCF-CHT (0–50 µmol/L) (Fig. 5a). As exhibited in Fig. 5b, no obvious fluorescence was observed in HepG2 cells. However, a distinct fluorescence signal showed up after HepG2 cells were treated with 10 µmol/L of TCF-CHT (Fig. 5c). In addition, HepG2 cells exhibited a similar phenomenon to that observed with P815 cells when the cells were treated with the inhibitor PMSF (500 µmol/L) and TCF-CHT at the same time (Fig. 5d). Interestingly, HepG2 cells showed a greater fluorescence intensity enhancement than P815 cells exhibited (Figs. 4e and 5e), indicating that HepG2 cells might possess more CHT activity than P815 cells have. The above-mentioned results clearly demonstrated that the probe TCF-CHT owned eye-catching recognition capability for endogenous CHT in living cells.

|
Download:
|
| Fig. 5. Confocal imaging of endogenous CHT in HepG2 cells. (a) Cell viability of HepG2 cells treated with TCF-CHT at various concentration levels (from 0 to 50 µmol/L). (b) Background fluorescence of HepG2 cells. (c) HepG2 cells treated with TCF-CHT (10 µmol/L) at different times. (d) HepG2 cells sequentially incubated with PMSF (500 µmol/L) for 30 min and TCF-CHT (10 µmol/L) at different times. (e) Relative mean fluorescence intensities of (c) (Left) and (d) (Right). λex/λem = 530/650–690 nm. | |
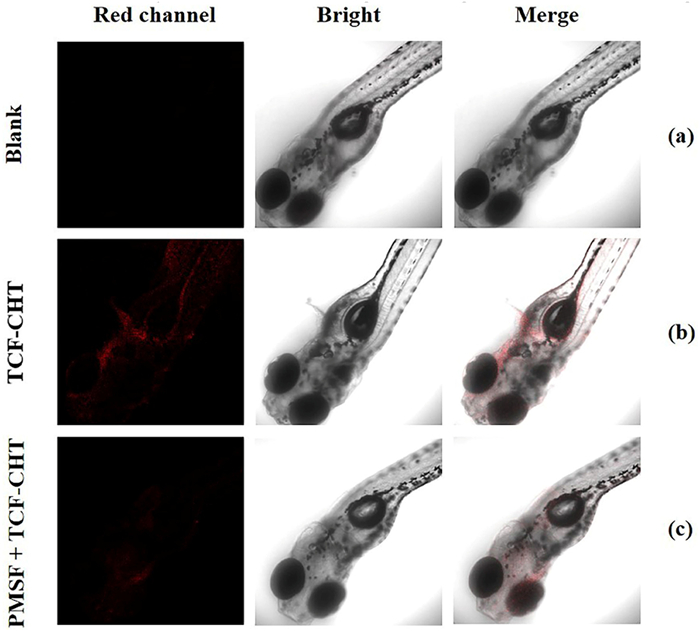
Inspired by the excellent achievements in monitoring CHT activity in living cells, it was further investigated for the capability of TCF-CHT in imaging endogenous CHT in zebrafish and tumor-bearing mice. As shown from Fig. 6, significant fluorescence emission enhancement was found in the zebrafish group treated with TCF-CHT. However, the zebrafish group, which underwent a sequential incubation with PMSF (20 µmol/L, 30 min) and TCF-CHT (10 µmol/L, 60 min), exhibited relatively weak fluorescence.

|
Download:
|
| Fig. 6. Fluorescence imaging of enogenous CHT in zebrafish with TCF-CHT. (a) Blank; (b) Zebrafish treated with TCF-CHT (10 µmol/L) for 60 min; (c) Zebrafish sequentially incubated with PMSF (20 µmol/L, 30 min) and TCF-CHT (10 µmol/L, 60 min). λex/λem = 561/580–700 nm. | |
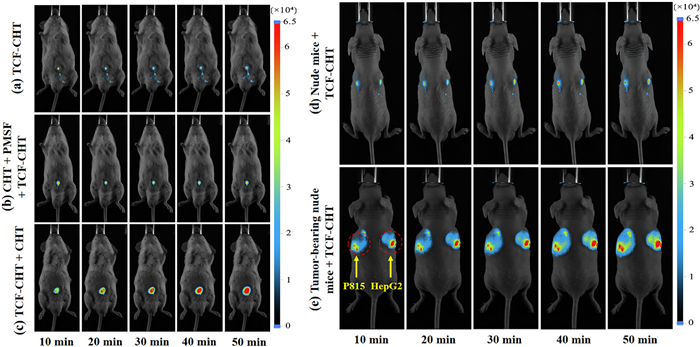
The confocal imaging capability of exogenous CHT in mice were also investigated. When TCF-CHT and a mixed solution of CHT, PMSF and TCF-CHT were injected into mice, respectively, the mice only showed very weak background fluorescence, which displayed no significant change with increasing time (Figs. 7a and b). However, after injecting the mixture of TCF-CHT and CHT into mice and incubating for 10 min, significant fluorescence signals were observed, and the fluorescence signals gradually increased with time (Fig. 7c). These results indicated that the probe TCF-CHT have the excellent ability to monitor exogenous CHT. Furthermore, fluorescence confocal imaging of endogenous CHT was also carried out. The normal nude mice injected with TCF-CHT had weak fluorescent signal (Fig. 7d), whereas significant fluorescence appeared in the tumor region after TCF-CHT was injected in the P815 and HepG2 tumor-bearing mouse, and the fluorescence intensity increased significantly with time (Fig. 7e). Interestingly, the fluorescence intensity from the tumor region resulting from HepG2 cells was more distinguished than that in the tumor region generated from P815 cells, which was consistent with the experimental results of cell imaging described above. These results from fluorescence imaging in zebrafish and tumor-bearing mice validated that TCF-CHT could be effectively utilized to image endogenous CHT in organismal systems.

|
Download:
|
| Fig. 7. Fluorescence imaging of CHT in vivo with TCF-CHT at different time. Fluorescence images of exogenous CHT: (a) 50 µmol/L TCF-CHT; (b) CHT (100 µg/mL) was preincubated with PMSF (200 µmol/L) for 30 min and then co-incubated with TCF-CHT (50 µmol/L); (c) TCF-CHT (50 µmol/L) was incubated with 100 µg/mL CHT; Fluorescence images of endogenous CHT in nude mouse (d) and P815 (left) and HepG2 (right) tumor-bearing nude mice (e) with TCF-CHT (50 µmol/L) at different time. λex/λem = 540/700 nm. | |
In summary, a novel fluorescent probe TCF-CHT based on ICT mechanism was synthesized for the detection of CHT activity. The probe exhibited excellent analytical properties including long-wavelength emission (670 nm), excellent selectivity and low detection limit (8.91 ng/mL), and large Stokes shift (140 nm). Moreover, this probe was also successfully applied for the in vivo imaging of exogenous and endogenous CHT in P815 and HepG2 cells, zebrafish, and tumor-bearing mice. The eye-catching performance of TCF-CHT may endow it more potential applications in pharmacological and pathological studies of diseases associated with endogenous CHT overexpression.
Declaration of competing interestThe authors declare that they have no known competing financial interests or personal relationships that could have appeared to influence the work reported in this paper.
CRediT authorship contribution statementXiaochun Wang: Conceptualization, Methodology, Funding acquisition, Revision of manuscript, Project administration; Chuanfeng Fan: Investigation, Validation, Writing-Original Draft; Jian Gao: Investigation, Validation; Yingkai Gao: Investigation, Validation; Xintong Yang: Investigation, Validation; Gaoning Li: Resources; Fei Li: Investigation, Validation; Jin Zhou: Investigation, Validation; Haifeng Yu: Validation, Resources; Yi Huang: Investigation, Validation; Jin Chen: Investigation, Validation, Project administration; Yingying Shan: Investigation, Validation; Li Chen: Investigation, Validation.
AcknowledgmentsThe authors are grateful for the financial support provided by National Natural Science Foundation of China (Nos. 21775005, 41430641 and 41140032) and the Start-Up Fund of Qingdao University of Science and Technology (No. 12030430010883).
Supplementary materialsSupplementary material associated with this article can be found, in the online version, at doi:10.1016/j.cclet.2024.109838.
| [1] |
G.J.C. Vreeke, J.P. Vincken, P.A. Wierenga, Food Res. Int. 165 (2023) 112485. DOI:10.1016/j.foodres.2023.112485 |
| [2] |
T.S. Corrigan, L.M. Lotti Diaz, S.E. Border, et al., J. Enzym. Inhib. Med. Chem. 35 (2020) 1387-1402. DOI:10.1080/14756366.2020.1781107 |
| [3] |
J. Carrere, C. Figarella, O. Guy, et al., Biochim. Biophys. Acta 883 (1986) 46-53. DOI:10.1016/0304-4165(86)90133-9 |
| [4] |
A. Karlund, I. Paukkonen, C. Gomez-Gallego, M. Kolehmainen, Healthcare 9 (2021) 1002. DOI:10.3390/healthcare9081002 |
| [5] |
H. Filali, O.M.E. Yaagoubi, A. Lahmadi, et al., Clin. Proteom. 19 (2022) 41. DOI:10.1186/s12014-022-09375-9 |
| [6] |
S.V. Lucena, F.P. Rufino, G.E.D. De Dantas Moura, et al., 3 Biotech 12 (2022) 19. |
| [7] |
H.J. Sun, J.Q. Xiao, Q.H. Qiao, et al., Int. J. Oral Maxillofac. Surg. 46 (2017) 877-882. DOI:10.1016/j.ijom.2017.02.1267 |
| [8] |
D. Shah, K. Mital, Adv. Ther. 35 (2018) 31-42. DOI:10.1007/s12325-017-0648-y |
| [9] |
J.Q. Li, L.L. Wang, G.T. Zeng, et al., Immunopharm. Immunot. 44 (2022) 959-969. DOI:10.1080/08923973.2022.2093743 |
| [10] |
J. Ko, L. Skudder-Hill, J. Cho, S.H. Bharmal, M.S. Petrov, World J. Gastroenterol. 27 (2021) 3357-3371. |
| [11] |
S. Trapp, A.A. Aghdassi, J. Glaubitz, et al., J. Cell. Mol. Med. 25 (2021) 4658-4670. DOI:10.1111/jcmm.16404 |
| [12] |
G. Sanchez, S. Chalmers, X. Ahumada, et al., PLoS One 15 (2020) e0233591. DOI:10.1371/journal.pone.0233591 |
| [13] |
V. Carmona, S.M. Aragon, J. Goldberg, et al., Nutr. Neurosci. 23 (2020) 575-590. DOI:10.1080/1028415X.2018.1534793 |
| [14] |
A. Toth, A. Demcsak, F. Zankl, et al., Pancreatology 22 (2022) 713-718. DOI:10.1016/j.pan.2022.06.258 |
| [15] |
A. Jermusyk, J. Zhong, K.E. Connelly, et al., Am. J. Hum. Genet. 108 (2021) 1852-1865. DOI:10.1016/j.ajhg.2021.09.002 |
| [16] |
A. Hedstrom, C. Steiner, R. Valente, et al., Minerva Gastroenterol. Dietol. 66 (2020) 17-22. |
| [17] |
V.I. Fedchenko, A.V. Veselovsky, A.T. Kopylov, S.A. Kaloshina, A.E. Medvedev, Med. Hypotheses 165 (2022) 110895. DOI:10.1016/j.mehy.2022.110895 |
| [18] |
A.V. Braun, V.F. Taranchenko, L.A. Tikhomirov, A.P. Grechukhin, I.V. Rybal'chenko, J. Anal. Chem. 73 (2018) 622-631. |
| [19] |
X. Jin, L.M. Yang, X.W. Yan, Q.Q. Wang, ACS Chem. Neurosci. 12 (2021) 1093-1099. DOI:10.1021/acschemneuro.0c00816 |
| [20] |
B. Ramesh, S. Abnouf, S. Mali, et al., ACS Chem. Biol. 14 (2019) 2616-2628. DOI:10.1021/acschembio.9b00506 |
| [21] |
T.B. Ren, Z.Y. Wang, Z. Xiang, et al., Angew. Chem. Int. Ed. 60 (2020) 800-805. |
| [22] |
K.H. Gebremedhin, Y.M. Li, Q.C. Yao, et al., J. Mater. Chem. B 7 (2019) 408-414. DOI:10.1039/C8TB02635A |
| [23] |
W.J. Zhang, F.J. Huo, Y.K. Yue, et al., J. Am. Chem. Soc. 142 (2020) 3262-3268. DOI:10.1021/jacs.9b13936 |
| [24] |
H.B. Xiao, P. Li, B. Tang, Coord. Chem. Rev. 427 (2021) 213582. DOI:10.1016/j.ccr.2020.213582 |
| [25] |
Y. Gao, Y.L. Hu, Q.M. Liu, et al., Angew. Chem. Int. Ed. 60 (2021) 10756-10765. DOI:10.1002/anie.202101278 |
| [26] |
X. Luo, L.Y. Gu, X.H. Qian, Y.J. Yang, Chem. Commun. 56 (2020) 9067-9078. DOI:10.1039/D0CC00542H |
| [27] |
X.Y. Li, X.H. Li, H.M. Ma, Chem. Sci. 11 (2020) 1617-1622. DOI:10.1039/C9SC05505C |
| [28] |
Q.Q. Yang, N. Ji, Y. Zhan, et al., Anal. Chim. Acta 1186 (2021) 339116. DOI:10.1016/j.aca.2021.339116 |
| [29] |
J. Xing, Q.Y. Gong, R.F. Zou, et al., J. Mater. Chem. B 6 (2018) 1449-1451. DOI:10.1039/C7TB03303F |
| [30] |
J. Liu, Z.Q. Wang, G.J. Mao, et al., Anal. Chim. Acta 1171 (2021) 338655. DOI:10.1016/j.aca.2021.338655 |
| [31] |
H.Y. Zhang, X.Y. Yin, J.X. Hong, Y.Z. Deng, G.Q. Feng, Talanta 223 (2021) 121768. DOI:10.1016/j.talanta.2020.121768 |
| [32] |
W.X. Yao, Y.J. Cao, M.Y. She, et al., ACS Sens. 6 (2021) 54-62. DOI:10.1021/acssensors.0c01707 |
| [33] |
Y.P. Chen, J. Cao, X.X. Jiang, Z.Z. Pan, N.Y. Fu, Sens. Actuator. B: Chem. 273 (2018) 204-210. DOI:10.1016/j.snb.2018.06.021 |
| [34] |
L. Wu, S.H. Yang, H. Xiong, et al., Anal. Chem. 89 (2017) 3687-3693. DOI:10.1021/acs.analchem.6b05115 |
| [35] |
H. Xiong, R.R. Li, S.Y. Liu, et al., ACS Appl. Bio Mater. 1 (2018) 310-317. DOI:10.1021/acsabm.8b00072 |
| [36] |
S. Mu, Y.X. Xu, Y.T. Zhang, et al., J. Mater. Chem. B 7 (2019) 2974-2980. DOI:10.1039/C9TB00085B |
| [37] |
Y. Okorochenkova, M. Porubsky, S. Benicka, J. Hlavac, Chem. Commun. 54 (2018) 7589-7592. DOI:10.1039/C8CC01731J |
| [38] |
J.M. Wang, Z.D. Teng, T. Cao, et al., Sens. Actuator. B: Chem. 306 (2020) 127567. DOI:10.1016/j.snb.2019.127567 |
| [39] |
Y. Qu, Z.S. Xu, J.M. Wang, et al., Sens. Actuator. B: Chem. 382 (2023) 133552. DOI:10.1016/j.snb.2023.133552 |
| [40] |
H.Y. Sun, R.C. Panicker, S.Q. Yao, Biopolymers 88 (2010) 141-149. |
| [41] |
S.Y. Liu, X.T. Zou, X. Gao, Y.Y. Zhang, Anal. Chem. 94 (2022) 17922-17929. DOI:10.1021/acs.analchem.2c03933 |
| [42] |
D. Sondag, J. Merx, E. Rossing, et al., ChemBioChem 23 (2022) e202200190. DOI:10.1002/cbic.202200190 |
| [43] |
B.D. Vieira, H. Niero, R. de Felicio, et al., Front. Microbiol. 13 (2022) 786008. DOI:10.3389/fmicb.2022.786008 |
| [44] |
Y.Q. Zi, D.W. Xu, C. Li, F. Qu, X.E. Zhao, Sens. Actuator. B: Chem. 345 (2021) 130243. DOI:10.1016/j.snb.2021.130243 |
| [45] |
L.P. Yang, Z.G. Li, T.H. Wei, et al., Front. Chem. 8 (2020) 522974. DOI:10.3389/fchem.2020.522974 |
| [46] |
J.T. Zhao, T. Ma, B.B. Chang, J.G. Fang, Molecules 27 (2022) 5922. DOI:10.3390/molecules27185922 |
| [47] |
H. Li, Y.J. Kim, H. Jung, J.Y. Hyun, I.J. Shin, Chem. Soc. Rev. 51 (2022) 8957-9008. DOI:10.1039/D2CS00722C |
| [48] |
J. Zhou, C.M. Yu, Z. Li, et al., Anal. Methods 11 (2019) 1312-1316. DOI:10.1039/C9AY00041K |
| [49] |
Z.K. Wang, Z.Y. Zhao, C.Y. Liu, et al., Photochem. Photobiol. Sci. 18 (2019) 1851-1857. DOI:10.1039/c9pp00222g |
| [50] |
X.X. Teng, M.Y. Tian, J.W. Zhang, L.J. Tang, J.N. Xin, Tetrahedron Lett. 59 (2018) 2804-2808. DOI:10.1016/j.tetlet.2018.06.016 |
| [51] |
H.Y. Xie, J. Gao, X.T. Sun, et al., Talanta 253 (2023) 123943. DOI:10.1016/j.talanta.2022.123943 |
| [52] |
Y. Zhu, J.L. Han, Q. Zhang, et al., RSC Adv. 9 (2019) 26729-26733. DOI:10.1039/C9RA05650E |
| [53] |
W. Wang, Z.H. Peng, M. Ji, J.Q. Chen, P. Wang, Bioorg. Chem. 126 (2022) 105902. DOI:10.1016/j.bioorg.2022.105902 |
| [54] |
M. Zhao, Y.J. Gao, S.Y. Ye, et al., Analyst 144 (2019) 6262-6269. DOI:10.1039/C9AN01505A |
| [55] |
Y. Wen, W.J. Zhang, T. Liu, F.J. Huo, C.X. Yin, Anal. Chem. 89 (2017) 11869-11874. DOI:10.1021/acs.analchem.7b03612 |
| [56] |
T. Zhang, F.J. Huo, W.J. Zhang, J.B. Chao, C.X. Yin, Sens. Actuator. B: Chem. 345 (2021) 130393. DOI:10.1016/j.snb.2021.130393 |
| [57] |
J.D. Wang, F.J. Huo, Y.B. Zhang, C.X. Yin, Chin. Chem. Lett. 34 (2023) 107818. DOI:10.1016/j.cclet.2022.107818 |
| [58] |
Z.L. Qiu, J. Shu, D.P. Tang, Anal. Chem. 89 (2017) 5152-5160. DOI:10.1021/acs.analchem.7b00989 |
| [59] |
S.Z. Lv, Y. Tang, K.Y. Zhang, D.P. Tang, Anal. Chem. 90 (2018) 14121-14125. DOI:10.1021/acs.analchem.8b04981 |
| [60] |
S.Y. Shen, W.L. Xu, J.X. Lu, W.X. Qing, Y. Wang, Chin. Chem. Lett. 35 (2024) 108360. DOI:10.1016/j.cclet.2023.108360 |
| [61] |
Y.Y. Sun, X.N. Zhou, L.Y. Sun, et al., Chin. Chem. Lett. 33 (2022) 4229-4232. DOI:10.1016/j.cclet.2022.01.087 |
| [62] |
L.X. Fu, Y.Y. Tan, Y. Ding, et al., Chin. Chem. Lett. 35 (2024) 108886. DOI:10.1016/j.cclet.2023.108886 |
| [63] |
S. Fatima, S. Gupta, A.B. Khan, S. ur Rehman, M.A. Jairajpuri, Biochem. Biophys. Res. Commun. 628 (2022) 25-31. DOI:10.1016/j.bbrc.2022.08.061 |
| [64] |
Q. Miao, Y. Sun, T.T. Wei, et al., J. Biol. Chem. 283 (2008) 8218-8228. DOI:10.1074/jbc.M709789200 |