 2024, Vol. 35


b Institute of Zhejiang University - Quzhou, Quzhou 324000, China;
c Donghai Laboratory, Zhoushan 316000, China;
d Ningbo Institute of Materials Technology & Engineering, University of Chinese Academy of Sciences, Ningbo 315200, China;
e School of Biological and Chemical Engineering, NingboTech University, Ningbo 315100, China;
f Zhejiang Hengyi Petrochemical Research Institute Co., Ltd., Hangzhou 310058, China
Hydrogen peroxide (H2O2) is regarded as one of the 100 most important fundamental chemicals in the world, which has been widely used in chemical industry, disinfection, and environmental treatment [1–3]. Generally, H2O2 is produced by the traditional anthraquinone process with harmful organic solvents at high pressure and temperature, which is unfriendly-environmental, energy-intensive, and difficult for on-site production [3–5]. Recently, electrochemical 2e− ORR from O2 and H2O to H2O2 at ambient conditions driven by renewable electricity has been regarded as an emerging alternative of anthraquinone process [6–9]. However, intense competition from the energetically favorable 4e− ORR pathway leads to a great challenge to achieve high selectivity of H2O2 production [10–12]. Moreover, H2O2 under acidic condition is more stable and it is favorable for the industrial production particularly to commercial proton conducting polymeric membranes [13–15]. For the environmental application, the generated H2O2 can be directly used for high efficient pollutant removal in Fenton reaction, since it is critical for high active •OH radicals production under acidic conditions [16,17].
Recently, metal-free carbon-based catalysts are promising candidates for ORR due to their low cost, low risk of metallic ion leaching, high electrochemical stability and adjustable nanostructure [1,18–21]. Cui et al. reported that oxygen doped carbon nanotubes with rich oxygen functional groups exhibited high H2O2 selectivity (~90%) and activity in 0.1 mol/L KOH during ORR [22]. The O—CNTs were prepared by chemical oxidation of CNTs using concentrated nitrate acid, which is environmental-unfriendly. Besides, the carbon-based electrocatalysts are designed to be porous structure, which contribute to the mass transfer and expose as many active sites as possible. For instance, Liu et al. proposed a template-assisted pyrolysis route to prepare oxygen-doped carbon nanosheet catalyst for 2e− ORR with the onset potential of 0.825 V (vs. RHE) and mass activity of 14.5 A/g at 0.75 V (vs. RHE) [23]. The chemical titration experiment proves that C═O species are the most active sites for 2e− ORR. Up to now, most reported metal-free carbon-based catalysts were performed on ORR under alkaline conditions, and the poor activity under acidic conditions was attributed to the relatively high O2 adsorption barrier on the catalyst surface [24–28].
Nonmetal element-doping strategy has also been widely used to improve the activity of carbon materials for ORR [29,30]. Chen et al. synthesized nitrogen- and fluoride-codoped carbon nanocages (NF—Cs) through a simple and scalable template method [31]. The doped N atoms accelerate O2 molecule adsorption and further form the *OOH intermediate on the catalyst surface, and the F atoms contribute to the desorption of the *OOH intermediate, which is critical for H2O2 formation. This material is synthesized by calcination of PVDF containing F at high temperatures, which releases highly toxic gases with certain environmental risks. However, most reported nitrogen-doped carbon catalysts show 4e− pathway during ORR under alkaline conditions [32–34]. Therefore, deep understanding to design and adjust the active nitrogen configuration is still needed for 2e− oxygen reduction pathways [35].
Herein, we report O and N co-doped carbon nanosheets (O/N—C) as highly selective and active catalyst for 2e− ORR to H2O2 under acidic conditions. The N doping can accelerate the adsorption of O2 molecule to form *OOH intermediate. By O and N co-doping at certain content, the adsorption of *OOH intermediate on the catalyst surface was optimized to improve the H2O2 selectivity. The O/N—C exhibits high activity, remarkable selectivity and long-term stability for the H2O2 generation via 2e− ORR pathway. The effects of the porous structure and chemical composition of the O/N—C catalyst on the activity and selectivity were investigated by physical and chemical characterizations. The in situ electrochemical tests shows that the N incorporation contributes to the fast ORR kinetics. Furthermore, based on experimental studies and DFT calculations, we reveal the synergic role of the doped O and N atoms in the reaction of electrochemical H2O2 generation. Moreover, the environmental application of the obtained catalysts in organic dye degradation was also demonstrated.
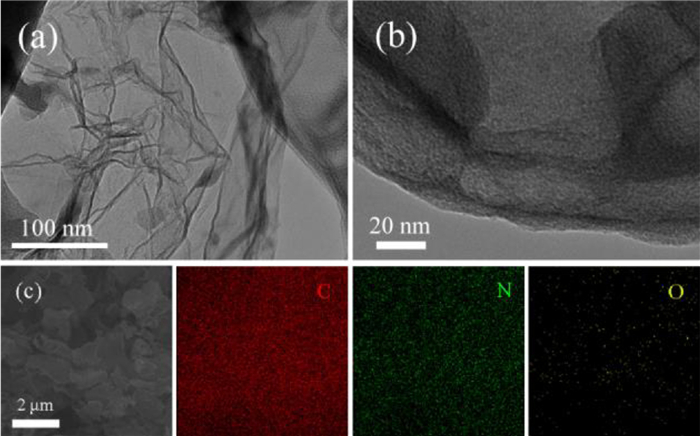
The O/N—C precursor Mn-MOFs was firstly prepared by a hydrothermal reaction, and the X-ray diffraction (XRD) results indicate that the Mn-MOFs was successfully synthesized (Fig. S1 in Supporting information). After annealing the Mn-MOFs under NH3/Ar (1:9, v: v) atmosphere and acid leaching, the Mn species aggregated into MnO nanocrystals were completely removed and O/N—C catalyst was obtained. Field-emission scanning electron microscopy (FESEM) and transmission electron microscopy (TEM) have been employed to characterize the morphology and structure of catalyst. The FESEM and TEM images of O/N—C catalyst show that the catalyst has a thin nanosheet structure with slightly wrinkled amorphous nature (Figs. 1a and b, Fig. S2 in Supporting information). The TEM images also show that no obvious metal nanoparticles were found in the catalyst, indicating the completed removal of Mn species in the catalyst (Figs. 1a and b). The O—C catalyst without N doping was also prepared and the SEM images show a similar structure (Fig. S3 in Supporting information). XRD patterns show that graphitic carbon was formed in the O/N—C and O—C after calcination process with the absence of metallic Mn species (Fig. S4 in Supporting information). The SEM images and element mapping images indicate that oxygen and nitrogen are homogeneously doped in the carbon catalyst (Fig. 1c).

|
Download:
|
| Fig. 1. (a, b) TEM image of O/N—C catalyst. (c) SEM image and element mappings of O/N—C catalyst. | |
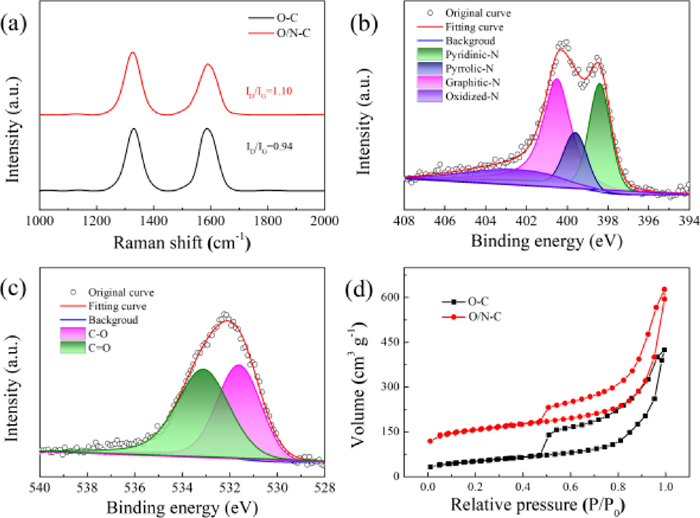
Raman spectrum of O/N—C displays two peaks at 1342 and 1586 cm−1, which are attributed to D band for defects and G band for graphitic carbon. The ID/IG ratio of 1.10 for the O/N—C is higher than that of O—C (0.94), indicating more defective sites were created by nitrogen doping process (Fig. 2a). The X-ray photoelectron spectroscopy (XPS) is used to distinguish the nitrogen and oxygen functional groups on the prepared samples (Fig. S5 in Supporting information). The full spectra of the catalysts show that the N is doped into O/N—C. The signal of C 1s spectra can be deconvoluted into five typical peaks: C—C/C═C (284.6 eV), C═N (285.5 eV), C—O (286.3 eV), C═O (287.6 eV) and O=C—O (289.1 eV) (Fig. S6 in Supporting information). Previous studies have shown that the electronic properties of carbon can be modified by both N and O doping, which promotes the electrochemical H2O2 production [18,35,36]. The N 1s spectra can be deconvoluted into four typical peaks: pyridinic-N (398.4 eV), pyrrolic-N (399.6 eV), graphitic-N (400.5 eV) and oxidized-N (402.7 eV) (Fig. 2b) [37,38]. The O 1s spectrum indicates the presence of two O—containing species: C—O (531.6 eV) and C═O (533.1 eV) (Fig. 2c). Benefiting from the nanosheet structure, the O/N—C exhibits a high Brunauer–Emmett–Teller (BET) surface area of 576.3 m2/g, which is significantly higher than that of O—C (180.4 m2/g, Fig. 2d). The O/N—C exhibits a typical-I triangular hysteresis and mesopores dominated in the catalyst. The pore size distributions of O/N—C and O—C indicates that more micro/mesopores are existed in O/N—C sample, where enormous active sites are exposed for the ORR reaction (Fig. S7 in Supporting information). The micropores of O/N—C are also beneficial for reducing the retention time of H2O2 product, which prevents its further reduction to H2O and increase the selectivity [27,39].

|
Download:
|
| Fig. 2. (a) Raman spectra of O—C and O/N—C. (b) XPS N 1s spectrum of O/N—C. (c) XPS O 1s spectrum of O/N—C. (d) N2 adsorption-desorption isotherms of O—C and O/N—C. | |
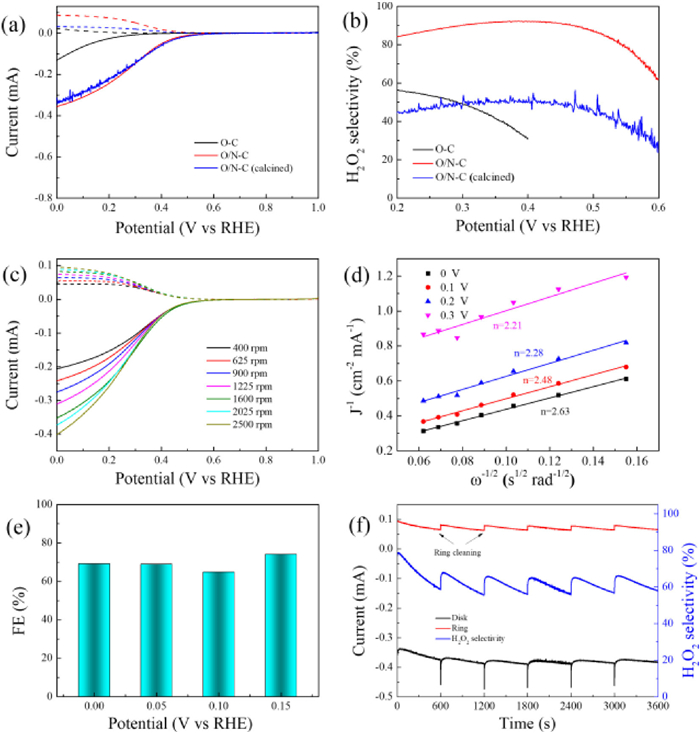
The electrocatalytic activity towards ORR is systematically investigated on a RRDE electrode in 0.1 mol/L HClO4 solution. The ORR polarization curves of catalysts are shown in Fig. 3a. RRDE is an effective method to evaluate the generation of H2O2 from ORR test. The O2 molecules are first reduced on the disk electrode to produce both H2O and H2O2. The obtained H2O2 is immediately thrown by the rotating disk electrode onto a Pt ring electrode and oxidized to O2 to produce a ring current, from which the amount of H2O2 can be measured. The solid lines are the disk current, while the dash lines represent the disk current. The onset potential (0.40 V at 0.1 mA/cm2 H2O2 current density) is obtained for the O/N—C catalyst, which is much higher than that of O—C (0.03 V at 0.1 mA/cm2 H2O2 current density). Fig. 3b further shows the selectivity of O/N—C catalyst. It achieves 92.4% selectivity at 0.40 V (vs. RHE) and remains relatively high selectivities (> 84%) in a wide range of potential between 0.2 V and 0.5 V, which are much higher than that of O—C catalyst (31%–59% in the range of 0.2 and 0.4 V). The distinct performance could be ascribed to N doping and defects in O/N—C catalyst. In the cyclic voltammogram (CV) curves of O/N—C (Fig. S8 in Supporting information), a reduction peak of O2 starting at 0.6 V (vs. RHE) is observed in the O2-saturated solution, which is much higher than that of O—C catalyst under the same conditions (Fig. S9 in Supporting information). Furthermore, the ORR activities of O/N—C catalysts obtained at different temperatures from 600 ℃ to 900 ℃ (denoted as O/N—C-600, O/N—C-700, O/N—C-800, and O/N—C-900) were also evaluated by RRDE tests. The polarization curves of these catalysts were shown in Fig. S10a (Supporting information). The O/N—C-600 exhibits poor ORR activity owing to the low degree of carbonization. The onset potential and half wave potential increase with the elevated temperatures from 600 ℃ to 800 ℃. However, the O/N—C-700 shows higher H2O2 selectivities than O/N—C-800 at a wide range of potentials (Fig. S10b in Supporting information). Further increase in the temperature to 900 ℃ caused a decreased activity for ORR, which is related to loss of N dopant under high temperatures (Table S2 in Supporting information). Therefore, O/N—C-700 is the optimized sample because of the higher activity and selectivity. In addition to RRDE tests, the selectivity of the catalysts was also tested by rotating disk electrode (RDE) examination to calculate electron transfer numbers (n) according to Koutecky-Levich (K-L) equation (Figs. 3c and d). The calculated n at different potentials (0-0.3 V) by RDE results are almost identical to the results in RRDE test (Table S1 in Supporting information). Then, the ORR performance of O/N—C was carried out by the bulk electrolysis in an H-type cell at different potentials (Fig. 3e). The standard curves between Ce4+ and absorbance are shown in Fig. S11 (Supporting information). The Faradaic efficiency (FE) are ~70% at different potentials from 0 V to 0.15 V (vs. RHE) in the H-cell test. The H-cell test results indicate that the catalyst shows the nearly same selectivity as that in the RRDE tests. The stability of O/N—C catalyst was measured at 0.1 V (vs. RHE) by RRDE test and the Pt ring was cleaned every 10 min (Fig. 3f) [22]. The ring and disk current of O/N—C are nearly constant in such a long-term H2O2 production. The calculated selectivity is also well maintained, which is slightly lower than the RRDE test result at 0.1 V (Fig. 3f). It is reported that porous structure can contribute to electrochemical H2O2 production as well. The porous structure of catalyst can ensure large surface areas to accelerate the mass transfer process between electrolyte and active sites. In addition, the porous structure leads to more active sites and defects, which both are critical to the electrochemical activity improvement. Therefore, the electrochemical surface area (ECSA) of catalysts was also measured by the double-layer capacitance (Cdl) method (Fig. S12 in Supporting information). The Cdl value for O/N—C catalyst achieves 17.01 mF/cm2, which is much higher than that of O—C catalyst (2.44 mF/cm2, Fig. S13 in Supporting information). This result indicates the higher ECSA of O/N—C catalyst, in which more active sites are obtained.

|
Download:
|
| Fig. 3. (a) Polarization curves of O—C, O/N—C and O/N—C (calcined) on RRDE at 1600 rpm in O2-saturated 0.1 mol/L HClO4 (solid line: disk current; dashed line: ring current) and (b) corresponding H2O2 selectivity of O—C, O/N—C and O/N—C (calcined). (c) RRDE voltammograms of O/N—C at different rotating rates in O2-saturated 0.1 mol/L HClO4 and (d) corresponding K-L plots at different potentials. (e) The electrochemical production H2O2 faradic efficiency (FE) in H-cell by O/N—C in O2-saturated 0.1 mol/L HClO4 at different potentials. (f) Stability test of O/N—C at 0.1 V vs. RHE and 1.2 V vs. RHE for ring and corresponding H2O2 selectivity. | |
Besides, the in situ electrochemical impedance spectroscopy (EIS) tests were also conducted at different potentials to study the interfacial charge transfer mechanism and reaction kinetics. As shown in the Nyquist plots (Figs. 4a and b), the impedance of O—C and O/N—C catalysts under acidic ORR process were tested from 0.60 V to 0.30 V. Obviously, the fitted Rct of O/N—C catalyst decreases faster than that of O—C catalyst (Fig. 4c and Table S2), indicating a faster adsorption of reactants and reaction kinetics with increasing potentials on O/N—C catalyst during acidic ORR process. The impedance results are in accordance with the electrochemical ORR performance. The Bode plot of the EIS spectra is also used to investigate the charge transition. As shown in Figs. 4d and e, the phase angle of the Bode plot increases firstly and then decreases in the frequency region from 100 Hz to 0.1 Hz, and a maximum characteristic frequency (ωp) is seen on the Bode plots of both O—C and O/N—C catalysts at different potentials. The ωp of O/N—C is shifted to higher frequency with decrease in potential and it is almost constant in this potential range with O—C. The time constant (τ) for the charge-transfer relaxation process is calculated with the following equation: τ = 1/ωp. Clearly, the O/N—C catalyst exhibits better performance in the charge-transfer process over control O—C catalyst (Fig. 4f), indicating that the N incorporation contributes to the fast ORR kinetics.

|
Download:
|
| Fig. 4. Nyquist plots and corresponding Bode plots for (a, d) O—C and (b, e) O/N—C at different potentials. (c) Responses of Rct at different potentials for O—C and O/N—C. (f) ωp and corresponding τ at different potentials for O—C and O/N—C. (g) Optimized *OOH structures adsorbed on the active sites. Color code: C, grey; O, red; N, blue; and H, white. (h) Calculated volcano relation of UL as a function of △G*OOH. (i) Gibbs free energy profile of 2e− ORR pathway at U = 0.7 V for the four models. | |
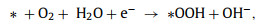
To better understand the catalytic mechanism, DFT calculations were performed to identify the possible active sites. Based on XPS results and previous reports, pyrrolic-N and oxygen-containing groups are considered to contribute to the efficient 2e− ORR [1,36,40]. Herein, the O—C and O/N—C catalysts were modeled with a super cell of 6 × 6 using a graphene nanoribbon model system (Fig. S14 in Supporting information). Therefore, two configurations with four considered adsorption sites in the O—C and O/N—C catalysts were built. The 2e− ORR pathway proceeds through O2 activation (Eq. 1) and the desorption of the *OOH intermediate (Eq. 2):
|
(1) |

|
(2) |

|
(3) |
According to the above equations, *OOH is the only intermediate in the 2e− ORR pathway. In contrast, catalysts with strong oxygen binding energies can easily dissociate the O−O bond and form H2O as the main product (Eq. 3). Therefore, the binding strength of *OOH determines the 2e− ORR activity, which is supported by Sabatier principle [2]. Herein, four considered active sites of the two catalysts were performed to calculate the adsorption free energy of *OOH (△G*OOH) (Fig. 4g), which is widely used as descriptor to understand the activity trend of catalysts for 2e− ORR [23,26,27]. The idea value of △G*OOH is ~4.22 eV. The 2e− ORR volcano plots are presented in Fig. 4h, in which the limiting potential (UL) plotted as a function of △G*OOH for the four models. Among all the estimated adsorption sites, the O/N—C—COOH site is located at almost the vertex of the volcano plot, indicating its highest activity with a △G*OOH value of ~4.12 eV. The UL value of this site is 0.60 V, achieving a low overpotential of ~0.10 V, which is comparable or better than those previously reported catalysts [2,41]. In contrast, the O—C—COOH site without N doping exhibits a △G*OOH value of ~4.04 eV, indicating N doping is also critical for *OOH adsorption. It has been proven that *OOH adsorption step is critical for carbon-based catalysts to achieve high activity under acidic conditions [18,42]. Therefore, the improved activity can be ascribed to improved *OOH binding by N doping. Fig. 4i shows the Gibbs free energy profiles of 2e− ORR pathway at U = 0.7 V for the four models. Compared with O—C—COOH site, the O/N—C—COOH site exhibits a smaller theoretical overpotential for H2O2 formation, which explains the better catalytic activity of O/N—C than O—C. This result agrees well with the distinct selectivity of O/N—C and O—C in the experiment.
Furthermore, the XPS survey results of different catalysts show that the high performance of O/N—C is closely linked to the O and N contents of the catalysts (Figs. S15 and S16, Table S3 in Supporting information). A low degree of carbonization and fewer N content of O/N—C-600 lead to the poor activity of H2O2 production. O/N—C-700 with the increased carbonization degree and the highest N content of 8.49% exhibits the best selectivity of H2O2 production among different catalysts. The samples obtained at higher temperatures have lower O or N contents, which lead to the decreased activity and selectivity of H2O2 production (Figs. S17a and b in Supporting information). More importantly, the O/N—C samples obtained at different temperature also exhibited N and COOH content-dependent selectivity to H2O2. Previous studies have proven that N dopants can modulate the electronic structure of carbon atoms. Particularly, pyrrolic N plays a critical role in facilitating the 2e− ORR pathway [36,40]. Besides, after removing oxygen functional groups by annealing O/N—C-700 in vacuum, the obtained O/N—C-700 (calcined) exhibits a similar onset potential and slightly lower disk current (Fig. 3a). Also, the ring current has greatly decreased, which leads to a poor H2O2 selectivity (Fig. 3b). Finally, three commercial carbon black catalysts without further treatment were selected and measured by RRDE tests for comparison and the results are shown in Figs. S17c and d (Supporting information). The three commercial samples only contain oxygen functional groups at low contents. Obviously, they exhibit poor activity and selectivity towards electrochemical H2O2 production under acidic conditions. Therefore, both O and N contribute to the activity and selectivity of H2O2 production in this catalyst.
The accumulated H2O2 can be applied to organic dye removal in an electro-Fenton system. There representative organic dyes, including RhB, MB and MO, were chosen to demonstrate the feasibility of our obtained catalyst for organic dye degradation. A three-electrode H-type cell was used for dye pollutant removal (Fig. S18 in Supporting information). The bright colors of RhB and MO disappeared with 10 min, while the bright colors of MB disappeared within 20 min (Fig. S19a in Supporting information) (inset: color changes). The dye degradation efficiencies of RhB, MB and MO were 100.0%, 99.8% and 98.9% in 20 min, respectively, which proves that the obtained O/N—C catalyst has great potential in the organic pollutant degradation field. In comparison, the obtained O—C catalyst exhibited obviously slower degradation performance in RhB removal under the same conditions (Fig. S19b in Supporting information). The pseudo-first-order rate (k) increased from 0.1578 min−1 to 0.4564 min−1 when the cathode was changed from O—C to O/N—C catalyst in the system, which increased 2.9 times under the same conditions. The degradation mechanism of RhB was also investigated by comparison experiments and the results are shown in Fig. S19c (Supporting information). In the absence of Fe2+, the removal efficiency of RhB was only 17.6% while the value was 99.3% with Fe2+ adding in 10 min under the same condition. Therefore, the generation of hydroxyl radicals (•OH) from H2O2 production and Fe2+ adding in the system plays the main role in the degradation of RhB (Eqs. 4–6) [43]. On the other hand, 100 mmol/L methanol (MeOH) was added to the system as scavengers of hydroxyl radicals to further prove the mechanism. The methanol significantly inhibited the degradation of RhB and only 8.2% of RhB was removed in 10 min under the same conditions (Fig. S19c). The above results indicates that •OH are the main active species in the dye degradation in this system. The degradation of RhB under different initial pH was also evaluated in H-cell and single cell under the same conditions. In the H-cell, the degradation efficiency of RhB quickly decrease with the increase of initial pH, which caused by the precipitation of Fe2+ with the quickly increased pH value during the reaction time in the cathode cell (Fig. S20 in Supporting information). In the single cell, the degradation efficiency of RhB is a little lower than in the H-cell when the initial pH is 2 (Fig. S19d in Supporting information). This might be caused by the oxidation of Fe2+ and H2O2 on the anode, which would decrease the production of •OH. On the other hand, with the increase of initial pH, the system could maintain relatively high efficiency for RhB removal in the single cell, which is beneficial for further environmental applications.
|
(4) |
|
(5) |
|
(6) |
In this study, we synthesized O and N co-doped carbon nanosheets to completely reduce O2 to H2O2 by the 2e− pathway in acidic solution. The catalyst was prepared by simple hydrothermal reaction and pyrolysis treatments. After the optimization in annealing temperatures, the O/N—C obtained at 700 ℃ is determined to be the optimal catalyst with the onset potential of 0.40 V (vs. RHE) and H2O2 selectivity of 92.4% in 0.1 mol/L HClO4. Moreover, the O/N—C also showed robust stability under acidic conditions. This study sheds light on understanding the relationship between dopants in carbon catalysts and, the activity and selectivity for electrochemical H2O2 production in acidic solutions. Furthermore, the O/N—C also shows a high removal efficiency toward three organic dye degradation. This study will contribute to the exploration of the ORR process using metal-free catalysts and provide new insights on developing efficient catalysts for other electrocatalytic reactions.
Declaration of competing interestThe authors declare that they have no known competing financial interests or personal relationships that could have appeared to influence the work reported in this paper.
AcknowledgmentsThis work was supported by the National Natural Science Foundation of China (Nos. U22A20432, 22278364, 22211530045, 22178308), the Fundamental Research Funds for the Central Universities (Nos. 226-2022-00044, 226-2022-00055), the Research Funds of Institute of Zhejiang University-Quzhou (No. IZQ2021KJ2003), National Key Research and Development Program of China (No. 2022YFB4002100), the development project of Zhejiang Province's "Jianbing" and "Lingyan" (No. 2023C01226), the Startup Foundation for Hundred-Talent Program of Zhejiang University, the Science Foundation of Donghai Laboratory (No. DH-2022ZY0009), Zhejiang University Global Partnership Fund, the China Postdoctoral Science Foundation (No. 2021M702813).
Supplementary materialsSupplementary material associated with this article can be found, in the online version, at doi:10.1016/j.cclet.2023.108926.
| [1] |
Y. Bu, Y. Wang, G.F. Han, et al., Adv. Mater. 33 (2021) 2103266. DOI:10.1002/adma.202103266 |
| [2] |
S. Siahrostami, A. Verdaguer-Casadevall, M. Karamad, et al., Nat. Mater. 12 (2013) 1137-1143. DOI:10.1038/nmat3795 |
| [3] |
Y. Wang, G.I.N. Waterhouse, L. Shang, T. Zhang, Adv. Energy. Mater. 11 (2020) 2003323. |
| [4] |
A. Li, Y.H. Wang, J. Ren, et al., Appl. Catal. A 593 (2020) 117422. DOI:10.1016/j.apcata.2020.117422 |
| [5] |
C. Xia, J.Y. Kim, H. Wang, Nat. Catal. 3 (2020) 605-607. DOI:10.1038/s41929-020-0486-1 |
| [6] |
S. Siahrostami, S.J. Villegas, A.H. Bagherzadeh Mostaghimi, et al., ACS Catal. 10 (2020) 7495-7511. DOI:10.1021/acscatal.0c01641 |
| [7] |
E. Jung, H. Shin, B.H. Lee, et al., Nat. Mater. 19 (2020) 436-442. DOI:10.1038/s41563-019-0571-5 |
| [8] |
X.X. Yang, Y.C. Zeng, W. Alnoush, et al., Adv. Mater. 34 (2022) 2107954. DOI:10.1002/adma.202107954 |
| [9] |
Y.H. Wu, J.H. Sun, S.X. Dou, J.Y. Sun, J. Energy Chem. 69 (2022) 54-69. DOI:10.1016/j.jechem.2021.12.028 |
| [10] |
R. Gao, J. Wang, Z.F. Huang, et al., Nat. Energy 6 (2021) 614-623. DOI:10.1038/s41560-021-00826-5 |
| [11] |
X. Xie, L. Peng, H. Yang, et al., Adv. Mater. 33 (2021) e2101038. DOI:10.1002/adma.202101038 |
| [12] |
Y. Pang, H. Xie, Y. Sun, M.M. Titirici, G.L. Chai, J. Mater. Chem. A 8 (2020) 24996-25016. DOI:10.1039/d0ta09122g |
| [13] |
S. Yang, A. Verdaguer-Casadevall, L. Arnarson, et al., ACS Catal. 8 (2018) 4064-4081. DOI:10.1021/acscatal.8b00217 |
| [14] |
J.R. Varcoe, P. Atanassov, D.R. Dekel, et al., Energ. Environ. Sci. 7 (2014) 3135-3191. DOI:10.1039/C4EE01303D |
| [15] |
M.J. Gibian, D.L. Elliott, W.R. Hardy, J. Am. Chem. Soc. 91 (1969) 7528-7530. DOI:10.1021/ja01054a062 |
| [16] |
H.Y. Zhao, L. Qian, Y. Chen, Q.N. Wang, G.H. Zhao, Chem. Eng. J. 332 (2018) 486-498. DOI:10.1016/j.cej.2017.09.093 |
| [17] |
S.L. Wen, Z.Y. Niu, Z. Zhang, L.H. Li, Y.C. Chen, J. Hazard. Mater. 341 (2018) 128-137. DOI:10.1016/j.jhazmat.2017.07.014 |
| [18] |
K. Dong, Y. Lei, H. Zhao, et al., J. Mater. Chem. A 8 (2020) 23123-23141. DOI:10.1039/d0ta08894c |
| [19] |
S.C. Perry, D. Pangotra, L. Vieira, et al., Nat. Rev. Chem. 3 (2019) 442-458. DOI:10.1038/s41570-019-0110-6 |
| [20] |
F.P. Cheng, X.Y. Peng, L.Z. Hu, et al., Nat. Commun. 13 (2022) 6486. DOI:10.1038/s41467-022-34278-6 |
| [21] |
Y.K. Zhang, X.Y. Wang, S.X. Zheng, et al., Adv. Funct. Mater. 31 (2021) 2104377. DOI:10.1002/adfm.202104377 |
| [22] |
Z. Lu, G. Chen, S. Siahrostami, et al., Nat. Catal. 1 (2018) 156-162. DOI:10.1038/s41929-017-0017-x |
| [23] |
S. Chen, T. Luo, K. Chen, et al., Angew. Chem. Int. Ed. 60 (2021) 16607-16614. DOI:10.1002/anie.202104480 |
| [24] |
C. Xia, Y. Xia, P. Zhu, L. Fan, H. Wang, Science 366 (2019) 226-231. DOI:10.1126/science.aay1844 |
| [25] |
Q. Yang, W. Xu, S. Gong, et al., Nat. Commun. 11 (2020) 5478. DOI:10.1038/s41467-020-19309-4 |
| [26] |
Y. Xia, X. Zhao, C. Xia, et al., Nat. Commun. 12 (2021) 4225. DOI:10.1038/s41467-021-24329-9 |
| [27] |
K. Dong, J. Liang, Y. Wang, et al., Angew. Chem. Int. Ed. 60 (2021) 10583-10587. DOI:10.1002/anie.202101880 |
| [28] |
S.S. Xu, Y. Gao, T. Liang, L.P. Zhang, B. Wang, Chin. Chem. Lett. 33 (2022) 5152-5157. DOI:10.1016/j.cclet.2022.01.057 |
| [29] |
X.Z. Hu, Y.N. Liu, W.J. Cui, et al., Adv. Funct. Mater. 33 (2023) 2208781. DOI:10.1002/adfm.202208781 |
| [30] |
Y. Ding, S. Maitra, C.H. Wang, et al., J. Energy Chem. 70 (2022) 236-247. DOI:10.1016/j.jechem.2022.02.031 |
| [31] |
N. Jia, T. Yang, S. Shi, et al., ACS Sustain. Chem. Eng. 8 (2020) 2883-2891. DOI:10.1021/acssuschemeng.9b07047 |
| [32] |
K. Choi, S. Kim, ACS Nano 16 (2022) 16394-16401. DOI:10.1021/acsnano.2c05607 |
| [33] |
C. Zhang, B. Ma, Y.K. Zhou, ChemCatChem 11 (2019) 5495-5504. DOI:10.1002/cctc.201901334 |
| [34] |
Q.L. Wei, M. Cherif, G.X. Zhang, et al., Nano Energy 62 (2019) 700-708. DOI:10.1016/j.nanoen.2019.05.083 |
| [35] |
G.F. Han, F. Li, W. Zou, et al., Nat. Commun. 11 (2020) 2209. DOI:10.1038/s41467-020-15782-z |
| [36] |
E. Contreras, D. Dominguez, H. Tiznado, et al., Nanoscale 11 (2019) 2829-2839. DOI:10.1039/c8nr08384c |
| [37] |
L. Li, C. Tang, Y. Zheng, et al., Adv. Energy. Mater. 10 (2020) 2000789. DOI:10.1002/aenm.202000789 |
| [38] |
Y. Jiao, Y. Zheng, M. Jaroniec, S.Z. Qiao, J. Am. Chem. Soc. 136 (2014) 4394-4403. DOI:10.1021/ja500432h |
| [39] |
G. Chen, J. Liu, Q. Li, et al., Nano Res. 12 (2019) 2614-2622. DOI:10.1007/s12274-019-2496-3 |
| [40] |
Z.Q. Xu, Z.Y. Ma, K. Dong, et al., Chem. Commun. 58 (2022) 5025-5028. DOI:10.1039/d2cc01238c |
| [41] |
A. Verdaguer-Casadevall, D. Deiana, M. Karamad, et al., Nano Lett. 14 (2014) 1603-1608. DOI:10.1021/nl500037x |
| [42] |
J.-Y. Zhang, C. Xia, H.-F. Wang, C. Tang, J. Energy Chem. 67 (2022) 432-450. DOI:10.1016/j.jechem.2021.10.013 |
| [43] |
Z.L. Wei, H.L. Xu, Z.C. Lei, et al., Chin. Chem. Lett. 33 (2022) 920-925. DOI:10.1016/j.cclet.2021.07.006 |