 2024, Vol. 35


As carbon-based fluorescent nanomaterials, carbon dots (CDs) show great potentials in various applications including drug delivery [1], optoelectronic devices [2], photocatalysis [3], bioimaging [4,5], ion detection [6,7] and energy development [8], owing to their excellent fluorescent properties [9,10], good water solubility [11], low toxicity [12], high biocompatibility [13], and wide source of raw materials [14]. At present, the preparation methods of CDs are numerous, such as arc-discharge method [15], laser-ablation method [11], electrochemical synthesis [16], hydrothermal/solvothermal methods [9,17], chemical synthesis method [18], or acidic oxidation method [19,20]. Among those reported, the solvothermal method is one of the most commonly used preparation strategies to obtain CDs with good fluorescence. Appropriate organic solvents and relatively high pressure and temperature are required for this procedure [21]. Alternatively, by implementing carbonization of carbon precursors in a tube furnace or hyperthermia equipment, solid-phase pyrolysis or thermal polymerization methods circumvent safety issues like the use of organic solvents or high-pressure reaction conditions [22–24]. Despite great advances, it is still important to further explore new easy-to-perform synthetic strategies to prepare highly fluorescent CDs.
While most of the previously reported CDs show optimal blue photoluminescence (PL) emission, tremendous endeavors have been devoted to the synthesis of CDs with longer emission wavelengths for wider applications. For instance, green-emissive carbon dots (G-CDs) are potentially useful in optical applications owing in part to the function that they can emit green light to provide one of the three primary colors for lighting technologies [25–27]. G-CDs are also potentially useful for fluorescent probes [28,29], biological imaging [30], etc. To meet these optical prospects, it is imperative to obtain brightly fluorescent G-CDs. In 2011, Zhu et al. developed G-CDs with PL quantum yield (QY) of 11.4% via a one-step solvothermal treatment of graphene oxide [30]. Qu et al. carried out a one-step microwave treatment of citric acid (CA) and urea to obtain water-soluble G-CDs with PL QY of 14% in 2012 [31]. In 2014, Gu et al. obtained G-CDs with PL QY up to 44.3% through hydrothermal treatment of glucose, ethylenediamine and hydrochloric acid [32]. Meanwhile, Jiang et al. developed solvothermal treatment on raw materials of m-, o-, or p-phenylenediamine, respectively, to offer G-CDs, blue-emissive CDs and red-emissive CDs with PL QYs determined to be 17.6%, 4.8%, and 26.1%, respectively [33]. In 2018, Li et al. developed cysteine-based chiral optically active G-CDs with a PL QY of 41.26% from hydrothermal carbonization [34]. In the same year, Yuan et al. solvothermally treated three-fold symmetric phloroglucinol to yield triangular CDs with narrow bandwidth emission, and the resultant blue-PL CDs, G-CDs and red-PL CDs exhibit high PL QYs up to 66%, 72%, and 54% in ethanol, respectively [9]. Yuan et al. chose 3,4,9,10-tetranitroperylene as the precursor to obtain G-CDs with PL QY up to 80% [35]. Zhao et al. synthesized G-CDs with PL QY of 65% using CA, urea, and CaCl2 as precursors in 2021 by the space-confined vacuum heating approach [36]. Nevertheless, the development of new facile methods for synthesizing G-CDs with high PL QY continues to be an important scientific effort.
In this work, we chose appropriate precursors, CA and cyanamide, allowing high-performance G-CDs to be synthesized simply by heating the homogeneous precursors in an open vessel. CA has been widely used in the preparation of CDs [7,10]. Whereas, cyanamide has high nitrogen content and enables various reactions due to the two functional groups of ‒NH3 and ‒C≡N [37,38], which gives an opportunity to realize nitrogen-doping and hence greatly increase the PL QY of CA-derived CDs. The preparation process does not require any organic solvents, complex operations, high-pressure reactors, or expensive instruments, which is easy to perform and possesses a potential for scale-up production. The resultant G-CDs exhibit bright fluorescence at 521 nm with PL QY up to 73%. Based on the advantages of surface-rich functional groups and high PL QY of G-CDs, a brightly fluorescent G-CDs/thermoplastic polyurethane (G-CDs/TPU) film was further fabricated, which could be used as the candidate of color-converting materials for optoelectronic devices, for instance, white light-emitting diodes (LEDs). In addition, combined with a simple visual microfluidic chip platform that we designed with rapid synchronized six-sample testing capacities at once, rapid response and quantitative detection of Fe3+, Cu2+, and Mn2+ metal ions could be achieved using G-CDs as fluorescent probes.
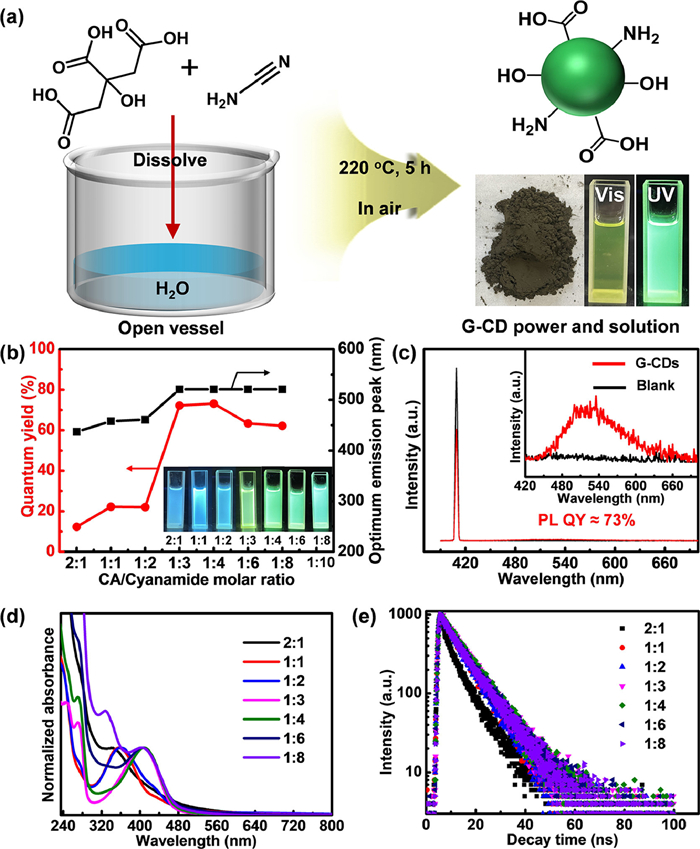
To synthesize highly fluorescent G-CDs, the precursors of CA and cyanamide were dissolved in a small amount of water to form a homogeneous solution, followed by heating at 220 ℃ for 5 h in an open vessel (Fig. 1a). In this process, dehydration, polymerization, and carbonization occur [24,39–41], resulting in the formation of G-CDs (Fig. S1 in Supporting information). As such, the synthetic procedure is quite simple, which is completed by simply heating the homogeneous precursors in an open vessel, without use of any organic solvents, complex operations, high-pressure reactors, or expensive instruments. Through this synthesis process, black solid powder crude product with a yield of 50% was obtained (Fig. S1), which was purified to obtain gray powder of G-CDs (Fig. S2 in Supporting information). Fluorescence quenching was observed in the powder product, consistent with literature reports, while the G-CDs dispersed in solvents like water, N,N-dimethylformamide (DMF), ethanol, or dimethyl sulfoxide (DMSO) exhibit bright green fluorescence.

|
Download:
|
| Fig. 1. Synthesis and optical properties of G-CDs. (a) Preparation process of G-CDs, yielding powder product which exhibits bright green fluorescence after dispersed in ethanol. (b) PL QY and optimum emission peak of G-CDs for 7 ethanol solutions of CDs prepared with different molar ratios of CA and cyanamide varying from 2:1 to 1:8. Insets: photographs taken under 365 nm UV light for 7 ethanol solutions of CDs. (c) PL QY spectrum of G-CDs prepared with a CA to cyanamide molar ratio of 1:3. (d) UV–vis absorption spectra, and (e) PL decay for 7 ethanol solutions of CDs. | |
In order to synthesize G-CDs with optimal optical properties, various reaction variables were systematically investigated, including reaction temperature, reaction time, molar ratio of CA and cyanamide, and even different synthetic methods. To explore the impact of reaction temperature and time on optical properties of G-CDs, we conducted 30 groups of experiments under different temperatures (140, 160, 180, 200, 220, and 240 ℃), and different times (1, 2, 4, 7, and 10 h) (see detailed discussion in Supporting information). Briefly, we found the experiments implemented under temperature below 200 ℃ could not yield products with green fluorescence (blue for 140–160 ℃ and cyan for 180–200 ℃ under a 365 nm UV light, Figs. S3–S10 in Supporting information), while those under 220 and 240 ℃ enable the formation of products with strong green fluorescence (Figs. S11–S15 in Supporting information). Whereas, reaction time has small influence on the PL peak position (Figs. S3–S15), and we picked proper reaction time of 5 h to gain an optimal PL QY of G-CDs (Fig. S13). Then, with fixed reaction temperature of 220 ℃ and time of 5 h, a series of fluorescent CDs were prepared with different molar ratios of CA and cyanamide varying from 2:1 to 1:1, 1:2, 1:3, 1:4, 1:6, and 1:8. Insets in Fig. 1b and Fig. S16 (Supporting information) shows photographs of 7 groups of CDs in ethanol under daylight and ultraviolet (UV) light. All 7 samples of CDs show excitation-dependent PL emission (Figs. S17 and S18 in Supporting information). However, the products prepared under molar ratio of CA to cyanamide less than 1:3 have optimal emission peaks located at 430–460 nm, to exhibit blue fluorescence with PL QYs of 10%–25%. Whereas, as the molar ratio of CA to cyanamide is greater than or equal to 1:3, CDs that show optimal emission peaks at 521 nm could be obtained, to display bright green fluorescence with higher PL QYs in the range of 60%–73% (Fig. 1b), and the PL QY of G-CDs is able to reach a maximum of 73% when the molar ratio of CA and cyanamide is 1:3 (Fig. 1c). The results indicate that the CDs prepared with molar ratio of CA to cyanamide greater than or equal to 1:3 have a relatively stable peak position at 521 nm to give strong green emission. Similarly, in the ultraviolet–visible (UV–vis) absorption spectra, the first absorption peak shifts from 344 nm to 410 nm with the decrease in molar ratio of CA and cyanamide, and is stable at 410 nm when the molar ratio is greater than or equal to 1:3 (Fig. 1d). This absorption might be caused by the π-π* transition of the pyridone ring of molecular fluorophore grafted on G-CDs [41–44]. As shown in Fig. 1e, the PL decay time is 7.32 ns with a biexponential process when the molar ratio of CA to cyanamide is 2:1, might ascribed to the recombination from the n–π* defect state and the π–π* intrinsic state, respectively [45,46]. By contrast, the PL decay times are around 9 ns with single exponential when the molar ratio of CA to cyanamide is less than 2:1, and the PL life time reaches the maximum value of 9.4 ns with a molar ratio of 1:3. This feature suggests pure radiative decay with a minimal nonradiative contribution enables efficient fluorescence emission [9,47,48]. As such, G-CDs prepared from the optimal experimental procedure with a CA to cyanamide molar ratio of 1:3, reaction temperature of 220 ℃, and reaction time of 5 h, were chose as an example for further characterizations.
Besides, other synthetic methods in terms of direct pyrolysis (without adding water), hydrothermal treatment, and refluxing, were further employed to prepare CDs for comparison (see details in Supporting information). Seven parallel experiments with different molar ratios of CA and cyanamide as described above were performed for each synthetic method. The samples obtained by direct pyrolysis show weaker green fluorescence compared with those developed by the proposed method here (Figs. S19 and S20 in Supporting information). This feature suggests that the addition of water into CA and cyanamide to form a homogeneous solution prior to heating is conducive to the fabrication of G-CDs with high fluorescence. The hydrothermal treatment of CA and cyanamide at 220 ℃ could only yield products with blue PL emission (Figs. S21 and S22 in Supporting information). Furthermore, the products obtained by refluxing precursors at 100 ℃ for 5 h show very weak blue fluorescence (Figs. S23 and S24 in Supporting information). These results suggest that heating the homogeneous mixture of CA and cyanamide in an open vessel facilitates the occurrence of dehydration, polymerization, and carbonization, allowing the formation of CDs with strong green fluorescence.
The resultant G-CDs exhibit good solubility in various solvents such as, DMF, DMSO, formamide (FM), formic acid (FA), water, and isopropanol (IPA) (Fig. S25 in Supporting information), but almost insoluble in weak polarity solvents, such as, toluene, dichloromethane, methyl acetate, n-hexane, and petroleum ether. The PL emission peak as well as first absorption peak of G-CDs shift from 500 nm to 528 nm and 367 nm to 420 nm with the change of solvent type, respectively (Fig. S26 in Supporting information). The solvent-dependent optical properties can be attributed to the effect of the solvent on the molecular fluorophores of G-CDs [43,49,50].
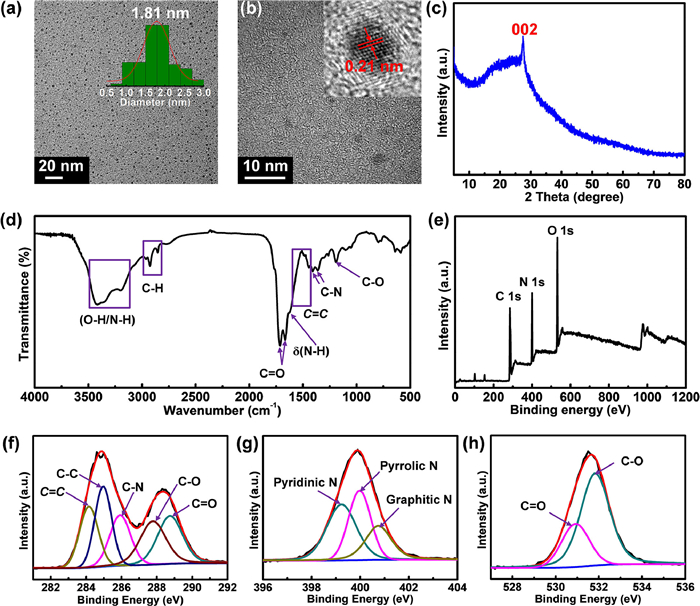
Detailed structural characterizations were conducted for G-CDs. Transmission electron microscopy (TEM) indicates that G-CDs are composed of nanoparticles with an average particle size of 1.81 nm without obvious aggregation (Fig. 2a). Fig. 2b shows the high-resolution TEM (HRTEM) pattern possesses a typical lattice fringe with a spacing of 0.21 nm, corresponding to the d spacing of the (100) planes of graphene [9,27]. The X-ray diffraction profile shows a peak at 2θ = 27.3°, attributed to the characteristic (002) diffraction of graphite (Fig. 2c). To determine the surface chemical structures of G-CDs, the Fourier transform infrared (FT-IR) spectroscopy and X-ray photoelectron spectroscopy (XPS) spectra were investigated, as shown in Figs. 2d–h. The broad FT-IR absorption band from 3100 cm−1 to 3500 cm−1 should be caused by stretching vibrations of O−H and N−H. The stretching vibration band of C−H is observed from 2830 cm−1 to 2990 cm−1. The strong peaks located at 1664 and 1712 cm−1 correspond to C=O stretching vibration and the shoulder peak at 1623 cm−1 can be attributed to the bending vibration of N−H. Absorption band from 1450 cm−1 to 1600 cm−1 are assigned to the stretching vibration of the aromatic ring skeleton (C=C) [51]. The two weak absorptions at 1358 and 1407 cm−1 and a sharp peak at 1188 cm−1 could be assigned to C−N and C−O stretching vibrations, respectively. XPS spectra of G-CDs show the existence of C, N, and O elements (corresponding atomic content: 56.5%, 20.8%, 22.7%) (Fig. 2e). The high-resolution C 1s XPS spectrum can be fitted with five components that belong to C=C (284.1 eV), C−C (285 eV), C−N (285.9 eV), C−O (287.8 eV), and C=O (288.8 eV) bonds [24,52]. The N 1s high-resolution XPS spectrum can be converted into pyridinic N (399.2 eV), pyrrolic N (400 eV), and graphitic N (400.8 eV), respectively [27]. The O 1s peak is the sum of C=O (530.9 eV) and C−O (531.8 eV) [21,52]. The above results imply the presence of hydroxyl, amino, carboxyl and other functional groups on G-CD surface.

|
Download:
|
| Fig. 2. Structural characterizations of G-CDs. (a) TEM image. The inset is the corresponding particle size histogram. (b) HRTEM image. The inset represents HRTEM image of a single G-CD. (c) XRD profile of the G-CDs. (d) FT-IR spectrum and (e) XPS survey. High-resolution (f) C 1s, (g) N 1s and (h) O 1s XPS spectra. | |
To gain further insight into the formation and fluorescence mechanism of G-CDs, we conducted the control experiments in the absence of either cyanamide or CA. The sample obtained with use of only CA as precursor presents weak blue PL emission under 365 nm UV light, along with the disappearance of strong absorption at around 410 nm in the UV–vis absorption spectra (Fig. S27 in Supporting information). Whereas, no fluorescent product could be obtained with use of only cyanamide as precursor (Fig. S28 in Supporting information). The results reveal that both CA and cyanamide contribute to the formation of G-CDs. Furthermore, we performed the dialysis of the product synthesized by the proposed method against water using a dialysis bag with molecular weight cutoff (MWCO) of 1000 Da (Figs. S29 and S30 in Supporting information). A main component of G-CDs in the bag was obtained, accompany by some impurity of blue and green fluorescent molecules in the dialysate, confirmed by silica chromatography (Fig. S31 in Supporting information). These preliminary results combined with those for structural and optical characterizations above, imply that G-CDs are composed of nitrogen-doped graphitic carbon core surface-functionalized with abundant molecular fluorophores might dominantly contributing to strong green fluorescence [41–44,53].
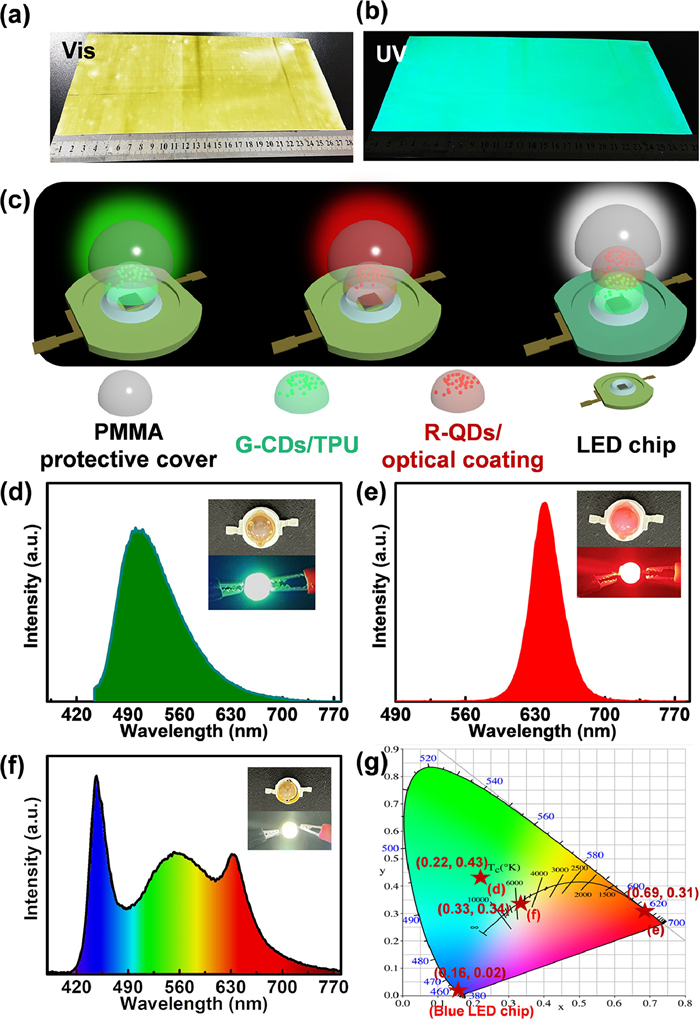
The use of G-CDs as green fluorescent color-converting materials was explored (Fig. 3). The G-CDs possessing PL emission at 521 nm could be utilized to prepare green color-converting materials. With the merit of rich surface functionalization, G-CDs could be well incorporated into polymer matrix, and hence a brightly fluorescent G-CDs/thermoplastic polyurethane (TPU) film was fabricated with the assistance of a coating machine (Fig. S32 in Supporting information). Fig. 3a shows that G-CDs/TPU solution exhibits good film-forming performance, and the prepared G-CDs/TPU film is able to emit strong green fluorescence under 365 nm UV light (Fig. 3b). Then G-CDs/TPU composites were produced and applied to construct green LEDs and white LEDs. For this purpose, CdSe/ZnS nanocrystal with the emission wavelength of 640 nm (R-QDs) as red fluorescence conversion materials for white LEDs were also prepared (Fig. S33 in Supporting information) [54]. The structures of green, red, and white LEDs are shown in Fig. 3c, composed of a blue LED chip (420 nm for green and red LEDs, 450 nm for white LED) coated with fluorescent composite materials, and a PMMA protective cover. Figs. 3d and e show the emission spectra of the green and red LEDs, with a peak at 517 nm and 640 nm, respectively. Insets in Figs. 3d and e show the photographs of the green and red LEDs under light-off and light-on states, and they could emit green and red light, respectively. Fig. 3f shows the emission spectrum of a white LED, covering most of the visible-light region from 400 nm to 770 nm. The Commission Internationale de l'Eclairage (CIE) color coordinates of green and red LED are (0.22, 0.43) and (0.69, 0.31) (Fig. 3g), respectively. The CIE color coordinates of white LED are (0.33, 0.34), very close to the coordinates of balanced white-light emission (0.33, 0.33). The correlated color temperature (CCT) and color rendering index (CRI) of the white LED are 5404 K and 92, respectively, close to the natural sun light [27]. Therefore, these G-CDs/TPU composite materials might be useful as green phosphors for white LEDs.

|
Download:
|
| Fig. 3. Filming of G-CDs and their application in lighting. Digital photographs of G-CDs/TPU films taken under (a) daylight and (b) 365 nm UV light. (c) Structure diagrams of green, red, and white LED lamps. Emission spectra of (d) green, (e) red, and (f) white LEDs. Insets: photographs of (d) green, (e) red, and (f) white LED lamps at light-off and -on state. (g) The CIE color coordinates of green, red and white LEDs, and blue LED chip (450 nm). | |
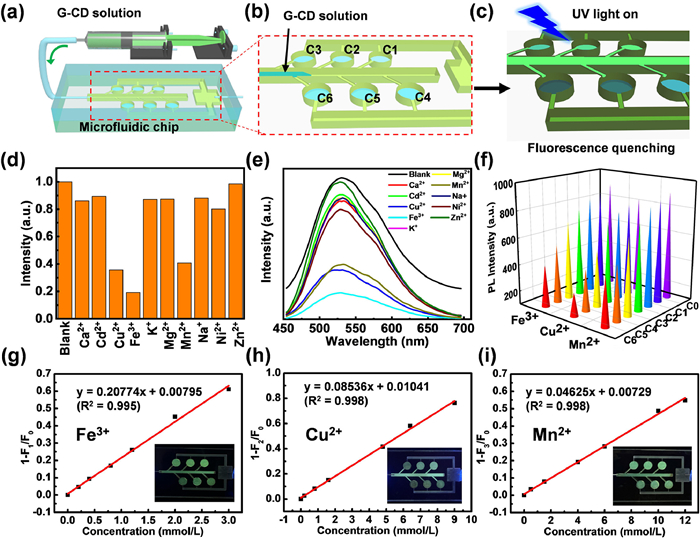
Finally, we investigated the potential of G-CDs for metal ion detection. CDs could be useful for sensing owing to their surface functionalization that allows CDs to give fluorescence response to external stimuli [55]. As such, various metal ion sensor candidates based on CDs have also been developed [56]. Here, we designed a visual microfluidic detection platform using G-CDs as fluorescent probes, to realize synchronized testing of multiple samples for the first time, through which rapid detection of Fe3+, Cu2+, and Mn2+ metal ions were achieved (Fig. 4). The schematic construction of the microfluidic detection platform and its detection operation are shown in Figs. 4a–c. Specifically, aqueous solutions of metal ions with different concentrations were firstly put into six sample pools of the microfluidic chip, and then sealed with a removable PMMA cover, followed by the injection of an aqueous solution of G-CDs into the chip by an injection pump (Fig. 4b). Different sample pools with different concentration of metal ions (expressed as C1, C2, C3, C4, C5, C6 with the concentration increase) could show different intensity of fluorescence under 365 nm UV light after the injection completed (Fig. 4c), and the fluorescence intensities could be measured. This provides a rapid testing for metal ions based on this microfluidic chip detection platform. As presented in Figs. 4d and e, the response degree of the G-CD solution to 10 metal ions was detected. Compared with other metal ions, Fe3+, Cu2+ and Mn2+ have a more obvious quenching effect. The PL intensity of G-CDs uniformly decreased with the increase of concentration of Fe3+ (from 0 to 3 mmol/L), Cu2+ (from 0 to 9 mmol/L) and Mn2+ (from 0 to 12 mmol/L) (Fig. 4f and Figs. S34–S36 in Supporting information). We found that the intensity and position of the absorption peak of G-CDs were almost unchanged after the addition of Fe3+, Cu2+, and Mn2+ (Fig. S37 in Supporting information). Based on the absorption spectra results and previous studies, the quenching mechanism might be attributed to the result of the synergy of several mechanisms, such as complex formation, light-induced electron transfer, ion binding [57]. The photographs of the microfluidic chip detection platform of Fe3+, Cu2+, and Mn2+ under daylight and UV light are shown in Fig. S38 in Supporting information and the insets in Figs. 4g–i, respectively. Aqueous solutions of metal ions with different concentration in six sample pools (C1 to C6) are almost indistinguishable under natural light, but can be immediately distinguished according to the quenching effect of G-CDs under 365 nm UV light. The effect of the concentration of Fe3+, Cu2+, and Mn2+ on the intensities of PL peaks was thoroughly studied. As can be seen in the Stern–Volmer plots [58] in Figs. 4g–i, a good linear relationship can be seen between the 1 – Fsample/F0 (F0 represents the fluorescence intensity of blank sample, and Fsample represents the fluorescence intensity of G-CDs after mixed with different concentrations of metal ions) and the concentration of metal ions. The limit of detections (LOD) were 67, 164, and 302 µmol/L with a good correlation coefficient (R2) of 0.995, 0.998, 0.998 for Fe3+, Cu2+, and Mn2+, respectively. The responses were all completed within a few seconds, realizing the sensitive rapid detection of metal ions. The microfluidic chip is not only small, portable, visual, and reusable, but also easy to operate, simultaneous, rapid, intuitive, and good correlation. More importantly, it can realize simultaneous-rapid testing of multiple samples. Due to the large specific surface area of the microchannel of the chip, G-CDs and metal ions can mix and contact sufficiently. Also, the change of fluorescence intensity can be obviously observed by this visualization chip, which can realize the efficient detection of samples with different concentrations. Nevertheless, continuous effort is required for simultaneously distinguishing these metal ions coexisting in a single sample.

|
Download:
|
| Fig. 4. Fluorescence sensing of G-CDs towards metal ions based on microfluidic platform. Schematic illustrations of (a) a microfluidic chip used for metal ion detection, (b) the six sample pools of the microfluidic chip filled with different concentrations of aqueous solutions of metal ions (C1, C2, C3, C4, C5, C6), and (c) PL response towards metal ions upon the injection of an aqueous solution of G-CDs into the microfluidic chip. Comparison of PL intensities (d) and PL spectra (e) of G-CDs after the addition of different metal ions. (f) Pattern of PL spectra of G-CDs in presence of metal ions of Fe3+, Cu2+, and Mn2+ with different concentrations (C0–C6). Linear plots of 1 − Fsample/F0 value of PL intensities of G-CDs versus (g) Fe3+, (h) Cu2+ and (i) Mn2+ concentrations. Insets show the corresponding photographs of the microfluidic chip with different concentrations of metal ion solutions after the injection of G-CDs taken under UV light. | |
In summary, we demonstrated an efficient synthesis method for high-performance carbon dots, without requiring any organic solvents, complex operations, high-pressure reactors, or expensive instruments. Carbon dots with green fluorescence, G-CDs, were prepared by simply heating the homogeneous precursors of citric acid and cyanamide in an open vessel. Optical properties and structural characterizations of G-CDs were fully performed. G-CDs have a relatively stable emission at 521 nm with PL QY up to 73%, and have rich surface functionalization with hydroxyl, amino, and carboxyl groups. Taking advantage of high fluorescence of G-CDs and their good compatibility with polymer matrix, green color-converting materials could be available. Then we constructed a white LED possessing good performance including CIE coordinates of (0.33, 0.34), CRI of 92 and CCT of 5404, close to that of natural sun light. Furthermore, G-CDs were used as fluorescent probes for quantitative detection of Fe3+, Cu2+, and Mn2+ metal ions based on a visual, small, and portable microfluidic detection platform, which realized simultaneous-rapid testing of multiple samples. Over all, this study provided us an idea for the development and preparation methods of high-performance CDs with various optical applications.
Declaration of competing interestThe authors declare that they have no known competing financial interests or personal relationships that could have appeared to influence the work reported in this paper.
AcknowledgmentsThis work was supported by National Natural Science Foundation of China (Nos. 21736006 and 21978132), National Key Research and Development Program of China (No. 2022YFC2104600), and Priority Academic Program Development of Jiangsu Higher Education Institutions (PAPD).
Supplementary materialsSupplementary material associated with this article can be found, in the online version, at doi:10.1016/j.cclet.2023.108481.
| [1] |
S.Y. Lim, W. Shen, Z. Gao, Chem. Soc. Rev. 44 (2015) 362-381. DOI:10.1039/C4CS00269E |
| [2] |
Y. Zhou, D. Benetti, X. Tong, et al., Nano Energy 44 (2018) 378-387. DOI:10.1016/j.nanoen.2017.12.017 |
| [3] |
S.N. Baker, G.A. Baker, Angew. Chem. Int. Ed. 49 (2010) 6726-6744. DOI:10.1002/anie.200906623 |
| [4] |
D. Li, P. Jing, L. Sun, et al., Adv. Mater. 30 (2018) 1705913. DOI:10.1002/adma.201705913 |
| [5] |
S. Lu, L. Sui, J. Liu, et al., Adv. Mater. 29 (2017) 1603443. DOI:10.1002/adma.201603443 |
| [6] |
S. Liu, J. Tian, L. Wang, et al., Adv. Mater. 24 (2012) 2037-2041. DOI:10.1002/adma.201200164 |
| [7] |
L. Vallan, E.P. Urriolabeitia, F. Ruipérez, et al., J. Am. Chem. Soc. 140 (2018) 12862-12869. DOI:10.1021/jacs.8b06051 |
| [8] |
B. Devadas, T. Imae, ACS Sustain. Chem. Eng. 6 (2017) 127-134. |
| [9] |
F. Yuan, T. Yuan, L. Sui, et al., Nat. Commun. 9 (2018) 2249. DOI:10.1038/s41467-018-04635-5 |
| [10] |
X. Yang, X. Li, B. Wang, et al., Chin. Chem. Lett. 33 (2022) 613-625. DOI:10.1016/j.cclet.2021.08.077 |
| [11] |
Y.P. Sun, B. Zhou, Y. Lin, et al., J. Am. Chem. Soc. 128 (2006) 7756-7757. DOI:10.1021/ja062677d |
| [12] |
J. Verduyckt, A. Geers, B. Claes, et al., Green Chem. 19 (2017) 4642-4650. DOI:10.1039/C7GC01773A |
| [13] |
L. Cao, X. Wang, M.J. Meziani, et al., J. Am. Chem. Soc. 129 (2007) 11318-11319. DOI:10.1021/ja073527l |
| [14] |
X.Y. Du, C.F. Wang, G. Wu, S. Chen, Angew. Chem. Int. Ed. 60 (2020) 8585-8595. |
| [15] |
X.Y. Xu, R. Ray, Y.L. Gu, et al., J. Am. Chem. Soc. 126 (2004) 12736-12737. DOI:10.1021/ja040082h |
| [16] |
L. Zheng, Y. Chi, Y. Dong, J. Lin, B. Wang, J. Am. Chem. Soc. 131 (2009) 4564-4565. DOI:10.1021/ja809073f |
| [17] |
S. Zhu, Q. Meng, L. Wang, et al., Angew. Chem. Int. Ed. 52 (2013) 3953-3957. DOI:10.1002/anie.201300519 |
| [18] |
X. Yan, X. Cui, B. Li, L.S. Li, Nano Lett. 10 (2010) 1869-1873. DOI:10.1021/nl101060h |
| [19] |
H. Liu, T. Ye, C. Mao, Angew. Chem. Int. Ed. 46 (2007) 6473-6475. DOI:10.1002/anie.200701271 |
| [20] |
D. Pan, J. Zhang, Z. Li, M. Wu, Adv. Mater. 22 (2010) 734-738. DOI:10.1002/adma.200902825 |
| [21] |
H. Ding, J.S. Wei, P. Zhang, et al., Small 14 (2018) 1800612. DOI:10.1002/smll.201800612 |
| [22] |
J.Z. Guo, H. Li, L.T. Ling, et al., ACS Sustain. Chem. Eng. 8 (2020) 1566-1572. DOI:10.1021/acssuschemeng.9b06267 |
| [23] |
L.T. Ling, Z.J. Zhu, H.X. Shen, et al., Ind. Eng. Chem. Res. 59 (2020) 4968-4976. DOI:10.1021/acs.iecr.9b06833 |
| [24] |
D. Zhou, P. Jing, Y. Wang, et al., Nanoscale Horiz. 4 (2019) 388-395. DOI:10.1039/C8NH00247A |
| [25] |
G. Sonmez, F. Wudl, J. Mater. Chem. 15 (2005) 20-22. DOI:10.1039/b412513d |
| [26] |
J.H. Han, D. Kim, T.W. Lee, et al., ACS Photonics 5 (2018) 3322-3330. DOI:10.1021/acsphotonics.8b00540 |
| [27] |
X. Miao, D. Qu, D. Yang, et al., Adv. Mater. 30 (2018) 1704740. DOI:10.1002/adma.201704740 |
| [28] |
G.E. LeCroy, S.K. Sonkar, F. Yang, et al., ACS Nano 8 (2014) 4522-4529. DOI:10.1021/nn406628s |
| [29] |
M.P. Ajith, S. Pardhiya, P. Rajamani, Small 18 (2022) 2105579. DOI:10.1002/smll.202105579 |
| [30] |
S. Zhu, J. Zhang, C. Qiao, et al., Chem. Commun. 47 (2011) 6858-6860. DOI:10.1039/c1cc11122a |
| [31] |
S. Qu, X. Wang, Q. Lu, X. Liu, L. Wang, Angew. Chem. Int. Ed. 51 (2012) 12215-12218. DOI:10.1002/anie.201206791 |
| [32] |
J. Gu, M.J. Hu, Q.Q. Guo, et al., RSC Adv. 4 (2014) 50141-50144. DOI:10.1039/C4RA10011E |
| [33] |
K. Jiang, S. Sun, L. Zhang, et al., Angew. Chem. Int. Ed. 54 (2015) 5360-5363. DOI:10.1002/anie.201501193 |
| [34] |
F. Li, Y. Li, X. Yang, et al., Angew. Chem. Int. Ed. 57 (2018) 2377-2382. DOI:10.1002/anie.201712453 |
| [35] |
B. Yuan, S. Guan, X. Sun, et al., ACS Appl. Mater. Interfaces 10 (2018) 16005-16014. DOI:10.1021/acsami.8b02379 |
| [36] |
H. Zhao, G. Liu, S. You, et al., Energy Environ. Sci. 14 (2021) 396-406. DOI:10.1039/D0EE02235G |
| [37] |
T.J. Li, T.B. Brill, Chin. Sci. Bull. 43 (1998) 1395-1399. DOI:10.1007/BF02883691 |
| [38] |
L. Ai, Y. Yang, B. Wang, et al., Sci. Bull. 66 (2021) 839-856. DOI:10.1016/j.scib.2020.12.015 |
| [39] |
S. Li, L. Li, H. Tu, et al., Mater. Today 51 (2021) 188-207. DOI:10.1016/j.mattod.2021.07.028 |
| [40] |
B.C.M. Martindale, G.A.M. Hutton, C.A. Caputo, E. Reisner, J. Am. Chem. Soc. 137 (2015) 6018-6025. DOI:10.1021/jacs.5b01650 |
| [41] |
D. Qu, Z. Sun, Mater. Chem. Front. 4 (2020) 400-420. DOI:10.1039/C9QM00552H |
| [42] |
W. Kasprzyk, T. Swiergosz, S. Bednarz, et al., Nanoscale 10 (2018) 13889-13894. DOI:10.1039/C8NR03602K |
| [43] |
T. Zhang, J. Zhu, Y. Zhai, et al., Nanoscale 9 (2017) 13042-13051. DOI:10.1039/C7NR03570E |
| [44] |
B. Wang, G.I.N. Waterhouse, S. Lu, Trends Chem. 5 (2023) 76-87. DOI:10.1016/j.trechm.2022.10.005 |
| [45] |
F. Liu, M.H. Jang, H.D. Ha, et al., Adv. Mater. 25 (2013) 3657-3662. DOI:10.1002/adma.201300233 |
| [46] |
S. Zhu, J. Shao, Y. Song, et al., Nanoscale 7 (2015) 7927-7933. DOI:10.1039/C5NR01178G |
| [47] |
S. Qu, D. Zhou, D. Li, et al., Adv. Mater. 28 (2016) 3516-3521. DOI:10.1002/adma.201504891 |
| [48] |
F. Yuan, Z. Wang, X. Li, et al., Adv. Mater. 29 (2017) 1604436. DOI:10.1002/adma.201604436 |
| [49] |
Y. Song, S. Zhu, S. Xiang, et al., Nanoscale 6 (2014) 4676-4682. DOI:10.1039/c4nr00029c |
| [50] |
Z. Wei, B. Wang, M. Xie, et al., Chin. Chem. Lett. 33 (2022) 751-756. DOI:10.1016/j.cclet.2021.08.014 |
| [51] |
J. Guo, Y. Lu, A.Q. Xie, et al., Adv. Funct. Mater. 32 (2022) 2110393. DOI:10.1002/adfm.202110393 |
| [52] |
V. Strauss, H.Z. Wang, S. Delacroix, M. Ledendecker, P. Wessig, Chem. Sci. 11 (2020) 8256-8266. DOI:10.1039/D0SC01605E |
| [53] |
B. Wang, Z. Wei, L. Sui, et al., Light Sci. Appl. 11 (2022) 172. DOI:10.1038/s41377-022-00865-x |
| [54] |
R. Cheng, K. Ma, H.G. Ye, et al., J. Mater. Chem. C 8 (2020) 6358-6363. DOI:10.1039/D0TC00305K |
| [55] |
C. Long, Z. Jiang, J. Shangguan, et al., Chem. Eng. J. 406 (2021) 126848. DOI:10.1016/j.cej.2020.126848 |
| [56] |
S. Yang, J. Sun, X. Li, et al., J. Mater. Chem. A 2 (2014) 8660-8667. DOI:10.1039/c4ta00860j |
| [57] |
M. Batool, H.M. Junaid, S. Tabassum, et al., Crit. Rev. Anal. Chem. 52 (2022) 756-767. DOI:10.1080/10408347.2020.1824117 |
| [58] |
G. Li, H. Li, J. Zhai, et al., RSC Adv. 12 (2022) 8485-8491. DOI:10.1039/D2RA00626J |