 2024, Vol. 35


b Biomedical Pioneering Innovation Center, Peking University, Beijing 100871, China
Analyses of the covalent structures, including protein sequence and post-translational modification (PTM) are essential for not only structural and functional studies of proteins, but also monitoring the quality attributes of biologics such as sequence variants and PTM profiles. As a technique that can directly measure the mass or mass changes of biomolecules or their fragments, mass spectrometry (MS) has become an indispensable tool for analyzing covalent structure of proteins [1]. For the task of protein sequencing, it has complemented and largely replaced Edman degradation due to the higher sequence coverage, sensitivity, resolution and throughput [2], even in the presence of excess background proteins [3]. MS-based approaches also enable direct analyses of both sequence variants and PTM, which cannot be decoded by nucleic acid sequencing [4,5], and allow confirmation of protein sequence to be consistent with the presumed ones (e.g., the cDNA sequence) by comparing the masses of certain segments with the theoretical masses using more simple and less time-consuming approaches, such as intact mass measurements and peptide mapping [1].
Identification of amino acid residues and their PTM's at specific sites by mass spectrometry relies on accurate mass determination of fragments released from the intact proteins. Fragmentation can be performed in solution through enzymatic digestion (i.e., the bottom-up approach), or in the gas phase at the tandem MS stage using proper ion activation/dissociation techniques (i.e., the top-down approach). Additional gas-phase fragmentation of these polypeptide fragments is needed when their sequences or PTM's need to be characterized with higher sequence resolution, ideally at the single-residue level. The sequence coverage is highly dependent on the nature of the ionization and fragmentation methods [6,7], and can be improved by combining the complementary sequence information derived from multiple fragmentation strategies [8,9]. Electrospray ionization (ESI) and matrix-assisted laser desorption/ionization (MALDI) are both capable of ionizing intact proteins or peptides. In contrast to ESI, MALDI predominantly generates singly charged ions of intact species upon initial ionization and singly charged fragment ions in tandem MS, whose m/z values are numerically equal to their masses. This feature greatly reduces the complexity of the tandem mass spectra, minimizes signal overlapping, and provides a straightforward means to interpret data. MALDI is compatible with both TOF/TOF, a tandem MS mode utilizing collision-induced dissociation (CID), and in-source decay (ISD), a type of radical-induced fragmentation that takes place in the MALDI plume during the desorption/ionization and cleaves nearly every N-αC bond (except that in Pro; a/x ions may also be produced under oxidative conditions [10]) at the terminal segments of proteins [11-15], allowing nearly single-residue resolution to be achieved [16] even for disulfide-containing proteins [17]. Both TOF/TOF and ISD have been demonstrated as powerful tools for top-down analysis of proteins, including antibodies and disulfide-linked proteins [8,15,18-20]. TOF/TOF of ISD-derived fragment ions enables analysis of protein termini in a pseudo-MS3 manner [16,21], yielding nearly complete sequence coverage of small proteins [22].
No matter whether the residues/PTM's are identified by peak list mapping or de novo sequencing, mass accuracy is pivotal to reliable identification. Due to the intrinsically small mass differences between certain amino acid residues, their combinations or their modified formats, a slight mass error caused by suboptimal calibration of mass spectrometers can result in ambiguous or misleading results. Although a number of standard proteins, peptides, ion clusters [23,24], synthetic polymers [25,26] and biopolymers [27,28] have been utilized for calibrating the MALDI-MS-based mass measurements, some of their limitations, including differential degradation between components of a calibrant mixture and limited compatibility with commonly used matrices [23] or internal calibration, should be addressed. Internal calibration circumvents the mass inaccuracy problem in external calibration caused by the inconsistency in surface and crystal conditions between sample points of the analytes and calibrants [29], but it suffers from interference and suppression of analyte signals by the calibrant ions. Performing internal calibration using evenly spaced signals of from synthetic calibrants [25,26] provides a solution. For TOF/TOF, evenly spaced signals can be generated by fragmenting molecules containing repeating unit, such as oligosaccharides [30], polyalanine peptides [31] and proteins containing regularly positioned Asp residues [32]. However, regulated fragmentation in ISD still needs further development. TOF/TOF usually requires multiple sets of calibration to cover a broad mass range, and calibration at high mass range (> 3000 Da) or in the negative mode is relatively difficult because of the lack of appropriate calibrants [31,32]. In addition, the versatility of existing calibrants in different polarity modes or fragmentation modes, and their applicability to a larger variety of analyte systems are still limited. Here we design a synthetic peptide-based calibrant to enable versatile MALDI-MS calibration for ISD, TOF/TOF and pseudo-MS3, in both positive and negative modes, either externally or internally.
In order to minimize the interference and suppression of the analyte signals, this calibrant is designed as a single peptide entity, which efficiently provides a set of highly regulated calibrant signals with even spacing across a defined mass range upon fragmentation. Taking account of the fact that ISD and TOF/TOF predominantly produces c/z type ions and b/y type ions respectively [13,15] and the dependence of cleavage preference on amino acid sequence [33,34], we introduced four types of amino acid residues in the sequences of the calibrants. Type I residues were selected from the residue combinations favoring N-αC cleavage in ISD, such as Xxx1–Xxx2Pro, Xxx-Asp, Xxx-Asn and Gly-Xxx (Xxx = any amino acid except Pro) [33]. Type II residues were selected based on the so-called aspartic acid effect in MALDI-TOF/TOF, i.e. preferential cleavages at the C-terminal side of acidic residues Asp and Glu [20,35]. Type III residues are those inert to fragmentation. They were introduced as spacers to regulate the spacing between the calibrant ion signals in spectra. Since the cyclic side chain of Pro covalently links the dissociation products of N-αC cleavage between any preceding residue and Pro in ISD, and the C′–N cleavage at a Pro is not favored in TOF/TOF, a defined number of repeating Pro residues can serve as the Type III residues. Basic residues (Type IV) were placed at the N-terminus as the protonation sites [36] to ensure efficient ionization of the intact peptide in the positive ion mode and preferential charging of the N-terminal fragments. Acidic residues should be used as Type IV residues for the negative ion mode. Based on the above considerations, we selected a combo of amino acid sequence -Gly-Asp-Pron- (-GDPn-) as the repeating unit in the frame of the peptide calibrant, and used Rx[GDPn]m (referred to as "GDP") as the sequence template for the prototype synthetic peptide calibrant. The expected fragmentation sites are between Gly-Asp in ISD and between Asp-Pro in TOF/TOF (Fig. 1A). The expected spacing between every two adjacent signal peaks corresponding to the calibrant fragment ions is defined by the exact mass of each repeating unit [GDPn], which is 172.14 + 97.12 × n Da (Fig. 1B). The evenly spaced signals of GDP fragments contrast with the signals given rise by conventional calibrants consisting of natural molecules. The spacing can be adjusted by changing the number of Pro residues in the repeating unit (n), and the mass range covered by these fragment peaks can be adjusted by changing the number of repeating units (m) on demand.

|
Download:
|
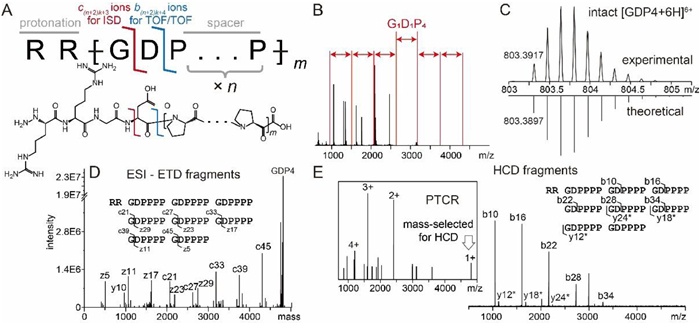
| Fig. 1. (A) Schematics of sequence, structure and functional sites of the synthetic peptide GDP. (B) Desired signal pattern of fragment ions of a GDP4 peptide (red), overlaid with the observed signals of Peptide Standard II (black). (C) Comparison of detected (top) and simulated (bottom) isotopic profiles of [GDP4]6+. (D) Deconvoluted tandem mass spectrum showing ETD fragments of [GDP4]6+. (E) Tandem mass spectrum showing HCD fragments of [GDP4]+, which was produced through PTCR (inset). y* in the labels represents y-H2O ions. The GDP4 sequence are labeled with fragmentation sites detected in ETD and HCD, respectively. | |
The performance of GDP calibrant was demonstrated using a representative entity RR[GDP4]8 (GDP4). The theoretical masses of expected fragments from GDP4 in ISD and TOF/TOF are listed in Table S1 (Supporting information). To verify the sequence accuracy and fragmentation preference, we conducted ultra-high-resolution MS and electron-transfer dissociation (ETD)- and higher-energy collision dissociation (HCD)-based MS/MS analysis of GDP4 ions generated by ESI. Both the measured mass and isotopic distribution pattern of intact GDP4 agree with the theoretical ones (Fig. 1C). The fragmentation pattern was in line with expectation as well. The predominant ETD fragments were products of N-αC-bond cleavages between Gly and Asp in the repeating units, i.e., c and z type fragment ions c6k+3 and z6k+5 (c'/z' and c•/z• ions are both referred to as c/z type ions in this work for simplicity. See Supporting information for nomenclature and annotation details), where k is the number of the repeating units (ranging from 0 to 7 in GDP4) (Fig. 1D). Due to the similarity in cleavage preference between ETD and ISD, these fragments are expected to be detected in MALDI-ISD in format of singly charged ions. To mimic the TOF/TOF fragmentation in MALDI-MS, we performed HCD of [GPD4]+ that was reduced from [GPD4]5+ using PTCR (Fig. 1E). C′–N bonds between Asp and Pro in each repeating unit of GDP4 were extensively cleaved and equally spaced signals representing b6k+4 ions were observed (Fig. 1E). This preferential cleavage agrees with the reported Asp effect [15]. Only a few low abundant C-terminal fragments in format of y6k-H2O ions were detected. The preferential production of N-terminal fragments (b ions) verifies that the basic N-terminus of GDP4 serves as the charge carrier for both precursor and fragment ions as designed. When calibrant signals should be shifted to avoid signal interference in internal calibration, or a different mass range is needed, a RR[GDPn]m peptide with different n or m values can be used. For example, RR[GDP3]7 (GDP3) provides a narrower mass range and narrower signal spacing than GDP4 (see Table S2 in Supporting information for the theoretical masses of its fragments and Fig. S1 in Supporting information for its characterization).
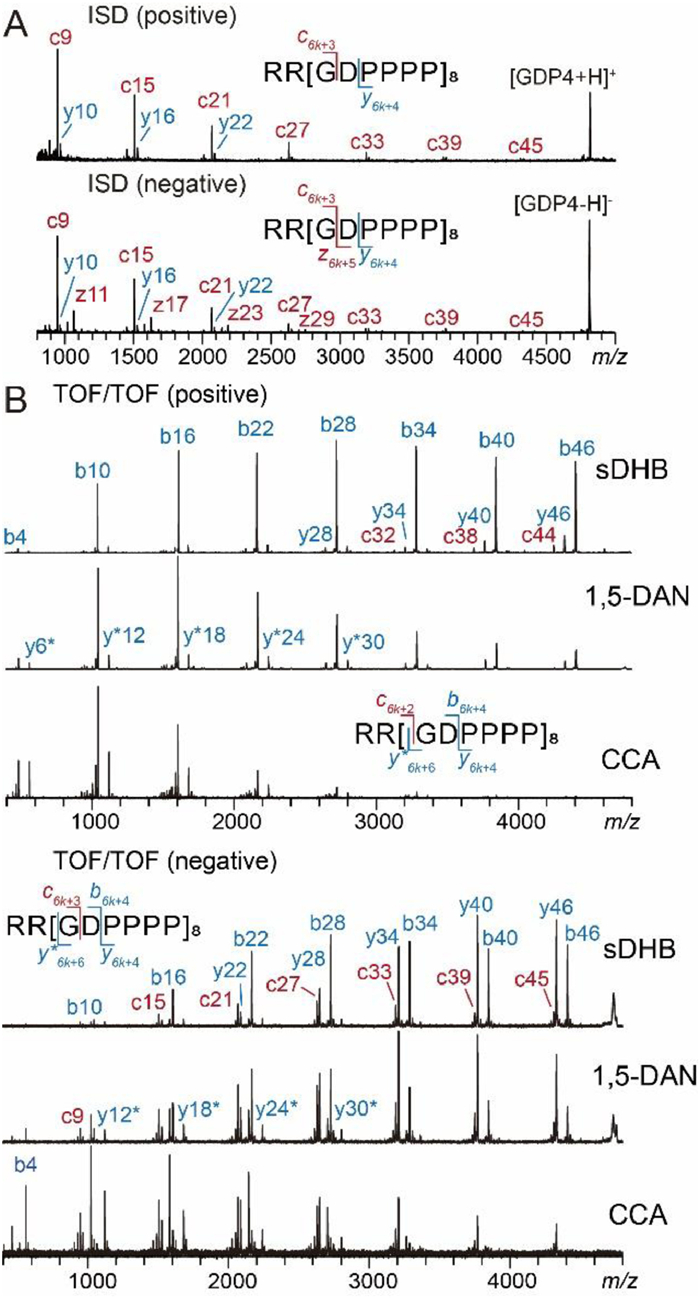
In MALDI-ISD of GDP4 in the positive ion mode, c6k+3 (k = 1~7) ions were produced and gave rise to equally spaced signals with adequate S/N (Fig. 2A). The spacing between adjacent c ion signals is 561 Da, agreeing with the mass of the repeating unit [GDPPPP]. Due to the lack of protonation site at the C-terminus of the singly charged precursor GDP4 ion, z ions were not observed. In the negative mode, z6k+5 ions were detected in addition to the c6k+3 ion series (Fig. 2A), because either the C-terminal carboxylic acid group or a Glu residue can serve as the negative charge carrier through deprotonation. Such highly regulated fragmentation patterns, which are independent of laser energy (Fig. S2 in Supporting information), promise minimal interference with analyte signals in internal calibration. In MALDI TOF/TOF, precursor ions from different matrices are excited to different electronic states, leading to matrix-dependent selective fragmentations (MDSF) [37,38], which was attributed to matrix-dependent redistribution of either excited electrons or internal energy in the analyte molecules during the MALDI process. To assess the versatility of GDP, we compared its TOF/TOF fragments in measurements using three matrices, i.e., super-2,5-dihydroxybenzoic acid (sDHB), 1,5-diaminonaphthalene (1,5-DAN) and α-cyano-4-hydroxycinnamic acid (CCA). In the positive mode, all expected b ions resulting from Asp-Pro cleavages, i.e., b6k+4 (k = 0~7) covering a m/z range up to 4407 were detected at high abundances with all three matrices, while the average fragment size decreases in an order from sDHB to CCA (Fig. 2B, up). The signal spacing was 561 Da as well. Only a subset of y6k+4 and y6k-H2O ion at modest abundances were detected. A few low-abundant c6k+2 ions resulting from Pro-Gly cleavage were observed with sDHB. Likewise, GDP3 produced b5k+4 (k = 0~6) ions in MALDI-TOF/TOF, which feature a shorter signal spacing (463 Da) and a narrower m/z range (485–3264) (Fig. S3 in Supporting information). GDP3 also exhibited a similar MDSF trend to GDP4 (Fig. S3). In contrast to the signal patterns of natural calibrant mixtures that are difficult to regulate, the monomodal-like intensity distribution GDP fragment series allows more straightforward weight evaluation for individual calibrant signals and selection of more reliable data points.

|
Download:
|
| Fig. 2. (A) MALDI-ISD mass spectra of GDP4 acquired in the positive (up) and negative (bottom) ion modes using 1,5-DAN as the matrix. (B) MALDI-TOF/TOF spectra of GDP4 acquired in the positive (up) and negative (bottom) ion modes using sDHB, 1,5-DAN and CCA as matrices. y* denotes the y-H2O ions. | |
The negative mode of MALDI-TOF/TOF is particularly useful for characterization of biomolecules such as neutral glycans [39,40], glycans of glycoproteins [41,42], glycopeptides [43] and acidic peptides [44]. However, calibration in the negative mode over a high mass range (> 3000 Da) is more difficult than that in the positive mode [45] due to the lack of proper standards [31]. GDP produces abundant negatively charged fragments (b6k+4 ions from GDP4, or b5k+4 from GDP3), allowing convenient negative mode calibration (Fig. 2B, bottom and Fig. S4 in Supporting information). Compared with the fragmentation pattern in the positive mode, y6k+4/y6k-H2O ions (from GDP4) and y5k+3/y5k-H2O ions (from GDP3) were detected at significantly higher abundances in the negative mode, because the acidic Asp can serve as an efficient charge carrier for these C-terminal fragments through deprotonation. The intensities of y ions even exceeded those of b ions when CCA was used as the matrix. The dependence of detected sizes of fragment ions on the matrices observed in the negative mode is similar to that in the positive mode, i.e., sDHB and CCA favor detection of larger and smaller fragment ions, respectively.
We evaluated the performance of GDP in internal calibration in ISD of intact NISTmAb. ISD led to extensive N-terminal fragments from the heavy chain of NISTmAb (Fig. S5A in Supporting information). Most of these fragments belong to the c ion series, exhibiting a monotonically increasing trend of the mass errors vs. measured masses following a standard external calibration procedure using commercial calibrants (Fig. S5B in Supporting information). Those fragments corresponding to the outliers of this trend were misidentified as a, y and z type ions using the vendor's default identification algorithm. Due to the relatively broader range of c ion mass errors (> 0.5 Da), the error tolerance range had to be set at wider than ±0.5 Da in this case, which did not rule out the misidentifications (Fig. S5B). Narrowing down the tolerance range was not beneficial because it also filtered out correct identifications. This effect is particularly detrimental for analyzing proteins with unknown sequence or modifications, or those whose ISD efficiency is not adequate to produce a fragment ladder as the error distribution reference. The measured masses from repeated measurements of the same sample exhibited high deviations (Figs. 3A and B and Fig. S6 in Supporting information), which were likely due to the heterogeneity and inconsistent surfaces of the matrix-analyte crystals formed on the target plate [29,46].

|
Download:
|
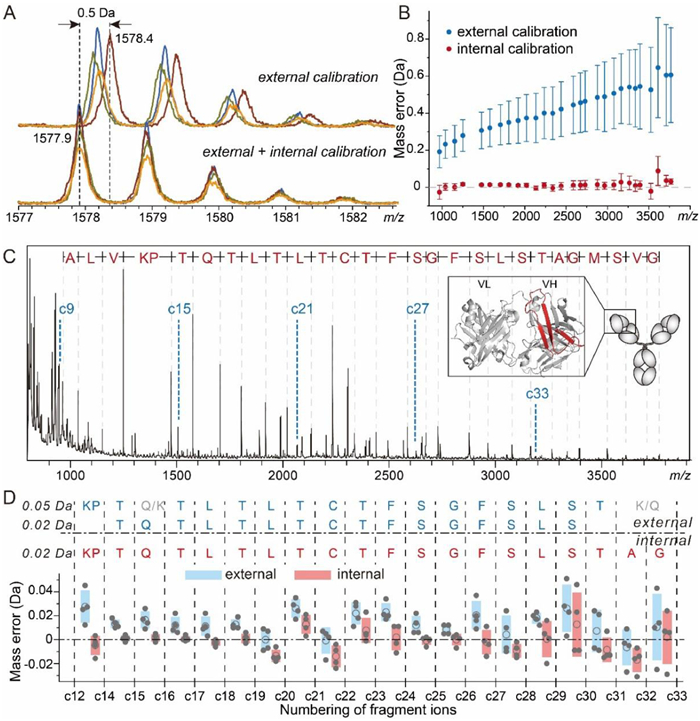
| Fig. 3. MALDI-ISD analysis of intact NISTmAb in the presence of GPD4. (A) Mass profiles of c15 ion of NISTmAb heavy chain acquired in four repeated measurements without (top) and with (bottom) internal calibration following a standard external calibration procedure. (B) Average mass errors of identified c-ions of NISTmAb heavy chain calculated before (blue) and after (red) internal calibration. The error bar represents standard deviation of four measurements. (C) Identification of fragment ions from intact NISTmAb. The internal calibrant ion signals from GDP4 are labeled with c6k+3 in blue. The red-colored portion of cartoon in the inset indicates the sequence coverage. (D) De novo sequencing of the N-terminus of NISTmAb heavy chain through ISD of intact mAb with internal calibration and external internal calibrations at different error tolerance settings. Plotted below the sequencing results are mass errors (closed circles), their mean values (circles) and standard deviations (colored boxes) corresponding to individual residues. | |
In contrast, internal calibration using c6k+3 ions resulting from GDP4, which was co-crystalized with the analytes and ionized under identical conditions, greatly improved both the accuracy and precision of the measured masses of NISTmAb fragments (Figs. 3A and B). Due to the concern about the suppression of analyte signals by the calibrant ions [47], we optimized the mixing ratio of NISTmAb and GDP. A ratio of 1000:8 (m/m; GDP concentration: 33 ng/μL) ensured adequate calibrant signals while maintaining the spectra quality of NISTmAb fragments (Fig. S7 in Supporting information). The decreased range of mass error distribution allowed a lower error tolerance setting (Fig. S5C in Supporting information). With the tolerance decreased to ±0.1 Da, fragments were unambiguously identified as high-abundant successive c ions and a few low-abundant z ions (z15, z17, and z18) of the NISTmAb heavy chain, with no fragment misidentified (Fig. 3C). In a representative example shown in Fig. 3A, the mass discrepancy between measurements based on external and internal calibrations reached up to 0.5 Da, which made it difficult to distinguish residues whose mass differences are less than 1 Da, such as Leu/Ile vs. Asn, Asn vs. Asp, and Gln vs. Glu. This example illustrates the necessity of using internal calibration to minimize both error and deviation of measured masses.
De novo sequencing requires an even higher mass accuracy because it relies on matching the measured mass differences between adjacent fragment ions to theoretical masses of amino acid residues, instead of aligning detected fragments with a reference sequence. The mass error in de novo sequencing in this work is defined as the difference between measured and theoretical mass values of residues, i.e., mass differences between adjacent fragment ions. In sequencing of NISTmAb based on external calibration alone, ISD allowed identification of ca. 20 residues at the N-terminus. With the error tolerance set at higher than > 0.036 Da (e.g., 0.05 Da), assigning either Lys (128.1723) or Gln (128.1292 Da) to the 16th site resulted in the same scoring and ambiguous results (Fig. 3D). Decreasing the error tolerance to 0.02 Da helped to refine the sequencing result, though at the cost of shortening the segment that can be sequenced. In contrast, internal calibration using GDP allowed the error tolerance to be set at 0.02 Da and unambiguous sequencing for an even longer segment than external calibration with the 0.05 Da setting. In addition, what was formerly misidentified as Q32 (128.1292 Da)/K32 (128.1723 Da) were identified as the combination of A32 and G33 (128.1292 Da) due to recognition of the c32 ion signal, in agreement with the theoretical sequence. Internal calibration improved mass accuracy and precision for most residues (Fig. 3D; see Fig. S8 in Supporting information for the spectra), thereby allowing a lower tolerance setting which benefits the reliability and sequencing depth.
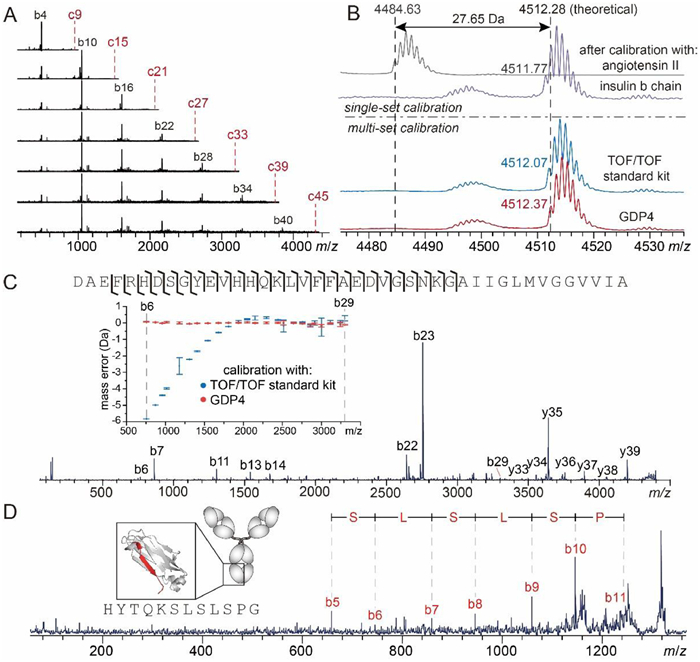
Calibration for MALDI-TOF/TOF differs from that for MS1 or ISD in two respects. First, the fragment mass accuracy is dependent on the precursor mass accuracy, especially when the theoretical precursor mass is unavailable. As exemplified in Fig. S9 (Supporting information), a 0.3 Da error of precursor mass can result in fragment mass errors at a level of ca. 0.2 Da. Second, because the calibration coefficient determined using fragments from a certain precursor is only valid over a relatively narrow range covered by those fragments, reliable calibration often requires multi-set calibrations using multiple precursors to provide coefficients that can cover a broad mass range. A single GDP peptide entity can provide such multi-set calibrations in a pseudo-MS3 fashion, i.e., producing a series of ISD-induced c(2+n)k+3 ions of arithmetically increasing masses, which serve as a series of available calibrant precursors and each of them can subsequently produce secondary calibrant ions that cover different mass ranges in TOF/TOF. As illustrated by Fig. 4A, TOF/TOF of individually mass-selected c6k+3 (k = 1~7) ions from ISD of GDP4 produced multiple sets of b6j+4 (j = 0~6) fragments. It is difficult for a natural protein or peptide to produce such fragments, especially those covering high mass ranges, due to their non-optimized fragmentation efficiency and cleavage site preference (Fig. S10 in Supporting information). The GDP3 peptide generated similar pseudo-MS3 pattern with a smaller signal spacing (Fig. S11 in Supporting information). In TOF/TOF of Aβ-42 peptide, a precursor mass error higher than 27 Da was observed upon a single-set calibration using angiotensin II; this error could be reduced to 0.5 Da when calibrated with insulin b chain, whose mass is more closed to the analyte, and further reduced to less than 0.2 Da after multi-set calibrations using either the commercial peptide calibration standard mixture or GDP4 (Fig. 4B). For all detected fragments, MS3-based multi-set calibrations using GDP provided high accuracy (errors less than 0.2 Da) and precision (standard deviations less than 0.2 Da) across the range of 750–3300 m/z, in contrast to multi-set calibrations using TOF/TOF standard kit where the mass errors are highly mass-dependent and reached up to 5 Da (Fig. 4C). The improved mass accuracy allowed single-residue resolution to be achieved for 62% of the Aβ−42 sequence (Fig. 4C).

|
Download:
|
| Fig. 4. (A) Pseudo-MS3 spectra of GDP4 showing TOF/TOF fragments of c6k+3 (k = 1~7) ions produced by ISD. The red dash lines indicate the m/z of the precursor ions, which were excluded in the acquisition range of TOF/TOF spectra. (B) Mass profiles of mass-selected Aβ−42 acquired in TOF/TOF mode without fragmentation, based on a single-set calibration using angiotensin II (gray) and insulin b chain (purple), and multi-set calibrations using peptide calibrant standard II (blue) and GDP4 (red), respectively. (C) TOF/TOF spectrum of Aβ−42 based on multi-set calibration using GDP4 and the sequence coverage. The inset shows the comparison of mass errors of detected TOF/TOF fragments based on calibrations using TOF/TOF standard kit and GDP4, respectively. The error bar indicates standard deviation of three measurements. (D) A representative pseudo-MS3 spectra of the intact NISTmAb, which revealed the sequence of a C-terminal segment of NISTmAb heavy chain (colored in red in the cartoon in the inset). The numbering of the secondary b ions in the labels are based on the length of their precursor segment produced by ISD. | |
The improved accuracy of TOF/TOF data also benefits sequence analysis of large proteins via pseudo-MS3. The sequence of C-terminal segment of NISTmAb heavy chain, which were not revealed in ISD mode due to lack of successive z ions, could be accessed through TOF/TOF of a C-terminal fragment produced at the prior ISD stage (Fig. 4D). The sequence resolution of a long polypeptide chain provided by TOF/TOF alone is often lower than ISD due to the higher fragmentation selectivity (such as Asp effect) of TOF/TOF. On the other hand, although higher fragmentation efficiency and sequence resolution can be achieved at the terminal portions of proteins using ISD alone, the interference with the short fragment (e.g., < 1000 Da) signals from the matrix cluster signals and the presence of Pro residue limit the sequence coverage by ISD. As illustrated by Fig. 4D, the pseudo-MS3 analysis allows efficient TOF/TOF fragmentation of mass-selected large ISD-fragments without interference from matrix related signals and regardless of the Pro contents, improving both sequence coverage and sequence resolution in analysis of large proteins.
Through rational design based on the peptide fragmentation rules and chemical natures of amino acids, we developed a versatile synthetic peptide format of calibrant, GDP. It produces highly regulated calibrant signals upon fragmentation, and can be used to improve both mass accuracy and precision in MALDI-MS1, ISD, TOF/TOF and pseudo-MS3 measurements, either internally or externally. The improved mass accuracy and precision allow lower error tolerance settings that benefit sequence coverage and resolution through either peak list matching or de novo sequencing. Its high ionization efficiency and fragmentation specificity provide minimal signal interference. Both the signal spacing and calibration range can be regulated through adjustment of the n and m values in the sequence template. Because all fragment signals used for calibration are produced from a single calibrant entity, mixing of multi-component or mixing-ratio optimization can be omitted, differential degradation between components of a calibrant mixture can be avoided, and signal suppression during ionization can be minimized. The presented strategy of rational calibrant design may also inspire further development of synthetic calibrants that benefit MS-based structural analysis of biomolecules.
NoteThe authors have filed a patent application (CN202111144624.7) based on the GDP calibrants. Shenzhen Bay Laboratory has approved the publication of this article.
Declaration of competing interestThe authors declare that they have no known competing financial interests or personal relationships that could have appeared to influence the work reported in this paper.
AcknowledgmentsThis work was supported by grants from the National Natural Science Foundation of China (No. 21974069) and Open Fund Programs of Shenzhen Bay Laboratory (No. SZBL2020090501001). The authors are grateful to the Multi-omics Mass Spectrometry Core of Shenzhen Bay Laboratory and Dr. Cookson Chiu for help with the experiments using the orbitrap Lumos mass spectrometer, and to Prof. Jiang Zhou, Dr. Wen Zhou (Analytical Instrument Center, Peking University) and Dr. Xinyang Shao (Peking-Tsinghua Center for Life Sciences, Peking University) for help with initial characterization of GDP peptides using a Fourier-transform ion cyclotron resonance (FTICR) mass spectrometer.
Supplementary materialsSupplementary material associated with this article can be found, in the online version, at doi:10.1016/j.cclet.2023.108685.
| [1] |
I.A. Kaltashov, S. Wang, G. Wang, Mass Spectrometry in Biopharmaceutical Analysis, De Gruyter, 2021.
|
| [2] |
M.M. Vecchi, Y. Xiao, D. Wen, Anal. Chem. 91 (2019) 13591-13600. DOI:10.1021/acs.analchem.9b02754 |
| [3] |
M. Mann, Clin. Chem. 62 (2016) 293-294. DOI:10.1373/clinchem.2014.237271 |
| [4] |
D.P. Donnelly, C.M. Rawlins, C.J. DeHart, et al., Nat. Methods 16 (2019) 587-594. DOI:10.1038/s41592-019-0457-0 |
| [5] |
L.M. Smith, N.L. Kelleher, The consortium for top down proteomics, Nat. Methods 10 (2013) 186-187. DOI:10.1038/nmeth.2369 |
| [6] |
L.A. Macias, I.C. Santos, J.S. Brodbelt, Anal. Chem. 92 (2020) 227-251. DOI:10.1021/acs.analchem.9b04859 |
| [7] |
Z.Y. Liu, Y. Jiang, C.L. Xiao, et al., Chin. Chem. Lett. 29 (2018) 694-698. DOI:10.1016/j.cclet.2017.10.020 |
| [8] |
K. Srzentic, L. Fornelli, Y.O. Tsybin, et al., J. Am. Soc. Mass Spectrom. 31 (2020) 1783-1802. DOI:10.1021/jasms.0c00036 |
| [9] |
H.F. Jiang, W.J. Chen, J. Wang, R.S. Zhang, Chin. Chem. Lett. 33 (2022) 80-88. DOI:10.1016/j.cclet.2021.06.011 |
| [10] |
L. Qiao, H. Bi, J.M. Busnel, et al., Chemistry (Easton) 15 (2009) 6711-6717. |
| [11] |
L. Zhan, X. Xie, Y. Li, et al., Anal. Chem. 90 (2018) 1525-1530. DOI:10.1021/acs.analchem.7b03735 |
| [12] |
L. Zhan, X. Huang, J. Xue, et al., Food Chem. 338 (2021) 127984. DOI:10.1016/j.foodchem.2020.127984 |
| [13] |
D. Asakawa, Mass Spectrom. Rev. 35 (2016) 535-556. DOI:10.1002/mas.21444 |
| [14] |
S. Nicolardi, R. Danuser, V. Dotz, et al., Anal. Chem. 94 (2022) 4979-4987. DOI:10.1021/acs.analchem.1c04690 |
| [15] |
C.K. Fagerquist, Expert Rev. Proteomics 14 (2017) 97-107. DOI:10.1080/14789450.2017.1260451 |
| [16] |
A. Resemann, D. Wunderlich, U. Rothbauer, et al., Anal. Chem. 82 (2010) 3283-3292. DOI:10.1021/ac1000515 |
| [17] |
L. Qiao, H. Bi, J.M. Busnel, et al., Chem. Commun. 47 (2008) 6357-6359. |
| [18] |
S. Nicolardi, D.P.A. Kilgour, N. Dolezal, et al., Anal. Chem. 92 (2020) 5871-5881. DOI:10.1021/acs.analchem.9b05683 |
| [19] |
Y.E.M. van der Burgt, D.P.A. Kilgour, Y.O. Tsybin, et al., Anal. Chem. 91 (2019) 2079-2085. DOI:10.1021/acs.analchem.8b04515 |
| [20] |
L. Zhan, Y. Liu, X. Xie, et al., Anal. Chem. 90 (2018) 10670-10675. DOI:10.1021/acs.analchem.8b02563 |
| [21] |
J. Chen, P. Shiyanov, J.J. Schlager, K.B. Green, J. Am. Soc. Mass Spectrom. 23 (2012) 225-243. DOI:10.1007/s13361-011-0294-6 |
| [22] |
S. Nicolardi, D.P.A. Kilgour, Y.E.M. van der Burgt, M. Wuhrer, Anal. Chem. 92 (2020) 12429-12436. DOI:10.1021/acs.analchem.0c02198 |
| [23] |
X. Lou, J.L. van Dongen, E.W. Meijer, J. Am. Soc. Mass Spectrom. 21 (2010) 1223-1226. DOI:10.1016/j.jasms.2010.02.029 |
| [24] |
L. Kolarova, L. Prokes, L. Kucera, et al., J. Am. Soc. Mass Spectrom. 28 (2017) 419-427. DOI:10.1007/s13361-016-1567-x |
| [25] |
S.M. Grayson, B.K. Myers, J. Bengtsson, M. Malkoch, J. Am. Soc. Mass Spectrom. 25 (2014) 303-309. DOI:10.1007/s13361-013-0777-8 |
| [26] |
J.A. Giesen, B.J. Diament, S.M. Grayson, J. Am. Soc. Mass Spectrom. 29 (2018) 490-500. DOI:10.1007/s13361-017-1849-y |
| [27] |
S. Weidmann, K. Barylyuk, N. Nespovitaya, et al., Anal. Chem. 85 (2013) 3425-3432. DOI:10.1021/ac400129h |
| [28] |
B.H. Clowers, E.D. Dodds, R.R. Seipert, C.B. Lebrilla, Anal. Biochem. 381 (2008) 205-213. DOI:10.1016/j.ab.2008.06.041 |
| [29] |
B.J. Malys, M.L. Piotrowski, K.G. Owens, J. Am. Soc. Mass Spectrom. 29 (2018) 422-434. DOI:10.1007/s13361-017-1845-2 |
| [30] |
X. Zhao, Y. Huang, G. Ma, et al., Anal. Chem. 92 (2020) 991-998. DOI:10.1021/acs.analchem.9b03932 |
| [31] |
T. Gruendling, V. Sauerland, C. Barahona, et al., Rapid Commun. Mass Spectrom. 30 (2016) 681-683. DOI:10.1002/rcm.7492 |
| [32] |
C.K. Fagerquist, O. Sultan, Rapid Commun. Mass Spectrom. 26 (2012) 1241-1248. DOI:10.1002/rcm.6220 |
| [33] |
D. Asakawa, N. Smargiasso, L. Quinton, E. De Pauw, J. Am. Soc. Mass Spectrom. 25 (2014) 1040-1048. DOI:10.1007/s13361-014-0868-1 |
| [34] |
M. Takayama, S. Sekiya, R. Iimuro, et al., J. Am. Soc. Mass Spectrom. 25 (2014) 120-131. DOI:10.1007/s13361-013-0756-0 |
| [35] |
C.K. Fagerquist, W.J. Zaragoza, Int. J. Mass Spectrom. 415 (2017) 29-37. DOI:10.1016/j.ijms.2017.01.017 |
| [36] |
C.K. Fagerquist, C.E. Dodd, Int. J. Mass Spectrom. 471 (2022) 116736. DOI:10.1016/j.ijms.2021.116736 |
| [37] |
M. Kurogochi, S. Nishimura, Anal. Chem. 76 (2004) 6097-6101. DOI:10.1021/ac049294n |
| [38] |
M. Hato, H. Nakagawa, M. Kurogochi, et al., Mol. Cell. Proteomics 5 (2006) 2146-2157. DOI:10.1074/mcp.M600213-MCP200 |
| [39] |
H.S. Tohru Yamagaki, Kazuo Tachibana, Anal. Chem. 77 (2005) 1701-1707. DOI:10.1021/ac040150i |
| [40] |
M. Jovanovic, J. Peter-Katalinic, J. Mass Spectrom. 51 (2016) 111-122. DOI:10.1002/jms.3727 |
| [41] |
T. Nishikaze, K. Kaneshiro, S. Kawabata, K. Tanaka, Anal. Chem. 84 (2012) 9453-9461. DOI:10.1021/ac302286e |
| [42] |
M. Wuhrer, A.M. Deelder, Anal. Chem. 77 (2005) 6954-6959. DOI:10.1021/ac051117e |
| [43] |
T. Nishikaze, S. Kawabata, K. Tanaka, Anal. Chem. 86 (2014) 5360-5369. DOI:10.1021/ac500340t |
| [44] |
J. Jai-nhuknan, C.J. Cassady, Anal. Chem. 70 (1998) 5122-5128. DOI:10.1021/ac980577n |
| [45] |
A. Baksi, P. Chakraborty, A. Nag, et al., Anal. Chem. 90 (2018) 11351-11357. DOI:10.1021/acs.analchem.8b02280 |
| [46] |
R.W. Garden, J.V. Sweedler, Anal. Chem. 72 (2000) 30-36. DOI:10.1021/ac9908997 |
| [47] |
D. Calligaris, R. Longuespee, D. Debois, et al., Anal. Chem. 85 (2013) 2117-2126. DOI:10.1021/ac302746t |