 2022, Vol. 33


b CAS Key Laboratory of Nano-Bio Interface, Suzhou Institute of Nano-Tech and Nano-Bionics, Chinese Academy of Sciences, Suzhou 215123, China
Mycotoxins are highly poisonous compounds produced by different fungi species that seriously threaten human health and safety. Aflatoxins, ochratoxin A, deoxynivalenols, and diacetoxyscirpenol are examples of prevalent mycotoxins [1, 2]. Among them, aflatoxin is a kind of harmful secondary metabolites produced primarily by Aspergillus flavus and Aspergillus parasiticus, and it consists principally of B1, B2, G1, G2, and their two metabolites M1 and M2 [3, 4]. Aflatoxin has a strong inducing mutation effect [5, 6], which can suppress immunity and cause cancer in humans and farm animals [7]. Aflatoxin B1 (AFB1) is the most frequent and harmful of the aflatoxins, and it mostly pollutes peanuts, corn, rice, wheat, peanut oil and other cereals and oils [8]. Due to its ability to prevent the cell RNA synthesis, AFB1 can greatly raise the risk of liver cirrhosis, necrosis, and cancer in humans and animals. It is designated as a Class Ⅰ carcinogen by the cancer research organization of the World Health Organization [9, 10]. The AFB1 content in food has been clearly stipulated in various countries, for example, according to the regulation of National Standards of the People's Republic of China, a permissible limit for AFB1 in corn, peanuts and peanut oil is 20 µg/kg. Therefore, controlling and monitoring the content of AFB1 is of great significance for ensuring human health.
In recent years, many methods such as high-performance liquid chromatography (HPLC) [11, 12], liquid chromatography-mass spectrometry (LC-MS) [13, 14], and thin-layer chromatography (TLC) have been developed for the detection of AFB1 [15, 16]. However, most of the approaches require time-consuming processes, extended detection cycles, complex sample pre-processing, expensive instruments, which limited their detection ability in practical applications [17, 18]. Due to its simplicity and portability, biosensors have opened up new horizon in the field of analytical field [19]. The AFB1 biosensors developed in recent years is mainly based on antibody-linked immunosorbent assays [20, 21]. However, these approaches using antibodies as recognition molecules are typically costly, unstable, and prone to false-positive detection results [9]. Hence, there is an immediate need to create a simple and rapid method for detecting AFB1.
Aptamers refer to synthetic single-stranded DNA or RNA isolated in vitro by the systematic evolution of ligands by exponential enrichment (SELEX) [22, 23]. Aptamers show good affinity and specificity to their targets similar to antibodies, and the other advantages than antibodies, such as low molecular weight, good stability, non-immunogenicity, easy modification, and target diversity, which makes aptamers become an ideal recognition tool for designing biosensors [24, 25]. To date, many aptasensors developed for various targets achieved substantial development [26-28]. However, only a handful of aptamers have access to food-related antibiotics, mycotoxins, toxic metals, and pesticides. Furthermore, most of these selected aptamers have not been utilized for monitoring in food-related fields [29]. This may be caused by the technical challenges involved, such as aptamer selection and characterization, particularly for small-molecule targets [30]. Herein, a novel aptamer capable of targeting AFB1 was obtained through the modified SELEX method. Even in edible peanut oil, the aptamer showed high sensitivity to AFB1. In addition, the obtained aptamer can significantly enhance the fluorescence of AFB1, which is not available in the reported Afla17–2–3 aptamer. As for the possible mechanism of fluorescence, we also analyzed and explored with molecular docking technology.
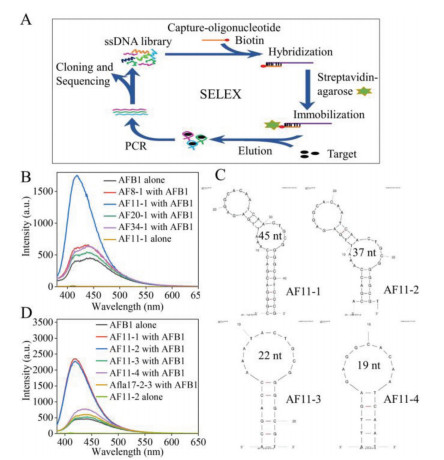
Small molecule targets are difficult to immobilize on the solid phase matrix during traditional SELEX procedure, but a modified affinity chromatography-based selection strategy enables the selection of aptamers for targets free in solution by immobilization of the library on the surface of beads. For this purpose, a docking sequence is included into the library, allowing it to hybridize with complementary oligonucleotides immobilized on beads. During the aptamer selection process, sequences with high affinity for the target are released from the beads for binding to the target [31]. This strategy avoids the possible change of properties after modification, the inaccessibility of partial target surface, and is very suitable for screening aptamers against small molecules that are difficult to immobilize. Using this method, it may not only reduce non-specific binding during SELEX, but also improve the probability of successful selection or even obtain high quality aptamers [32, 33]. Fig. 1A shows the overall selection process for AFB1 as a small molecule target by this modified affinity chromatography-based selection strategy. During this procedure, the random ssDNA library was fixed onto streptavidin-modified beads by hybridization with partially complemented biotin-labeled capture-ssDNA. The aptamer sequences were released from the capture-ssDNA by eluting the column with AFB1 solution. After subsequent PCR amplification, ssDNA preparation and purification, the new ssDNA library for next round was prepared. The above process was repeated for multiple rounds of selection until there was no higher binding promotion in the selection library. The enrichment of the library was monitored using gel electrophoresis. The SELEX eluents were PCR amplified and agarose gel electrophoresis verified. The stronger binding of the ssDNA pool to AFB1, the more sequences would be released from agarose beads when being eluted by AFB1 solution, resulting in a brighter band of agarose gel. As shown in Fig. S1 (Supporting information), the bands AF1, AF2 and AF3 (eluted by AFB1 solution) were significantly brighter than the bands S3 through S5 (eluted by SELEX buffer) at the 11th round of selection, indicating a considerable increase in the binding affinity to AFB1 of this ssDNA pool. Therefore, the enriched ssDNA pool of 11th round was cloned and sequenced. Clustalx 1.8.3 software was used to perform sequence alignment analysis on 34 clones (Fig. S2 in Supporting information). Subsequently, the secondary structures of these sequences were analyzed by M-fold (http://www.unafold.org/mfold/applications/dna-folding-form.php), and four representative sequences were selected and named AF8, AF11, AF20, and AF34, respectively (Fig. S3 in Supporting information). These candidate sequences are approximately 73 nucleotides (nt) long, with a randomized region of around 30 nt and two fixed primer sites of 18 nt and 25 nt on each side. The two fixed parts are designed to be partially complementary, which is convenient to induce the random region form stem-loop structures after binding with the target, and release from the capture-ssDNA. Our previous researches have been verified the feasibility of this design and showed that it is almost not affect the affinity of aptamers to shorten the full-length sequence by removing several nucleotides in the two end fixed regions and retaining the middle stem-loop structures [33-35]. Therefore, in order to explore their properties and design aptasensors more easily, these sequences have been shortened based on their secondary structures by removing part of the primer regions which might not display binding function, and the truncated sequences marked with red frames were synthesized and named AF8–1, AF11–1, AF20–1 and AF34–1, respectively (Table S1 and Fig. S3 in Supporting information).

|
Download:
|
| Fig. 1. Selection and characterization of AFB1 aptamer sequences. (A) Schematic illustration of the SELEX process. (B) Fluorescence spectra of AFB1 alone (0.5 µmol/L) and in the presence of candidate sequences AF8–1, AF11–1, AF20–1 and AF34–1 (0.5 µmol/L) in SELEX buffer respectively. (C) The predicted secondary structure of the 45 nt aptamer (AF11–1), AF11–2, AF11–3 and AF11–4. The AF11–2, AF11–3 and AF11–4 were truncated from the AF11–1. (D) Fluorescence spectra of AFB1 alone (0.5 µmol/L) and in the presence of AF11–1, AF11–2, AF11–3, AF11–4, Afla17–2–3 (1 µmol/L) in SELEX buffer respectively. | |
Based on the AFB1 fluorescence under UV irradiation, the corresponding fluorescence spectra of AFB1 with various aptamer candidates were analyzed [36]. As shown in Fig. 1B, the fluorescence intensity of the low-fluorescent AFB1 was significantly increased due to the addition of AF11–1 in SELEX buffer, while the other three selected candidates had quite slight fluorescence enhancement. Previous studies showed that the use of the shorter aptamer could save costs without compromising target recognition capability [37, 38]. Thus, AF11–2, AF11–3, and AF11–4 were truncated from the obtained aptamer AF11–1, and their secondary structures predicted by M-fold were also displayed (Fig. 1C). Fluorescence spectra of AFB1 were measured with and without obvious truncated sequences. As shown in Fig. 1D, there was no significant difference in the increased fluorescence intensity between AF11–1 and AF11–2. However, for AF11–3 and AF11–4, the fluorescence intensity of AFB1 had quite slight enhancement, indicating weaker binding. Judging by the performance of these four sequences, AF11–2 is the best aptamer for AFB1 binding. Moreover, the AF11–2 also showed good stability for AFB1 fluorescence enhancement even being stored at 37 ℃ for 24 h (Figs. S4A and B in Supporting information).
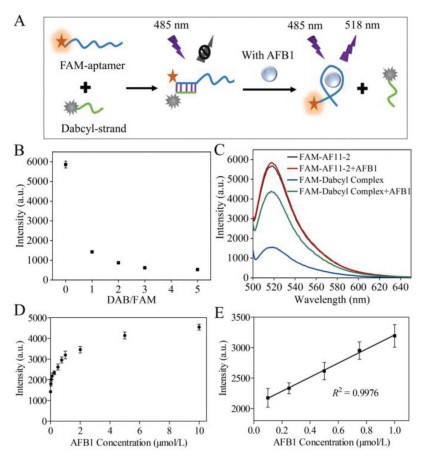
Later, the targeted binding performance of AF11–2 aptamer was analyzed, and a biosensor was designed for detect AFB1. As shown in Fig. 2A, in order to improve the structure's stability and interaction with AFB1, two synthetic sequences were used: the aptamer AF11–2 was modified with a fluorescein FAM at 5′ end (5′-FAM-ATTCGCGACGACCAAATTGAGAGGCACAATCAACTGCGGGGCGTCG) used as the fluorescent probe and its short quencher, which was partially complementary to the FAM-aptamer and labeled with Dabcyl at 3′ end (GGTCGTCGCGAAT-Dabcyl-3′). The AF11–2 which was further lengthened by another seven bases (ATTCGCG) on the 5′ end, two bases (CG) on the 3′ end and labeled by FAM (denoted as FAM-AF11–2) in order to interact with the quencher. Then the dabcyl labeled strand was designed which are partially complementary (13 base pairs) with FAM-AF11–2 to further detect AFB1. The strategy for development of aptasensor was designed based on fluorescence quenching-recovery mechanism. In the absence of AFB1, the aptamer hybridizes with its complementary sequence and forms a double-strand complex. In this case, the fluorophore FAM and Dabcyl are in close proximity, thus causing the fluorescence of FAM quenching due to Fluorescence Resonance Energy Transfer (FRET) [39]. With the addition of AFB1, the binding of aptamer to its target promoted the conformational changes of the aptamer, which induced the aptamer dissociation from its quenching strand. Then the aptamer fluorescent probe released and the fluorescence recovered.

|
Download:
|
| Fig. 2. (A) Principle of fluorescent aptasensor. (B) Quenching effect of different ratios of quenching chain and fluorescent aptamer. (C) Fluorescence spectrum of the fluorescence sensor before and after adding AFB1 (5 µmol/L). (D) The curve plotted between fluorescence intensity against concentrations of AFB1 (0, 0.01, 0.025, 0.05, 0.075, 0.1, 0.25, 0.5, 0.75, 1, 2, 5, 10 µmol/L). (E) Linear relationship between the fluorescence intensity and AFB1 concentration (10–1000 nmol/L). | |
The experimental variable like aptamer-quencher ratio which might have significantly impact on the aptamer assay was carefully optimized. Fluorescence response was quenched after hybridization of FAM-aptamer with its complementary quencher. Different ratios of FAM-AF11–2 to quencher from 1:1 to 1:5 were investigated. From the results of quenching efficiency, almost the best response was observed even in case of 1:1 ratio (Fig. 2B). Therefore, in the subsequent AFB1 detection and aptamer characterization, the ratio of quencher to FAM-aptamer was 1:1. Subsequently, the fluorescence enhancement of the aptamer-quencher complexes after addition of AFB1 was measured. Due to the proximity between FAM and Dabcyl, the hybridization (blue line) of FAM-AF11–2 with quencher resulted in 73% reduction of fluorescence intensity (black line) (Fig. 2C). Upon adding 5 µmol/L AFB1, the fluorescence intensity (green line) restored to 75% of the maximum possible fluorescence response (red line). In addition, there was a slight enhancement of fluorescence intensity to FAM-AF11–2 due to the addition of AFB1, and the addition of 5 µmol/L induced an approximately 3% increase (red line), which will not have much impact on the detection results. These results suggest that the FAM-labeled aptamer could be used as a probe to develop light-up sensors to detect AFB1. Under optimized aptamer-quencher ratio condition, fluorescent aptamer assay was performed to detection AFB1 in buffer solutions. As shown in Fig. 2D, the fluorescence intensities were plotted as a function of AFB1 concentrations from 0 to 10 µmol/L. Good linearity was also obtained in the range of 100–1000 nmol/L (Fig. 2E). The limit of detection (LOD) was determined based on signal to noise ratio (S/N = 3) and calculated to be 42 nmol/L. The linear regression equation is F = 1156C + 2054 (µmol/L, coefficient of correlation R2 = 0.9976). The fitting results were given by Graphpad Prism 5.
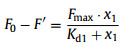
Dissociation constant (Kd) was determined by monitoring the change in the fluorescence intensity of aptamer-quencher complex after binding with AFB1. First, the dissociation constant Kd1 for the quenching strand bound to FAM-AF11–2 was determined by fit ting the binding curve according to Eq. 1:
|
(1) |
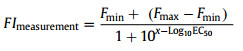
where x1 represents the concentration (nmol/L) of the quencher, F0 represents the fluorescence intensity of FAM-AF11–2 alone and F′ is the fluorescence intensity of FAM-AF11–2 in the presence of various concentrations of the quencher. Kd1 was fitted to be 23.84 ± 4.89 nmol/L Fig. 3A). The Kd between AFB1 and FAM-AF11–2 is measured by nonlinear fitting in GraphPad Prism 5 according to the following equations (Eqs. 2 and 3) [40]:
|
(2) |
|
(3) |
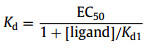
here, x is Log10[AFB1]; FImeasurement represents the measured fluorescence intensity; Fmax and Fmin represent fitting parameters that correspond to the maximum and minimum response, respectively. [ligand] means the concentration of the quenching strand, and EC50 is the AFB1 concentration leading to 50% of fluorescence enhancement. The Kd between AFB1 and FAM-AF11–2 was fitted to be 272.70 ± 27.15 nmol/L (Fig. 3B).

|
Download:
|
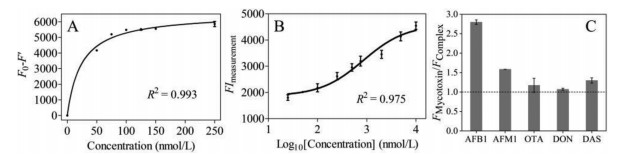
| Fig. 3. Binding affinity and selectivity. (A) The dissociation constant curves of the FAM-labeled aptamer for quenching strand. F0 is the fluorescence intensity of FAM-AF11–2 (50 nmol/L). F' is the fluorescence intensity of FAM-AF11–2 (50 nmol/L) following incubation with various concentrations of quenching strand. (B) The dissociation constant curves of the FAM-labeled aptamer and quenching strand complex after adding various concentrations of AFB1. FImeasurement represents the fluorescence intensity of the complex after adding different concentrations of AFB1, where the aptamer to quenching strand ratio is 1:1 and the aptamer concentration is 50 nmol/L. (C) The intensity of fluorescence changes in the presence of 5 µmol/L mycotoxins: FMycotoxin is the fluorescence intensity of the FAM-aptamer-quenching strand complex following the addition of different mycotoxins: AFB1, AFM1, OTA, DON, DAS, where the aptamer to quenching strand ratio is 1:1 and the aptamer concentration is 50 nmol/L. FComplex is the fluorescence intensity of FAM-aptamer-quenching strand complex. Three independent experiments were used to determine the standard deviations. | |
The selectivity of this method against other four mycotoxins was evaluated. The biosensor was tested with high concentration of mycotoxins including aflatoxin M1 (AFM1), ochratoxin A (OTA), deoxynivalenol (DON), and diacetoxyscirpenol (DAS), respectively. AFM1 in particular, differs from AFB1 by only a single hydroxyl group (Fig. S5 in Supporting information). Considering the structures of these compounds, it is not surprising that this biosensor responded modestly to AFM1 but negligible response to OTA, DON or DAS, while the selected aptamer displayed high response for AFB1 (Fig. 3C).
Achieving highly-performing analytical measurement of real samples is an important step to examine the feasibility of this novel aptamer. Standard addition experiments were conducted using various dilutions of AFB1 spiked in peanut oil purchased from the local supermarket. And peanut oil was pre-treated in accordance with the methods described in the literature [41]. We employed the aptasensor to detect AFB1 in the range of 100–1000 nmol/L with high accuracy. Good recovery percentages were obtained at range from 97.46% to 107.84% of the pre-treated peanut oil samples, and relative standard deviation (RSD) was within 6.55%, and the results were basically not far-off with those of the commercial enzyme-linked immunoassay kit (Table S2 in Supporting information). Based on the successful demonstration of pre-treated peanut oil samples, it is foreseeable that this detection method based on aptamer can readily be extended to the monitoring of AFB1 in other media.
Although several aptamers for AFB1 have been reported in literature, few of them can be used for real food-related safety detection [29, 42]. Among them, Afla17–2–3 (PCT/CA2010/001, 292) is the most cited AFB1 aptamer in the literature, and has good potential in AFB1 detection [17, 43-45]. However, Afla17–2–3 aptamer did not significantly enhance the fluorescence of AFB1, which is unsatisfactory. The selected AF11–2 aptamer has no sequence similarity with the previously reported AFB1 aptamer (Table S3 in Supporting information), and is a new type of fluorescence-enhanced sequence. This phenomenon of fluorescence enhancement makes it possible to visually detect AFB1.
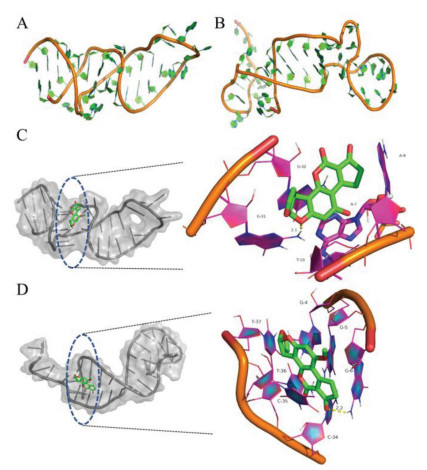
Molecular docking is a theoretical simulation method to reveal the interaction and binding mechanism between aptamer and target [46]. First, both three-dimensional structures of aptamer AF11–2 and Afla17–2–3 were obtained by modeling. The active sites were mainly composed of hydrophobic trenches, located on the surface of the aptamers (Figs. 4A and B). In the docking process, a total of 100 conformations were extracted and evaluated according to their docking energy, with the lowest binding energy conformation being utilized to predict the target-aptamer binding sites. In terms of the lowest docking energy, the value of AF11–2 is −6.38 kcal/mol, which is similar to the docking energy of Afla17–2–3 (−6.77 kcal/mol). According to the molecular docking results, AFB1 mainly forms hydrophobic effect and van der Waals force with the nucleotides of A9, T10, G31, and G32 of aptamer AF11–2. As a comparison, AFB1 mainly forms hydrophobic effect and van der Waals force with the nucleotides of G4, G5, G6, C34, C35, T36, T37 of aptamer Afla17–2–3. In addition, the pyrrolic O of AFB1 forms a hydrogen bond with the hydrogen atom on the G31 base of the aptamer AF11–2, with the bond length of 2.1 Å. However, for Afla17–2–3, it is the carbonyl O in the AFB1 structure that forms a hydrogen bond with the hydrogen atom on the G6 base of the aptamer, and the bond length is 2.2 Å (Figs. 4C and D). Differences between binding sites may be the reason for the different effects of aptamers on the fluorescence properties of AFB1, that is, the interaction of AF11–2 and AFB1 can enhance the fluorescence of AFB1, while Afla17–2–3 does not significantly change the fluorescence of AFB1.

|
Download:
|
| Fig. 4. (A) Three-dimensional structure of AF11–2 by modeling. (B) Three-dimensional structure of Afla17–2–3 by modeling. (C) Interaction model between AF11–2 and AFB1 including close view of interaction region. (D) Interaction model between Afla17–2–3 and AFB1 including close view of interaction region. | |
In summary, a new DNA aptamer for AFB1 was successfully obtained by a modified affinity chromatography-based SELEX strategy, and its main functional fragments were analyzed. A designed aptasensor based on the truncated aptamer AF11–2 showed high sensitivity for detecting AFB1, with a linear quantitative range of 100–1000 nmol/L and a detection limit of 42 nmol/L. Furthermore, the dissociation constant of the FAM-AF11–2 aptamer is about 272.70 ± 27.15 nmol/L, and it also shows good selectivity for AFB1 over its analogues. This kind of aptamer can be used in food-related fields. Even for pretreated peanut oil samples, AFB1 can be sensitively detected. Based on the new type of fluorescence-enhanced aptamer, it can be used to detect and quantify the concentration of AFB1 in real samples. Finally, in terms of the results obtained from the molecular docking, compared with the reported aptamer Afla17–2–3, the new aptamer AF11–2 binds to AFB1 in different nucleotide sites with hydrophobic effect and van der Waals force. In addition, it should be noted that the binding site of AF11–2 to the pyrrolic O of AFB1 through hydrogen bond is different from Afla17–2–3 to the carbonyl O of AFB1, which may be the main reason that AF11–2 can enhance the fluorescence of AFB1.
Declaration of competing interestThe authors declare no competing financial interest.
AcknowledgmentsThis work was supported by the National Natural Science Foundation of China (Nos. 32071392, 21775160 and 31900999), the Natural Science Foundation of Jiangsu Province (No. BE2020766), and the Science Foundation of Jiangxi Province (No. 20192ACB21033).
Supplementary materialsSupplementary material associated with this article can be found, in the online version, at doi:10.1016/j.cclet.2022.01.040.
| [1] |
J.C. Vidal, L. Bonel, A. Ezquerra, et al., Biosens. Bioelectron. 49 (2013) 146-158. DOI:10.1016/j.bios.2013.05.008 |
| [2] |
J. Jin, K. Beekmann, E. Ringo, I.M.C.M. Rietjens, F.G. Xing, Food Control 126 (2021) 107998. DOI:10.1016/j.foodcont.2021.107998 |
| [3] |
G. Miklos, C. Angeli, A. Ambrus, et al., Front. Microbiol. 11 (2020) 1916. DOI:10.3389/fmicb.2020.01916 |
| [4] |
A.P. Wacoo, D. Wendiro, P.C. Vuzi, J.F. Hawumba, J. Appl. Chem. 2014 (2014) 1-15. DOI:10.1155/2014/706291 |
| [5] |
L.N. Qi, T. Bai, Z.S. Chen, et al., Liver Int. 35 (2015) 999-1009. DOI:10.1111/liv.12460 |
| [6] |
T. Zamir-Nasta, M. Razi, H. Shapour, H. Malekinejad, Environ. Toxicol. 33 (2018) 385-395. DOI:10.1002/tox.22524 |
| [7] |
D.D. Sun, X. Gu, J.G. Li, T. Yao, Y. Dong, Asian-Australas. J. Anim. Sci. 28 (2015) 691-696. DOI:10.5713/ajas.14.0868 |
| [8] |
Y. Li, Q. Zhao, Chin. Chem. Lett. 31 (2020) 1982-1985. DOI:10.1016/j.cclet.2020.01.022 |
| [9] |
Y. Jia, G. Zhou, P. Liu, Z. Li, B. Yu, Appl. Sci. 9 (2019) 2364. DOI:10.3390/app9112364 |
| [10] |
S. He, Q. Huang, Y. Zhang, et al., Chin. Chem. Lett. 32 (2021) 1462-1465. DOI:10.1016/j.cclet.2020.09.047 |
| [11] |
S.M. Herzallah, Food Chem. 114 (2009) 1141-1146. DOI:10.1016/j.foodchem.2008.10.077 |
| [12] |
W.S. Khayoon, B. Saad, T.P. Lee, B. Salleh, Food Chem. 133 (2012) 489-496. DOI:10.1016/j.foodchem.2012.01.010 |
| [13] |
K. Zhang, K. Banerjee, Toxins (Basel) 12 (2020) 539. DOI:10.3390/toxins12090539 |
| [14] |
E. Miro-Abella, P. Herrero, N. Canela, et al., Food Chem. 229 (2017) 366-372. DOI:10.1016/j.foodchem.2017.02.078 |
| [15] |
L.L. Qu, Q. Jia, C. Liu, et al., J. Chromatogr. A 1579 (2018) 115-120. DOI:10.1016/j.chroma.2018.10.024 |
| [16] |
S. Pradhan, L. Ananthanarayan, JPC-J. Planar Chromatogr.-Mod. TLC 33 (2020) 617-630. DOI:10.1007/s00764-020-00073-6 |
| [17] |
Y. Li, D. Liu, C. Zhu, et al., Sensor. Actuat. B: Chem. 336 (2021) 129021. DOI:10.1016/j.snb.2020.129021 |
| [18] |
M.J. Raeisossadati, N.M. Danesh, F. Borna, et al., Biosens. Bioelectron. 86 (2016) 235-246. DOI:10.1016/j.bios.2016.06.061 |
| [19] |
S. Cinti, C. Minotti, D. Moscone, G. Palleschi, F. Arduini, Biosens. Bioelectron. 93 (2017) 46-51. DOI:10.1016/j.bios.2016.10.091 |
| [20] |
T. Yamasaki, S. Miyake, N. Sato, et al., Food Hyg. Safe. Sci. 59 (2018) 200-205. DOI:10.3358/shokueishi.59.200 |
| [21] |
J.W. Liu, C.C. Lu, B.H. Liu, F.Y. Yu, Food Control 59 (2016) 700-707. DOI:10.1016/j.foodcont.2015.06.038 |
| [22] |
C. Tuerk, L. Gold, Science 249 (1990) 505-510. DOI:10.1126/science.2200121 |
| [23] |
S. Qi, N. Duan, Y.H. Sun, et al., Sensor. Actuat. B: Chem. 340 (2021) 129956. DOI:10.1016/j.snb.2021.129956 |
| [24] |
K. Abnous, N.M. Danesh, M. Alibolandi, et al., Sensor. Actuat. B: Chem. 240 (2017) 100-106. DOI:10.1016/j.snb.2016.08.100 |
| [25] |
Y. Liu, G. Yang, T. Li, et al., Chin. Chem. Lett. 32 (2021) 1957-1962. DOI:10.1016/j.cclet.2021.01.016 |
| [26] |
Y. Wang, Z. Li, D. Hu, et al., J. Am. Chem. Soc. 132 (2010) 9274-9276. DOI:10.1021/ja103169v |
| [27] |
X.J. Chen, Y.Z. Wang, Y.Y. Zhang, et al., Anal. Chem. 86 (2014) 4278-4286. DOI:10.1021/ac404070m |
| [28] |
Y. Wang, Z. Li, T.J. Weber, et al., Anal. Chem. 85 (2013) 6775-6782. DOI:10.1021/ac400858g |
| [29] |
M. McKeague, R. Velu, K. Hill, et al., Toxins (Basel) 6 (2014) 2435-2452. DOI:10.3390/toxins6082435 |
| [30] |
M. McKeague, M.C. Derosa, J. Nucleic Acids 2012 (2012) 748913-748913. DOI:10.1155/2012/748913 |
| [31] |
L. Yang, P. Ding, Y. Luo, et al., ACS Comb. Sci. 21 (2019) 83-89. DOI:10.1021/acscombsci.8b00129 |
| [32] |
M. Rajendran, A.D. Ellington, Nucleic Acids Res. 31 (2003) 5700-5713. DOI:10.1093/nar/gkg764 |
| [33] |
H. Wang, J. Wang, Q. Wang, et al., Talanta 168 (2017) 217-221. DOI:10.1016/j.talanta.2017.03.041 |
| [34] |
Y. Luo, Z. Jin, J. Wang, P. Ding, R. Pei, Analyst 146 (2021) 1986-1995. DOI:10.1039/D0AN01967D |
| [35] |
J. Wang, Y. Zhang, H. Wang, et al., New J. Chem. 40 (2016) 9768-9773. DOI:10.1039/C6NJ02290A |
| [36] |
Q. Shu, Y. Wu, L. Wang, Z.F. Fu, Talanta 204 (2019) 261-265. DOI:10.1016/j.talanta.2019.05.109 |
| [37] |
M.C. Cowperthwaite, A.D. Ellington, J. Mol. Evol. 67 (2008) 95-102. DOI:10.1007/s00239-008-9130-4 |
| [38] |
S.X. Gao, X. Zheng, B.H. Jiao, L.H. Wang, Anal. Bioanal. Chem. 408 (2016) 4567-4573. DOI:10.1007/s00216-016-9556-2 |
| [39] |
C.W. Liu, C.C. Huang, H.T. Chang, Anal. Chem. 81 (2009) 2383-2387. DOI:10.1021/ac8022185 |
| [40] |
P. Travascio, A.J. Bennet, D.Y. Wang, D. Sen, Chem. Biol. 6 (1999) 779-787. DOI:10.1016/S1074-5521(99)80125-2 |
| [41] |
X. Ma, W. Wang, X. Chen, et al., Eur. Food Res. Tech. 238 (2014) 919-925. DOI:10.1007/s00217-014-2176-1 |
| [42] |
S.L. Stead, H. Ashwin, B. Johnston, et al., Anal. Chem. 82 (2010) 2652-2660. DOI:10.1021/ac902226v |
| [43] |
W.B. Shim, M.J. Kim, H. Mun, M.G. Kim, Biosens. Bioelectron. 62 (2014) 288-294. DOI:10.1016/j.bios.2014.06.059 |
| [44] |
B. Wang, Y. Chen, Y. Wu, et al., Biosens. Bioelectron. 78 (2016) 23-30. DOI:10.1016/j.bios.2015.11.015 |
| [45] |
F.S. Sabet, M. Hosseini, H. Khabbaz, M. Dadmehr, M.R. Ganjali, Food Chem. 220 (2017) 527-532. DOI:10.1016/j.foodchem.2016.10.004 |
| [46] |
S.D. Cai, J.H. Yan, H.J. Xiong, et al., Analyst 143 (2018) 5317-5338. |