 2022, Vol. 33


b College of Environmental Science and Engineering, Taiyuan University of Science and Technology, Taiyuan 030024, China
Main volatile organic compounds (VOCs) are crucial precursors of secondary organic aerosol, ozone pollution, and photochemical smog [1-5]. Nitrogen-containing VOCs (NVOCs), such as acrylonitrile, n-butylamine and N,N-dimethylformamide, which are typical NVOCs, are most frequently in the emission of the petrochemical, pharmaceutical, coating industries [3, 6]. NVOCs will cause substantial pollution to the environment and exert strong toxic effects on the human body. For the elimination of NVOCs, the traditional combustion technology usually operates at high temperatures, which leads to highly energy consumption and secondary pollutant NOx formation [7]. Conversely, selective catalytic oxidation (SCO) technology can realize selective generation of nitrogen and reduce the generation of nitrogen oxides [8]. Therefore, effective catalysts with a high catalytic conversion rate and N2 selectivity in the decomposition of NVOCs must be explored.
A number of studies describing the catalytic degradation of NVOCs have been published. According to Nanba et al., Cu/ZSM-5 could completely convert acrylonitrile with an N2 selectivity of at least 80% at a temperature greater than 350 ℃ [7-9]. Zhang et al. reported the nearly complete conversion of acetonitrile by Cu/SBA-15 that was associated with an N2 selectivity of approximately 80% at T > 300 ℃, and thus Cu/SBA-15 was the most promising catalyst [10]. Zhou et al. investigated CrCe supporting on different pillared interlayered clays catalysts for the NVOCs (n-butylamine, ethylenediamine, and acetonitrile) oxidation [11]. Ma et al. discussed the high catalytic activity of Pd-confined materials, showed the complete conversion of n-butylamine at 280 ℃ and explored the structure activity relationship and the reaction mechanism [12]. However, it is rarely reported that low temperature (< 300 ℃) catalytic oxidation of NVOCs can be achieved on non-noble metal catalysts. In particular, the catalysts simultaneously exhibit high conversion and N2 selectivity at low temperatures.
In recent years, as a rare earth metal oxide, CeO2 has excellent oxygen storage performance, which was used to catalyze various reactions, such as nitric oxide reduction, carbon monoxide oxidation and NH3 oxidation reactions [13-15]. Wang et al. observed that the CuO-CeO2 sample exhibited highly dispersed CuO species, which possessed the highest activity in NH3 oxidation [16]. The Ce-Zr mixed oxide has been used as a catalyst or support for NOx selective catalytic reduction, because it combines the advantages of CeO2 and ZrO2. Si et al. impregnated CeO2-ZrO2 with nickel and sulfate were to improve the catalytic performance for removal of NO with NH3 [17].
To take full advantage of the Ce-Zr mixed oxide and the promoting effect of Cu, CeZrOx and CeCuaZrOx (a = 1%, 5%, 10%, and 15%) were synthesized using a precipitation method and tested for selective oxidation of n-butylamine in the present study. The catalysts showed high n-butylamine conversion rates and N2 selectivity. Moreover, the structure, physical properties, oxygen species, and redox ability of catalysts were also characterized by various techniques, and the reaction mechanism underlying the catalytic degradation of n-butylamine was also discussed.
The structure and physical properties of CeCuaZrOx catalysts were characterized by X-ray diffraction (XRD), high resolution transmission electron microscopy (HR-TEM) and N2 adsorption/desorption. The XRD results of CeCuaZrOx catalysts are shown in Fig. S1 (Supporting information). CeZrOx displayed four main peaks at approximately 29.1°, 33.7°, 48.5° and 57.5°, consistent with the structure of Ce0.6Zr0.4O2 (JCPDS No. 38-1439) and corresponding to the (111), (200), (220) and (311) planes. For CeCuaZrOx catalysts, characteristic diffraction peaks for the Ce0.6Zr0.4O2 and the ZrO2 phase (JCPDS No. 49-1642) were obtained, indicating the weak interaction between Ce and Zr, which resulted in the segregation of CeO2 and ZrO2 [18, 19]. For CeCuaZrOx samples, the intensity of peaks assigned to Ce0.6Zr0.4O2 and ZrO2 decreased significantly as Cu content increased. No obviously characteristic diffraction peaks of Cu species were presented in XRD results, indicating that Cu species were highly dispersed on the catalyst's surface. Additionally, the CeO2 crystallite sizes were calculated using the Scherrer equation and shown in Table S1 (Supporting information), it decreased a little as the increasing of Cu content.
HR-TEM images of CeCu10%ZrOx are shown in Figs. S2a and b (Supporting information), the lattice spacing values of 0.269, 0.291 and 0.312 nm, which were attributed to the exposed Ce0.6Zr0.4O2 (200), ZrO2 (111) and (111) facets of Ce0.6Zr0.4O2, respectively. The exposure of ZrO2 (111) facets indicated the presence of phase separation in the CeCu10%ZrOx catalyst, consistent with the XRD result. Elemental mapping was performed by energy-dispersive X-ray spectroscopy (EDX) to confirm the elemental distributions of Ce, Cu, Zr, and O species in CeCu10%ZrOx. As shown in Figs. S2d-h (Supporting information), the O, Ce, Cu, and Zr species were homogeneously dispersed throughout CeCu10%ZrOx, verifying that Cu2+ was successfully incorporated into CeZrOx.
N2 adsorption/desorption isotherms and pore size distribution of CeCuaZrOx catalysts are shown in Fig. S3 (Supporting information). According to International Union of Pure and Applied Chemistry (IUPAC) classification, all the catalysts presented type Ⅳ isotherm curves, indicated that the samples are typical mesoporous materials. The special surface area (SSA), pore volume and pore size are calculated by N2 physical adsorption results of CeZrOx and CeCuaZrOx catalysts and shown in Table S1. The addition of CuO in CeZrOx had a significant impact on the special surface area. As the contents of Cu increased from 1% to 15%, the SSA of the samples grew from 61 to 85 m2/g, CeCu15%ZrOx exhibited the largest surface area of 85 m2/g. The results showed that the introduction of Cu into the CeZrOx could lead to the change of the structure, further result in the higher specific surface area [20], which is instrumental in the dispersion of Cu species.
The conversion of n-butylamine and characteristic activity data are shown in Fig. 1a and Table S1. Obviously, the addition of Cu increased the n-butylamine conversion in all samples. The temperature recorded at 50% and 90% n-butylamine conversion (T50 and T90) decreased in the order CeZrOx > CeCu15%ZrOx > CeCu10%ZrOx > CeCu5%ZrOx > CeCu1%ZrOx. Interestingly, the values of T100 decreased in the order CeZrOx > CeCu1%ZrOx = CeCu5%ZrOx > CeCu10%ZrOx = CeCu15%ZrOx. The activities of CeCuZrOx catalysts were higher than the values reported in the literature (Table S2 in Supporting information). As shown in Fig. 1a, the conversion vs. temperature plot of n-butylamine oxidation over CeZrOx exhibited a relativity lower conversion rate, while complete conversion was achieved at approximately 350 ℃. Furthermore, n-butylamine oxidation activity in the presence of Cu in CeZrOx was very similar, the conversion of n-butylamine progressively increased with the temperature rising, and a 100% n-butylamine conversion rate was achieved at about 300 ℃. The n-butylamine conversion over CeCuaZrOx samples is tightly related to the Cu contents. CeCu10%ZrOx and CeCu15%ZrOx exhibited the highest activity and achieved 100% n-butylamine conversion at 250 ℃.

|
Download:
|
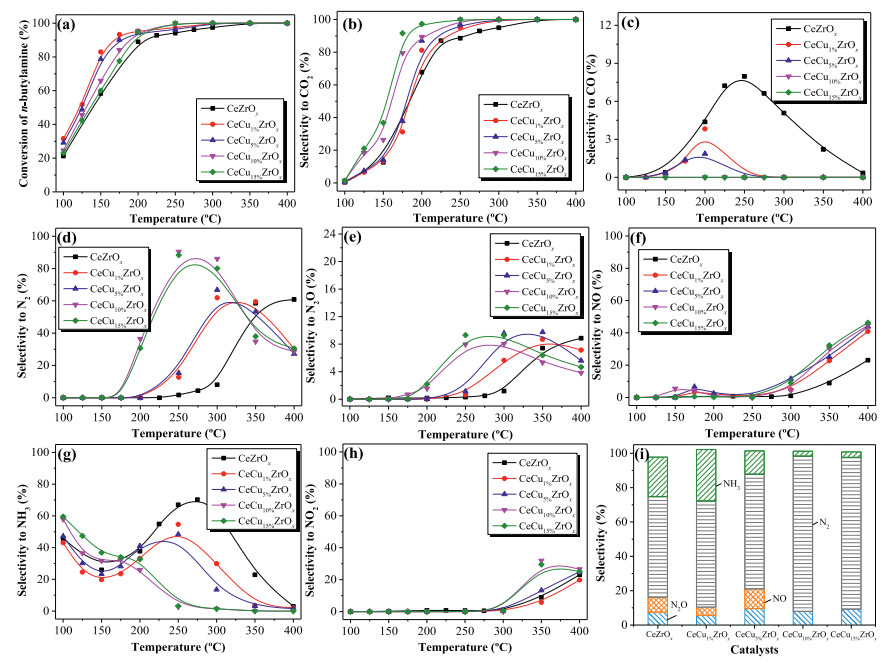
| Fig. 1. Effect of temperature on (a) conversion of n-butylamine, (b) CO2 selectivity and (c) CO selectivity. (d) N2 selectivity, (e) N2O selectivity, (f) NO selectivity, (g) NH3 selectivity, (h) NO2 selectivity, and (i) product selectivity in n-butylamine oxidation at T100 for CeCuaZrOx catalysts. | |
The selectivity to CO2 and CO over CeCuaZrOx catalysts during n-butylamine oxidation is shown in Figs. 1b and c. For CO2 formation, as shown in Fig. 1b, the selectivity to CO2 over CeZrOx and CeCuaZrOx catalysts increased with the increasing of temperature and achieved 100% at a higher temperature. The shape of CO2 selectivity showed the same trend as that of n-butylamine conversion rates over CeCuaZrOx, and the CO2 selectivity increased with the increase of copper contents. For CO formation, as shown in Fig. 1c, the CO selectivity over CeZrOx and CeCuaZrOx catalysts first increased and then decreased. Relative higher amount of CO was formed over CeZrOx, and the formation of CO over CeCuaZrOx decreased with the increase of copper contents. Above all, CO was almost not produced over CeCu10%ZrOx and CeCu15%ZrOx samples at 100–400 ℃.
Figs. 1d–h present the selectivity of N-containing products (N2, N2O, NO, NO2 and NH3) of n-butylamine catalytic degradation over CeCuaZrOx. As seen from Fig. 1d, CeZrOx exhibited very low N2 selectivity at temperatures ranging from 100 ℃ to 300 ℃. The N2 selectivity over CeCuaZrOx catalysts first increased and then decreased with the temperature rising. And the N2 selectivity of CeCu10%ZrOx was apparently higher than other catalysts, increased with the reaction temperature and reached a maximum of 90% at 250 ℃. The increase in N2 selectivity observed at T < 300 ℃ for CeCuaZrOx was probably because of copper doping. The incorporation of Cu in CeZrOx might favor the generation of N2. While at high temperatures from 300 ℃ to 400 ℃, the decrease in N2 selectivity was caused by the formation of NOx. For the degradation of NVOCs, the crucial point for NVOCs catalytic oxidation lies in the enhancement of the nitrogen generation and control of NOx production, avoiding secondary pollution.
To get an intensive study into the catalytic behaviors of CeCuaZrOx catalysts, the undesirable byproducts (N2O, NO, NH3, NO2) selectivity are respectively depicted in Figs. 1e–h. As noted, NO was the main N-containing byproducts for CeZrOx and CeCuaZrOx catalysts. NO selectivity first increased to 8% and then decreased at T < 250 ℃. Besides, selectivity to NO over CeCuaZrOx increased with the raising of copper content at T > 250 ℃. The selectivity to NO over catalysts increased upon the rising temperature and achieved 50% at 400 ℃. Additionally, NO2 was generated over CeCuaZrOx at 300 ℃, and the production of NO and NO2 at high temperatures is the major cause for the decrease of N2 selectivity. Fig. 1i shows N-containing product selectivity at T100. CeCu10%ZrOx had the highest N2 selectivity, as well as the lowest NO selectivity. Less NH3 formation occurred with CeCu5%ZrOx, CeCu10%ZrOx and CeCu15%ZrOx than with CeCu1%ZrOx and CeZrOx. N2 was the main product generated by CeCu10%ZrOx, and thus this catalyst represents a promising candidate for n-butylamine selective catalytic oxidation. At temperatures greater than T100, the nitrogen balance was more than 95% for CeCuaZrOx catalysts.
The catalytic degradation of exhaust containing water vapor may result in the deactivation of catalysts in practical application. Hence, the investigation of the effect of H2O on the catalytic performance of CeCu10%ZrOx is worthwhile. As shown in Fig. S4 (Supporting information), the addition of 15 vol% H2O exerted little inhibition effect on n-butylamine conversion. A 100% n-butylamine conversion rate was obtained at T > 250 ℃, which was the same as that of the reaction without H2O. Moreover, N2 selectivity was slightly decreased to 85% by the addition of H2O. The decrease in N2 selectivity in the reaction with CeCu10%ZrOx was accompanied by increases in NH3 and NOx formation. H2O exists in the reaction atmosphere as a reactant, and there is competitive adsorption with reactant molecules n-butylamine and oxygen, resulting in the decrease of N2 selectivity and the formation of other nitrogen-containing products. The formation of NH3 may be due to the presence of H2O. H2O molecule will participate in the reaction after decomposition, and *NH2 species are more likely to produce NH3. Briefly, the CeCu10%ZrOx catalyst exhibited good resistance to H2O and thus it is potentially useful for eliminating n-butylamine from the exhaust containing a certain amount of H2O.
The capability of oxygen species transmission and migration on Ce-Zr based catalysts are vital factors in catalytic oxidation reactions, which were evaluated using O2 temperature-programmed desorption (O2-TPD), UV-vis diffuse reflectance spectra (UV-vis DRs), X-ray photoelectron spectra (XPS) and Raman. The O2-TPD patterns of the CeCuaZrOx samples are presented in Fig. S5 (Supporting information) and could be divided into three areas. The desorption peak centered at T < 200 ℃, is characteristic of the desorption of ordinarily chemically adsorbed oxygen species. The area at the temperature range of 200-600 ℃ is ascribed to the desorption of oxygen chemically adsorbed on the oxygen vacancies [21]. And the third area appeared at high temperatures, which could be attributed to the bulk lattice oxygen [22]. The lattice oxygen of CeZrOx and CeCu1%ZrOx catalysts did not appear in this temperature range, indicating that the desorption of lattice oxygen species in these samples required a higher temperature. The desorption temperatures of the first peaks decreased in the order that: CeZrOx > CeCu15%ZrOx > CeCu10%ZrOx > CeCu5%ZrOx > CeCu1%ZrOx, which was related to the catalytic activity of n-butylamine at lower temperatures (T50 and T90). It indicating that chemisorbed oxygen species was more conducive to the low-temperature activation of pollutant molecules and further oxidation to produce CO2 and H2O.
The electronic states of CeCuaZrOx catalysts were obtained from UV-vis-DRs and shown in Fig. S6 (Supporting information). The band at ca. 218 nm could be assigned to tetravalent Zr species with eight-coordinated [23]. The band near 245 nm corresponded to the charge transfer transitions between O2− and Ce3+, which indicated the existence of oxygen vacancy. The bands for all catalysts around 310 nm and 341 nm were attributed to the charge transfer and inter band transitions of O2−and Ce4+, respectively [24, 25]. Based on these results, both Ce3+ and Ce4+ species were present in these samples, consistent with the XPS results.
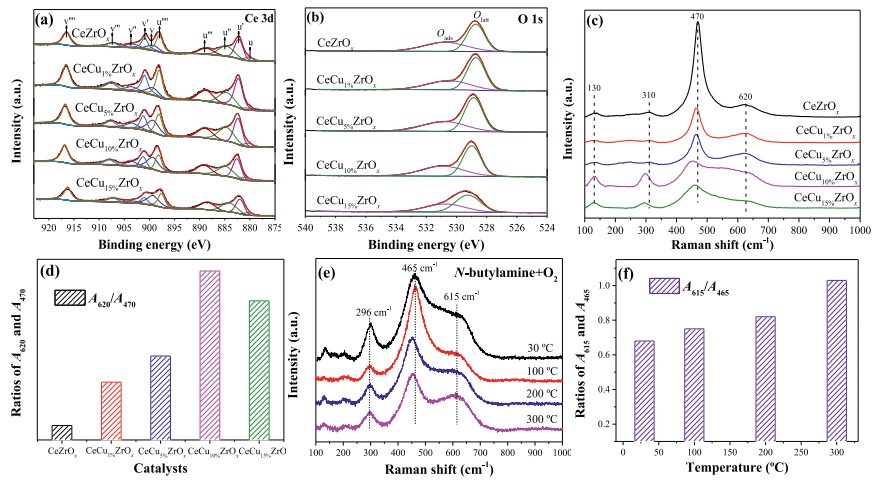
The surface chemical state of CeCuaZrOx catalysts was obtained from an XPS analysis, and the results are presented in Fig. 2. The surface compositions of the samples (Cu, Ce, Zr and O) are displayed in Table S3 (Supporting information). The XPS results for the Ce3d spectra of CeZrOx and CeCuaZrOx catalysts are shown in Fig. 2a. The labels are used to identify Ce 3d peaks, where u and v refer to the 3d3/2 and 3d5/2 spin-obit components, respectively. The peaks referred to as u, u′′, v, and v′′ were assigned to Ce3+ species and the other six peaks (u′, u′′′, u′′′′, v′, v′′′ and v′′′′) represented the presence of Ce4+ [26]. Thus, Ce was in a partially reduced state on the surfaces of the catalysts, which might be ascribed to the interaction between Cu and Ce. Moreover, the presence of Ce3+ led to a charge imbalance that was assigned to the formation of oxygen vacancies, consistent with the charge compensation. The surface Ce3+ concentration of total Ce (Ce3+ + Ce4+) on the CeCu10%ZrOx was 0.40 (Table S3), which was higher than other samples and indicted the formation of more oxygen vacancies on CeCu10%ZrOx. The high Ce3+ content in CeCu10%ZrOx might result from the increased reducibility of CeO2 caused by the synergistic effect of Cu species and Ce species. As shown in Table S3, the incorporation of Cu into these samples significantly increases the proportion of Ce3+/(Ce3+ + Ce4+). We believe that is due to the Cu species introduction and the transfer of electrons from Cu+ to Ce4+.

|
Download:
|
| Fig. 2. X-ray photoelectron spectra for (a) Ce 3d, (b) O 1s of CeCuaZrOx catalysts. Ramanspectra (c) and the concentration of surface oxygenvacancies (d) of CeCuaZrOx catalysts. In situ visible Raman spectra (e) and A615/A465 (f) of CeCu10%ZrOx. | |
Fig. 2b displays the O 1s XPS spectra for CeCuaZrOx catalysts. The main peak was observed at around 529.4 eV and assigned to the lattice oxygen of catalysts. And the shoulder peak centered at 531.5 eV could be ascribed to the chemisorbed oxygen species [27]. According to the literature, in the oxidation reaction, the surface chemisorbed oxygen is more active than lattice oxygen because of its strong mobility [28]. Moreover, the percentages of Oads/Olatt are calculated and shown in Table S3 (Supporting information). Compared with CeZrOx, higher contents of chemisorbed oxygen were observed on the surface of CeCuaZrOx, implying that Cu introduction increased the concentration of activated adsorbed oxygen species. Additionally, the percentages of Oads and Olatt in CeCu10%ZrOx (0.79) were relatively higher among all samples, suggesting that more chemisorbed oxygen species were presented on the surface of CeCu10%ZrOx. Hence, these results indicated well catalytic activity and N2 selectivity for the degradation of n-butylamine over CeCu10%ZrOx.
The comparison of Raman spectra of CeZrOx and CeCuaZrOx catalysts is shown in Fig. 2c. Raman spectra of all samples displayed an absorption band at around 470 cm−1, corresponding to the characteristic F2g vibration mode of fluorite CeO2. The broad bands at 620 cm-1 were assigned to oxygen vacancies and ascribed to the presence of defective structures in CeCuaZrOx samples. In addition, this finding also indicated the formation of Cu-Ce-Zr solid solution, which could enhance the formation of oxygen vacancies [29]. The weak band at 310 cm−1 was ascribed to the substitution of oxygen atoms from the ideal lattice positions. Finally, a weak intensity Raman peak was observed at 130 cm-1 and ascribed to Zr doping into the lattice of Ce, which led to the distortion of the framework symmetry. The intensity of the band at 470 cm-1 decreased as the copper content increased and might be related to the optical absorption of copper [30]. In addition, the existence of Cu influenced the position and intensity of the F2g band at 470 cm−1. Copper incorporation into CeZrOx led to a red shift (from 470 cm−1 to 450 cm−1) and the broadening of F2g peaks, which was related to the formation of oxygen vacancies. Meanwhile, the band at 620 cm−1 showed increasing intensity, further verifying the existence of oxygen vacancies caused by the incorporation of copper into the lattice [31]. The areas ratio of the peaks at 470 cm−1 (A470) and 620 cm−1 (A620) reflects the concentration of oxygen vacancies [29]. The A620/A470 value for CeCuaZrOx rapidly increased compared with CeZrOx (Fig. 2d), suggesting that the addition of Cu resulted in a higher oxygen vacancy concentration in CeCuaZrOx samples, and we reached a similar conclusion from the theoretical calculations. Thus, the CeCu10%ZrOx catalyst could generate more oxygen vacancies among other samples, because of the value of A620/A470 and the shift of the F2g peaks. Finally, this catalyst would promote the performance of n-butylamine selective oxidation.
In situ visible Raman spectra of CeCu10%ZrOx catalyst under a flow of n-butylamine and O2 are shown in Fig. 2e. As shown in the spectra, the main peak at around 465 cm-1 (F2g) always dominated throughout the reaction, indicating that the catalysts maintained the major fluorite-like structure [32]. The position of the F2g peak was slightly shifted toward a lower Raman peak as the reaction temperature increased from 30 ℃ to 300 ℃, due to the thermal expansion and phonon confinement. In some studies, the downward shift of F2g possibly corresponds to the thermal-induced loss of lattice O that results in the sintering of CeO2 crystals [33]. Additionally, in some cases, the shift was also in consequence of the lattice expansion and mode softening that occurred when oxygen vacancies are created [34]. The peak at 615 cm-1 was attributed to the intrinsic oxygen vacancies in CeCu10%ZrOx, which were caused by the escape of interstitial oxygen from the lattice, thus leaving oxygen vacancies in original sites [33, 35]. As shown in Fig. 2f, the ratios of A615/A465 enhanced with the increase of temperature, indicating that more oxygen vacancies were generated in the bulk phase of CeCu10%ZrOx due to the temperature-induced structural changes [33], and the increase in the number of oxygen vacancies promote n-butylamine oxidation.
Brief summary, the better catalytic performance of CeCu10%ZrOx depended on the formation of surface oxygen vacancies and chemisorbed oxygen species. Mixed valences of Ce3+ and Ce4+ were present in the CeCuaZrOx catalyst and accompanied the generation of oxygen vacancies due to Cu introduction. The surface Ce3+ concentration on CeCu10%ZrOx was higher than in other samples, indicating the formation of a greater number of oxygen vacancies, and the higher A620/A470 ratio further confirmed the higher oxygen vacancy concentration of CeCu10%ZrOx. Furthermore, the Oads/Olatt ratio in CeCu10%ZrOx was higher than in all other samples, suggesting that more chemisorbed oxygen species were presented on the surface of CeCu10%ZrOx. Hence, this catalyst displayed better performance in the catalytic oxidation of n-butylamine.
The chemical state of Cu species was investigated by UV-vis-DRs (Fig. S6). The CeCuaZrOx catalysts showed a weak band at around 450 nm, which could be assigned to a charge transfer band in Cu2+→O2−→Cu2+ [36]. In addition, the CeCuaZrOx catalysts also exhibited broad bands at around 700 nm, it corresponded to the d-d transitions of Cu2+ in octahedral symmetry. This band shifted from 650 nm to 750 nm, indicated that the coordination environment of copper species was influenced by the Cu content [37]. Furthermore, this band shifted to a longer wavelength as Cu content increased from 1 wt% to 15 wt%, which was attributed to less CuO dispersion. Cu 2p XPS spectra for CeCuaZrOx catalysts are presented in Fig. S7 (Supporting information). Two peaks centered at 932.2 and 952.1 eV were observed and potentially attributed to Cu 2p3/2 and 2p1/2 of Cu+, respectively, whereas two other peaks at 933.6 and 953.6 eV corresponded to the existence of Cu2+ [38, 39]. Meanwhile, the shake-up satellite feature centered at binding energies of around 942 and 962 eV was also observed. Both Cu+ and Cu2+ symmetrical peaks could be found in CeCuaZrOx catalysts. Moreover, the peak area of Cu2+ species was larger than that of Cu+, indicating that the characteristics Cu species predominantly present on the surface is Cu2+.
H2-TPR measurements were performed to investigate the reduction behavior of the CeCuaZrOx catalysts, and the results are presented in Fig. S8 (Supporting information). The reduction profile of CeZrOx revealed a weak reduction peak that started at approximately 450 ℃ and was centered at 600 ℃. This peak potentially corresponded to the reduction of Ce4+ to Ce3+, because the reduction of Zr4+ occurred at a temperature greater than 1000 ℃ [40, 41]. Additionally, the presence of a single peak for CeZrOx suggested that the reduction of surface and bulk CeO2 occurred concurrently because of the good oxygen mobility.
Obviously, the reduction behavior of CeZrOx catalyst was altered by copper-doping. The peak at 600 ℃ disappeared, potentially because the reduction peak of CeO2 shifted to low temperatures, which was promoted by Cu doping. The peak splitting of the H2-TPR data was performed and presented in Fig. S8b (Supporting information). The profiles of samples consisted of three peaks, which were denoted as α, β and γ. According to the literature [32, 42], the attributions of the peaks are listed below. The first peak (α) is ascribed to the reduction of highly dispersed CuO species, including isolated Cu2+ ions, and the small dimension of the Cu-O-Cu clusters. The second peak (β) is assigned to the presence of large CuO clusters. The third peak (γ) is attributed to the presence of bulk-like CuO, as well as Cu+ and Ce4+ reduction [32]. Furthermore, values for H2 consumption are present in Table S4 (Supporting information). For the CeCu10%ZrOx catalyst, the H2 consumption of peak α was 0.71 mmol/g, which was the highest value observed among the samples and proved the best redox property.
Based on the analyses described above and combined with the catalytic activity data, the superior catalytic performance of CeCu10%ZrOx compared with CeCuaZrOx catalysts could be related to the fact that CeCu10%ZrOx displayed the highest redox ability, due to the presence of the reduction peak of highly dispersed copper oxide species at a lower temperature and the highest H2 consumption of this peak among all the samples.
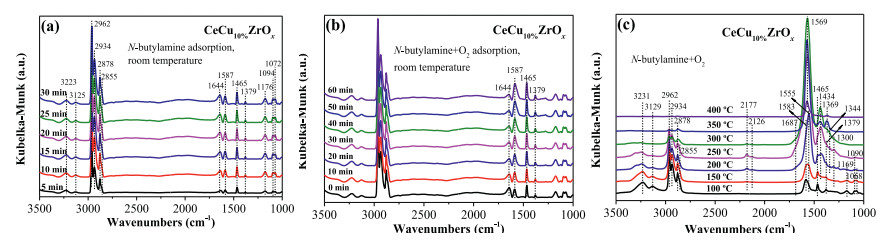
To identify surface intermediate species, we carried out in situ DRIFTs under n-butylamine and the condition of n-butylamine and O2. Fig. 3a shows in situ DRIFTs during exposure of CeCu10%ZrOx to gas mixture containing n-butylamine with helium as the balance gas at room temperature. The absorption bands of n-butylamine were observed at 3223, 3125, 2962-2855, 1643, 1588, 1466, 1378, 1173, 1094 and 1071 cm‒1. The bands at 3223 and 3125 cm−1 were ascribed to the amino group of n-butylamine, the vibrations of v(sym)NH2 and 2δNH2, respectively. The band at 1587 cm−1 was also attributed to the vibration of δNH2, and the band observed at 1094 and 1072 cm-1 were assigned to the vibration of v(CN) and t(CH2(N)) [43]. The bands centered at 2963–2855, 1466 and 1378 cm‒1 were assigned to asymmetric and symmetric bending vibrations of the C‒H bonds (v(as)CH3, v(as)CH2, v(s)CH3, v(s)CH2(N), δ(as)CH3, δ(s)CH3, respectively). Simultaneously, the band at 1173 cm‒1 was also detected and attributed to the vibration of v(C-C). The band observed at 1643 cm‒1 corresponded to the molecular adsorption of H2O. The DRIFT spectra of CeCu10%ZrOx with an exposure to 375 ppm n-butylamine and 5% O2 at room temperature are shown in Fig. 3b, it was found that adding the gaseous O2 would not change the adsorption species over CeCu10%ZrOx.

|
Download:
|
| Fig. 3. In situ DRIFTs under n-butylamine and the condition of n-butylamine + O2. | |
The catalysts were exposed to reaction conditions (375 ppm n-butylamine and 5% O2, with helium as the balance gas) to further ascertain the intermediate species of the reaction between n-butylamine and O2. Fig. 3c illustrates in situ DRIFT spectra of the CeCu10%ZrOx catalyst in a flow of n-butylamine+O2 at various temperatures. The band intensities of the adsorption spectra of n-butylamine decreased gradually as the temperature increased. While these band intensities decreased, the band intensity of ‒NH2 (1583 cm‒1) increased from 100 ℃ to 250 ℃. Additionally, some new bands appeared at a temperature above 100 ℃. The bands at 2177 and 2126 cm-1 could be assigned to adsorbed N2O [44]. The bands were observed at temperatures ranging from 150 ℃ to 300 ℃, but disappeared at temperatures above 300 ℃. The bands at 1555 and 1569 cm‒1 were also detected and attributed to monodentate nitrate species and bidentate nitrate species, respectively [19, 45]. Meanwhile, ionic nitrate (1369 cm-1) formed. Furthermore, the existence of a peak at 1434 cm‒1 indicated the formation of acetate species [46]. Notably, the acetate species was detected at 200 ℃, and its quantity increased as the temperature increased up to 300 ℃. A weak band at 1344 cm‒1 appeared at 150 ℃ was attributed to the chelation of bidentate carbonate [47]. An NH3 species was observed at 1300 cm‒1, and the band intensity increased monotonously as the temperature increased, but suddenly decreased at 300 ℃ [48].
Combining the results of DRIFT spectra and the distribution of products (Fig. 1), we were able to predict two period procedures in reaction from the formation of N2O, N2, NO, NO2 and NH3.
The following main reaction routes were proposed Eqs. 1 and 2:

|
(1) |

|
(2) |
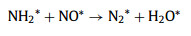
As shown in Fig. 3, the intensity of the vibration peaks at 1583 and 1555 cm‒1 increased as the temperature increased from 100 ℃ to 250 ℃. When the temperature increased from 100 ℃ to 250 ℃, some portion of NH2* was oxidized into nitrate species (1555 cm‒1, monodentate nitrate) and then NH2* reacted with surface nitrate species, leading to the production of N2 and N2O. Within this temperature range, the formation of N2 exceeded NO production. Therefore, we inferred that the reaction rate of Eq. 4 is greater than Eq. 3, and the formation of NO* (Eq. 3) is a rate-controlled step (Eqs. 3-6).

|
(3) |
|
(4) |

|
(5) |

|
(6) |
At T > 250 ℃, the gaseous O2 directly participated in the reaction, and then the NH2* was over oxidized into bidentate nitrate species. According to Fig. 3c, monodentate nitrate (1555 cm‒1) appeared at temperatures from 100 ℃ to 250 ℃ and then was further oxidized to bidentate nitrate species (1569 cm-1) at T > 250 ℃. Hence, we speculated that the reaction rate of Eq. 7 was higher than Eq. 8, most of NH2* was oxidized to stable nitrate species, and the concentration of NH2* was not sufficient for NO* reduction. At this time, the rate-controlled step was the formation of N2* (Eq. 8). Moreover, NO2 was generated through the reaction of NO with O2 at high temperatures. These processes were described by Eqs. 7–9.

|
(7) |

|
(8) |

|
(9) |
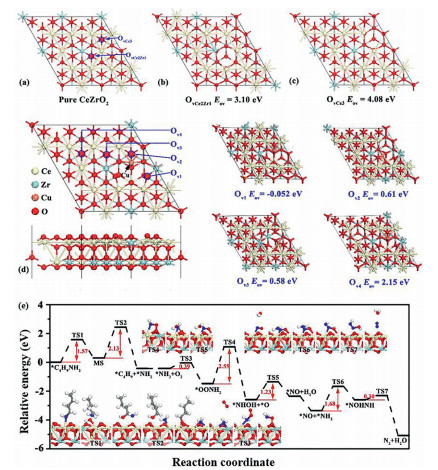
Theoretical calculations were performed to study the formation energy of oxygen vacancy, the adsorption of reactants and product molecules and the reaction mechanism. In general, oxygen vacancies play a vital role in catalytic oxidation reactions. In the present study, the formation energies of two different oxygen vacancies (labeled as OvCe2Zr1 and OvCe3) were calculated for the pure CeZrO2(111), as shown in Fig. 4a. The optimized geometry of the structures of CeZrO2(111) with OvCe2Zr1 and OvCe3 vacancies are presented in Figs. 4b and c, respectively. The calculated formation energy for OvCe2Zr1 and OvCe3 vacancies are 3.10 and 4.08 eV, respectively, indicating that the formation of O vacancy on pure CeZrO2 has certain difficulties. Moreover, the structure of the Cu-doped CeZrO2(111) was first investigated and the formation energies of four different oxygen vacancies (labeled as Ov1, Ov2, Ov3 and Ov4) were calculated, as shown in Fig. 4d. The doping of Cu promoted the formation of oxygen vacancies, as the calculated Eov values near the doped Cu (Ov1, Ov2, Ov3 and Ov4) are much lower than the formation energy of OvCe2Zr1 and OvCe3 vacancies. In particular, the calculated Eov value for Ov1 is negative, indicating that an oxygen vacancy forms spontaneously. Therefore, further computations in this study were performed using the model of a Cu-doped CeZrO2(111) slab with an Ov1 vacancy.

|
Download:
|
| Fig. 4. (a) Optimized geometry structures of pure CeZrO2(111), (b) CeZrO2(111) with OvCe2Zr1, (c) CeZrO2(111) with OvCe3 and the formation energy of oxygenvacancy. (d) Top and side views of the structure of Cu-doped CeZrO2(111) and the formation energy of oxygen vacancy (Ov1, Ov2, Ov3 and Ov4). (e) Minimum energy pathway for the dissociation of n-butylamine and the oxidation of NH2 into N2. Insets are the corresponding structures. | |
The adsorption energies of reactants and products are presented in Fig. S9 (Supporting information). The pure facets of Cu-doped CeZrO2(111) have a lower binding strength for O2, and the adsorption energy is very small (‒0.01 eV), indicating the very weak physical adsorption of O2 on this facet. Interestingly, as oxygen vacancies are introduced to the Cu-doped CeZrO2(111), the adsorption energy of O2 becomes higher, indicating that an oxygen vacancy is more conducive to the selective catalytic oxidation of n-butylamine. O2 and n-butylamine molecules display relatively stronger binding strengths (‒0.37 and ‒0.67 eV, respectively), while N2 and CO2 present very weak adsorption strengths (‒0.04 and ‒0.12 eV, respectively). The distinct adsorption strengths will potentially improve the catalytic performance of Cu-doped CeZrO2(111) in butylamine oxidation, as the reactant easily adsorbs, while the products will desorb rapidly.
The minimum energy pathway for n-butylamine oxidation was subsequently calculated to further verify the n-butylamine adsorption on the surface of the catalyst and the formation of intermediate species and N2 during the reaction. As shown in Fig. 4e, n-butylamine in the gas phase was initially adsorbed on exposed Ce atoms near the Ov1 vacancy to form an adsorbed n-butylamine molecule. First, the C‒H bond was attacked by a neighboring O to produce MS (CH3CH2CH2CHOHNH2) species; this process should overcome an energy barrier of 1.57 eV. Subsequently, the C‒N bond was dissociated into *C4H9 and *NH2 species, which will adsorb on the exposed Ce atom and the neighboring O atom, respectively.
For the selective catalytic oxidation reaction of n-butylamine, we mainly focused on the formation of N2. The transition states and reaction pathways were calculated to further confirm the mechanism of N2 generation from *NH2 species, as evidenced by in situ DRIFTs. O2 was adsorbed on oxygen vacancies (Ov1) and reacted with *NH2 species to form *OONH2 species with an energy of 0.39 eV, indicating that this reaction readily occurred. Subsequently, the O atom of *OONH2 species was attacked by the H atom of *OONH2 species, conquering a high energy barrier of 2.55 eV to produce the *NHOH species. Then, the O atom of the *NHOH species was again attacked by the H atom to form the *NO species with an energy barrier of 1.23 eV. At this time, *NO species occupied the position of the original oxygen vacancy (Ov1). The *NH2 species was adsorbed on the *NO species, and should surmount an energy barrier of 1.68 eV to obtain the *NOHNH species. Finally, the H atom of the *NOHNH species attacked the O atom to generate the end product of N2 after H2O was stripped.
In short, *NH2 was oxidized into N2 through the following steps Eqs. 10 and 11:

|
(10) |

|
(11) |
The rate-determining step of the whole process is *OONH2 = *NHOH + *O, with an energy barrier of 2.55 eV. Notably, the energy barriers were calculated without considering the effects of coverage, O2 pressure, solvent, etc. Therefore, the actual reaction barriers would be much lower, indicating that the catalytic oxidation of n-butylamine through the proposed pathway may be feasible.
In conclusion, a series of mixed CeCuaZrOx oxides were successfully synthesized and tested for n-butylamine selective catalytic oxidation. The CeCuaZrOx sample with 10% Cu showed excellent performance, exhibited 100% conversion of n-butylamine and 90% N2 selectivity at 250 ℃. CeCu10%ZrOx displayed the highest redox ability, the reduction peak of the highly dispersed copper oxide species was located at a lower temperature, and the H2 consumption of this peak is maximum. The incorporation of Cu into CeZrOx significantly increased the proportion of Ce3+/(Ce3+ + Ce4+). Additionally, more chemisorbed oxygen species and oxygen vacancies were presented in CeCu10%ZrOx. The changes in oxygen vacancies over CeCu10%ZrOx during reaction process were studied by in situ Raman spectra, and the number of oxygen vacancies gradually increased as the temperature increased. Theoretical calculations were performed to study the formation energy of oxygen vacancy, the doping of Cu could promote the formation of oxygen vacancy as the oxygen vacancies formation energy of CuCeZrOx was much lower than that of pure CeZrOx. Furthermore, the catalytic reaction mechanism underlying n-butylamine selective catalytic oxidation was proposed as described below. First, n-butylamine and O2 were adsorbed on the oxygen vacancy (Ov1), and then n-butylamine was attacked by the neighbor O to produce MS (CH3CH2CH2CHOHNH2) species. Subsequently, the C-N bond was dissociated, forming CH3-CH2-CH2-CH2* and NH2*. CH3-CH2-CH2-CH2* was further oxidized into CO2 and H2O, and NH2* could be oxidized to NO/nitrate species through important intermediate species (*OONH2 and *NHOH). Finally, NH2* reacted with NO/nitrate species, leading to the production of N2 and H2O. The results of the present study are believed to provide a deeper understanding of the catalytic mechanisms and a high-performance removal of NVOCs.
Declaration of competing interestThe authors declare that they have no known competing financial interests or personal relationships that could have appeared to influence the work reported in this paper.
AcknowledgmentsThis work is financially supported by the R & D Program of Beijing Municipal Education Commission (No. KJZD20191443001), Beijing Municipal Science and Technology Commission (No. Z181100000118003), the Fundamental Research Funds for the Central Universities and Doctoral Research Start-up Fund Project of Taiyuan University of Science and Technology (No. 20202053).
Supplementary materialsSupplementary material associated with this article can be found, in the online version, at doi:10.1016/j.cclet.2021.09.056.
| [1] |
C. He, J. Cheng, X. Zhang, et al., Chem. Rev. 119 (2019) 4471-4568. DOI:10.1021/acs.chemrev.8b00408 |
| [2] |
L.F. Liotta, Appl. Catal. B: Environ. 100 (2010) 403-412. DOI:10.1016/j.apcatb.2010.08.023 |
| [3] |
J. Yang, Y. Guo, Chin. Chem. Lett. 29 (2018) 252-260. DOI:10.1016/j.cclet.2017.09.013 |
| [4] |
M. Wang, M. Shao, S. Lu, Y. Yang, W. Chen, Chin. Chem. Lett. 24 (2013) 829-832. DOI:10.1016/j.cclet.2013.05.029 |
| [5] |
G. Wang, Z. Zhang, Z.P. Hao, Crit. Rev. Environ. Sci. Technol. 49 (2019) 2257-2313. DOI:10.1080/10643389.2019.1607443 |
| [6] |
H. Chen, Y. Yang, Q. Liu, et al., RSC Adv. 9 (2019) 8454-8462. DOI:10.1039/C8RA10636C |
| [7] |
T. Nanba, S. Masukawa, J. Uchisawa, A. Obuchi, Catal. Lett. 93 (2004) 195-201. DOI:10.1023/B:CATL.0000017076.63005.56 |
| [8] |
T. Nanba, S. Masukawa, A. Ogata, J. Uchisawa, A. Obuchi, Appl. Catal. B: Environ. 61 (2005) 288-296. DOI:10.1016/j.apcatb.2005.05.013 |
| [9] |
T. Nanba, S. Masukawa, A. Ogata, J. Uchisawa, A. Obuchi, J. Mol. Catal. A: Chem. 276 (2007) 130-136. DOI:10.1016/j.molcata.2007.06.023 |
| [10] |
R. Zhang, D. Shi, N. Liu, Y. Cao, B. Chen, Appl. Catal. B: Environ. 146 (2014) 79-93. DOI:10.1016/j.apcatb.2013.03.028 |
| [11] |
Q. Huang, S. Zuo, R. Zhou, Appl. Catal. B: Environ. 95 (2010) 327-334. DOI:10.1016/j.apcatb.2010.01.011 |
| [12] |
M. Ma, H. Huang, C. Chen, et al., Mol. Catal. 455 (2018) 192-203. DOI:10.1016/j.mcat.2018.06.016 |
| [13] |
J. Paier, C. Penschke, J. Sauer, Chem. Rev. 113 (2013) 3949-3985. DOI:10.1021/cr3004949 |
| [14] |
Z. Ma, D. Weng, X. Wu, Z. Si, J. Environ. Sci. 24 (2012) 1305-1316. DOI:10.1016/S1001-0742(11)60925-X |
| [15] |
D. Zhang, X. Du, L. Shi, R. Gao, Dalton Trans. 41 (2012) 14455-14475. DOI:10.1039/c2dt31759a |
| [16] |
Z. Wang, Z. Qu, X. Quan, et al., Appl. Catal. B: Environ. 134- 135 (2013) 153-166. |
| [17] |
Z. Si, D. Weng, X. Wu, J. Yang, B. Wang, Catal. Commun. 11 (2010) 1045-1048. DOI:10.1016/j.catcom.2010.05.011 |
| [18] |
P. Li, Y. Xin, Q. Li, et al., Environ. Sci. Technol. 46 (2012) 9600-9605. DOI:10.1021/es301661r |
| [19] |
S. Ding, F. Liu, X. Shi, et al., ACS Appl. Mater. Interfaces 7 (2015) 9497-9506. DOI:10.1021/acsami.5b00636 |
| [20] |
S. Ding, F. Liu, X. Shi, H. He, Appl. Catal. B: Environ. 180 (2016) 766-774. DOI:10.1016/j.apcatb.2015.06.055 |
| [21] |
X. Zhang, G. Dou, Z. Wang, et al., Catal. Sci. Technol. 3 (2013) 2778-2785. DOI:10.1039/c3cy00431g |
| [22] |
J. Zhu, Z. Zhao, D. Xiao, et al., J. Mol. Catal. A: Chem. 238 (2005) 35-40. DOI:10.1016/j.molcata.2005.03.036 |
| [23] |
L. Liu, Z. Yao, B. Liu, L. Dong, J. Catal. 275 (2010) 45-60. DOI:10.1016/j.jcat.2010.07.024 |
| [24] |
R. Si, Y. Zhang, S. Li, B. Lin, C. Yan, J. Phys. Chem. B 108 (2004) 12481-12488. DOI:10.1021/jp048084b |
| [25] |
G. Postole, B. Chowdhury, B. Karmakar, et al., J. Catal. 269 (2010) 110-121. DOI:10.1016/j.jcat.2009.10.022 |
| [26] |
X. Du, D. Zhang, L. Shi, R. Gao, J. Zhang, J. Phys. Chem. C 116 (2012) 10009-10016. DOI:10.1021/jp300543r |
| [27] |
X. Wang, Y. Pan, H. Ning, et al., Appl. Catal. B: Environ. 266 (2020) 118630. DOI:10.1016/j.apcatb.2020.118630 |
| [28] |
S. Wang, T. Zhang, Y. Su, et al., Catal. Lett. 121 (2007) 70-76. |
| [29] |
Z. Wang, X. Sun, J. Liu, X. Li, Surf. Interfaces 6 (2017) 103-109. DOI:10.1016/j.surfin.2016.12.003 |
| [30] |
W. Shan, W. Shen, C. Li, Chem. Mater. 15 (2003) 4761-4767. DOI:10.1021/cm0345974 |
| [31] |
D. Gamarra, G. Munuera, A.B. Hungria, et al., J. Phys. Chem. C 111 (2007) 11026-11038. DOI:10.1021/jp072243k |
| [32] |
H. He, X. Lin, S. Li, et al., Appl. Catal. B: Environ. 223 (2018) 134-142. DOI:10.1016/j.apcatb.2017.08.084 |
| [33] |
J. Xu, P. Li, X. Song, et al., J. Phys. Chem. Lett. 1 (2010) 1648-1654. DOI:10.1021/jz1004522 |
| [34] |
Y. Lee, G. He, A.J. Akey, et al., J. Am. Chem. Soc. 133 (2011) 12952-13955. DOI:10.1021/ja204479j |
| [35] |
X. Lin, S. Li, H. He, et al., Appl. Catal. B: Environ. 223 (2018) 91-102. DOI:10.1016/j.apcatb.2017.06.071 |
| [36] |
H. Praliaud, S. Mikhailenko, Z. Chajar, M. Primet, Appl. Catal. B: Environ. 16 (1998) 359-374. DOI:10.1016/S0926-3373(97)00093-3 |
| [37] |
P. Ratnasamy, D. Srinivas, C.V.V. Satyanarayana, et al., J. Catal. 221 (2004) 455-465. DOI:10.1016/j.jcat.2003.09.006 |
| [38] |
J.P. Espinόs, J. Morales, A. Barranco, et al., J. Phys. Chem. B 106 (2002) 6921-6929. DOI:10.1021/jp014618m |
| [39] |
Q. Wang, H. Xu, W. Huang, Z. Pan, H. Zhou, J. Hazard. Mater. 364 (2019) 499-508. DOI:10.1016/j.jhazmat.2018.10.067 |
| [40] |
N. Guillén-Hurtado, A. Bueno-López, A. García-García, J. Mater. Sci. 47 (2011) 3204-3213. |
| [41] |
A. Łamacz, A. Krztoń, G. Djéga-Mariadassou, Catal. Today 176 (2011) 126-130. DOI:10.1016/j.cattod.2011.01.032 |
| [42] |
E. Moretti, L. Storaro, A. Talon, et al., Microporous Mesoporous Mater. 116 (2008) 575-580. DOI:10.1016/j.micromeso.2008.05.028 |
| [43] |
G. Ramis, G. Busca, J. Mol. Struct. 193 (1989) 93-100. DOI:10.1016/0022-2860(89)80124-3 |
| [44] |
N. Oktar, J. Mitome, E.M. Holmgreen, U.S. Ozkan, J. Mol. Catal. A: Chem. 259 (2006) 171-182. DOI:10.1016/j.molcata.2006.06.024 |
| [45] |
L. Zhang, H. He, J. Catal. 268 (2009) 18-25. DOI:10.1016/j.jcat.2009.08.011 |
| [46] |
R. Zhang, P. Li, R. Xiao, N. Liu, B. Chen, Appl. Catal. B: Environ. 196 (2016) 142-154. DOI:10.1016/j.apcatb.2016.05.025 |
| [47] |
Z. Zhang, Y. Zhang, Q. Su, et al., Environ. Sci. Technol. 44 (2010) 8254-8258. DOI:10.1021/es102363f |
| [48] |
R. Guo, X. Sun, J. Liu, et al., Appl. Catal. A: Gen. 558 (2018) 1-8. DOI:10.1016/j.apcata.2018.03.028 |