 2020, Vol. 31


As a typical n-type semiconductor material, zinc stannate (ZnSnO3) has a wide band-gap of 3.2 eV at room temperature [1]. ZnSnO3 has been widely applied in many fields of bio/chemical sensing [2], photocatalysis [3], lithium ion battery [4, 5] and energy storage [6] due to its merits such as good stability, low cost and non-toxic. It should be noted that ZnSnO3 exhibits more potential applications in the field of gas sensors [7-9]. Particle size, morphology and structure of the gas sensing materials are the key factors to determine the performance of gas sensors. Various morphologies and structures of ZnSnO3 can be obtained with different synthetic methods which make differences of gas sensing performance. During the past several decades, various morphologies of ZnSnO3 were synthesized, such as nanoparticles [10, 11], one-dimensional (1D) nanowires, nanorods, nanobelts [12-14], two-dimensional (2D) nanosheets, nanofilms [15] and threedimensional (3D) nano-cubes, hollow microspheres, hollow nanocubes and hollow polyhedron [16, 17]. In order to obtain different morphologies and structures of ZnSnO3, many synthetic methods have been developed, including co-precipitation method, solidphase synthesis, ion exchange method, hydrothermal method, thermal evaporation method and sol-gel method, etc. However, the above-mentioned synthetic methods have drawbacks in operation, high reaction temperature, long reaction time or high cost, which limit practical applications. Therefore, it is necessary to develop a facile and economical synthesis method to obtain ZnSnO3.
Since 1980s, microwave-assisted method has been favored by more and more researchers in the field of chemistry [18-21]. Lu et al. [22] developed a simple calcination of W18O49 nanowires by a microwave-assisted solvothermal method to obtain flower-like WO3 structures. The NO2 and acetone sensing properties were investigated from flower-like WO3. Sun et al. [23] reported that hierarchical Pd/SnO2 nanostructures were prepared by a facile microwave-assisted method. The obtained material exhibits effective gas sensing performance toCO. Principle ofmicrowave-assisted synthesis indicates that polar molecules can rearrange under electromagnetic field with the oscillation of the electric wave.In this process, electrical energy is converted into thermal energy due to friction and dielectric loss between the molecules. Compared with the conventional heating methods, microwave heating process exhibits higher reaction rate, shorter reaction time, lower energy consumption [24-27]. Therefore, the microwave synthesis technology becomes a green chemistry synthesis method, and is widely applied to prepare micro/nano materials.
In this paper, we developed a facile and environment-friendly microwave synthesis method to prepare ZnSnO3 microspheres. Meanwhile, various morphologies of the ZnSnO3 products can be obtained by adjusting the ratio of Zn2+/Sn4+. Furthermore, the gas sensing behaviors of ZnSnO3 products with the different morphology were investigated. The results indicated that ZnSnO3 microspheres exhibited ideal selectivity and high sensitivity to ethanol vapor.
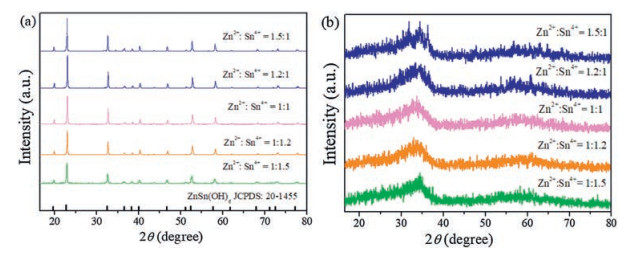
PXRD patterns of ZnSn(OH)6 and ZnSnO3 products obtained with varied ratio of Zn2+/Sn4+ are displayed in Fig. 1. As shown in Fig. 1a, all of the diffraction peaks are sharp and can be well matched to the standard card of ZnSn(OH)6 (JCPDS No. 20-1455). No peaks are observed from impurities, suggesting that ZnSn(OH)6 with high purity and good crystallization is obtained. After calcination at 400 ℃, the products only have one wide diffraction peak as shown in Fig. 1b, which is similar result as mentioned in literature [28]. It is confirmed that ZnSnO3 with amorphous structure can be obtained after calcinating ZnSn(OH)6.

|
Download:
|
| Fig. 1. (a) XRD patterns of ZnSn(OH)6. (b) ZnSnO3 products with different ratios of Zn2+ and Sn4+. | |
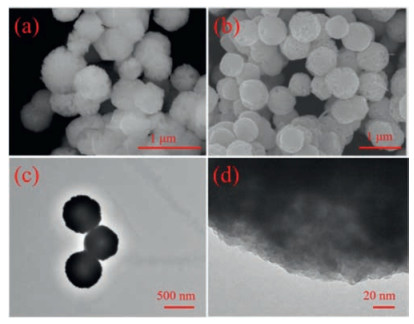
The morphologies of ZnSn(OH)6 and ZnSnO3 microspheres with the ratio 1:1 of Zn2+/Sn4+ are characterized by SEM, and (HR)-TEM in Fig. 2. Obviously, in Fig. 2a, ZnSn(OH)6 microspheres with the size distribution between 600-800 nm is self-assembled with some nanoparticles. After calcination of ZnSn(OH)6 microspheres, spherical shape ZnSnO3 with well-dispersed are formed as clear from SEM and TEM images in Figs. 2b and c. The diameter of the ZnSnO3 product is measured as ~700 nm and the surface of the microspheres is rough. Compared with the ZnSn(OH)6, surface roughness of ZnSnO3 microspheres is increased due to the loss of crystal water during calcination process. There is no lattice fringe of ZnSnO3 microspheres seen in (HR)-TEM image (Fig. 2d) so it is amorphous structure. The HRTEM result is consistent with the XRD data as shown in Fig. 1b.

|
Download:
|
| Fig. 2. SEM images of (a) ZnSn(OH)6 and (b) ZnSnO3 microspheres. (c) TEM and (d) HRTEM images of the ZnSnO3 microspheres. | |
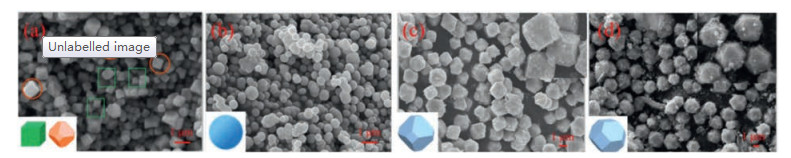
The effect of Zn2+/Sn4+ ratio on microstructure of ZnSnO3 products is further investigated by SEM. Fig. 3 shows the SEM images of ZnSnO3 products obtained with different ratios of Zn2+/Sn4+. When the ratio of Zn2+/Sn4+ is 1:1.5, abundant cubes and a few truncated octahedrons were observed in the ZnSnO3 products, and the particles size are between 500 nm and 1000 nm (Fig. 3a). When the ratio of Zn2+/Sn4+ is 1:1.2, ZnSnO3 product features irregular micro-spherical morphology with a wide diameter range of 500-900 nm (Fig. 3b). When the ratio of Zn2+/Sn4+ is 1.2:1, ZnSnO3 product has a mass of truncated octahedrons with the diameter of 1200-1800 nm (Fig. 3c).When the ratio of Zn2+/Sn4+ is 1.5:1, ZnSnO3 product is consisted of truncated polyhedrons with the diameter of 1400-1900 nm (Fig. 3d).

|
Download:
|
| Fig. 3. SEM images of the ZnSnO3 products with the varied ratio of the Zn2+ and Sn4+: (a) Zn2+/Sn4+ = 1:1.5; (b) Zn2+/Sn4+ = 1:1.2; (c) Zn2+/Sn4+ = 1.2:1; (d) Zn2+/Sn4+ = 1.5:1. The insets of (c) and (d) show the high resolution SEM images of the corresponding material. | |
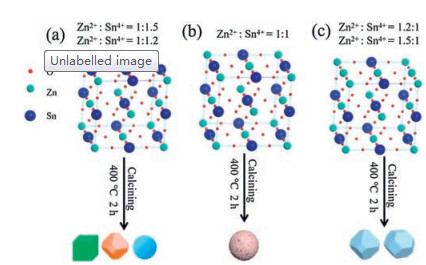
The above-mentioned experimental results indicate that the morphology of ZnSnO3 products changes from polyhedrons to microspheres to polyhedrons along with the Zn2+/Sn4+ ratio increases. Therefore, it can deduce that the atomic arrangement in the crystal cells of ZnSn(OH)6 is related to Zn2+/Sn4+ ratio (Fig. 4). With the increased Zn2+/Sn4+ ratio, excessive Zn atoms will replace and occupy the position of Sn atoms (Fig. 4a), in contrast, excessive Sn atoms will replace and occupy the position of Zn atoms (Fig. 4c), which bringing different surface energies in the same crystal plane. As a result the ZnSnO3 products present different polyhedral morphologies including cube and polyhedron, which may be contributed by the different growth kinetics in the crystal planes of ZnSn(OH)6 with various Zn2+/Sn4+ ratios.

|
Download:
|
| Fig. 4. Formation mechanism of ZnSnO3 products: (a) Zn2+/Sn4+ = 1:1.5, Zn2+/Sn4+ = 1:1.2; (b) Zn2+/Sn4+ = 1:1; (c) Zn2+/Sn4+ = 1.2:1, Zn2+/Sn4+ = 1.5:1. | |
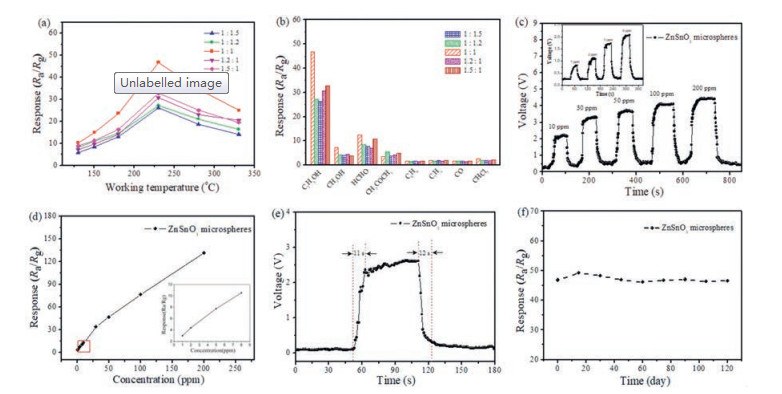
After that, the ZnSnO3 products are used as sensing material to fabricate gas sensors and its sensing properties are inspected. Firstly, important parameters of working temperature and selectivity are investigated. In order to obtain the optimum working temperature, the response of the sensors based on ZnSnO3 materials to 50 ppm ethanol are tested and shown in Fig. 5a. It can be seen that the responses of the sensors increase when temperature rises and the response reaches a maximum value at 230 ℃. Therefore, 230 ℃ is selected as the optimum working temperature for further exploring gas sensing properties of the asprepared materials. Fig. 5b shows the sensing responses of ZnSnO3-based sensors towards eight kinds of gases including C2H5OH, CH3OH, HCHO, CH3COCH3, C6H6, C7H8, CO and CHCl3 (all with concentration of 50 ppm). Obviously, the ZnSnO3 sensors exhibit a satisfactory selectivity to ethanol compared to the other gases. Also, the sensor based on ZnSnO3 material with Zn2+/Sn4+ ratio of 1:1 shows the maximum response of 47 to ethanol. Thus, ZnSnO3 material with Zn2+/Sn4+ ratio of 1:1 is optimized for ethanol detection in the following measurements.

|
Download:
|
| Fig. 5. Gas-sensing properties of the ZnSnO3 products. (a) Sensors based on ZnSnO3 products toward 50 ppm ethanol at different temperature. (b) Gas response toward 50 ppm various gases at 230 ℃. (c) Dynamic response-recovery curve of the sensor based on ZnSnO3 microspheres to 1-200 ppm ethanol; inset is 1-8 ppm ethanol. (d) Rhe relationship of gas response and concentration. (e) Response-recovery curve to 50 ppm ethanol. (f) The long-term stability of the sensor based on ZnSnO3 microspheres. | |
Fig. 5c shows the sensing curve of the micro-spherical ZnSnO3 microspheres sensor to ethanol with concentration ranging from 1 to 200 ppm at 230 ℃. When the sensor exposed to ethanol vapor, the sensor immediately outputs a voltage sensing signal. After detection, the voltage signal can be almost back to its initial value when the testing atmosphere is switched to fresh air. Our measurements also indicate that the sensor has a high sensitivity to ethanol. In Fig. 5d, the detection of limit (LOD) is better than 1 ppm since the response value is measured as 3 at the ethanol concentration of 1 ppm. It is worth noting that below 10 ppm there is a linear relation between the response values and ethanol concentrations. Fig. 5e shows the one-cycle testing curve of the sensor based on ZnSnO3 microspheres to 50 ppm ethanol at 230 ℃, which indicates that the sensor has a fast response/recovery performance to ethanol and the respond and recover time is measured as 11 s and 12 s, respectively. In addition, the sensing response is tested continuously for more than three months to evaluate the long-term stability of the sensor based on ZnSnO3 microspheres. The data in Fig. 5f indicate that there is only a slightly decrease of the sensing response after 120 days, which indicates good stability of the sensor.
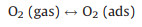
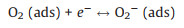
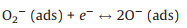
As an n-type semiconductor material, ZnSnO3 has a high concentration of charge carriers and abundant active centers existing on its surface. When the sensor is exposed to air, oxygen molecules are adsorbed on the surface of the ZnSnO3 microspheres and capture electrons from the conduction band of the sensitive material to form oxygen species such as O2- or O- [29, 30]. Therefore, an electron depletion layer (with thickness of d) is formed with the high resistance state of ZnSnO3 microspheres. Some typical reactions are shown as follows.
|
(1) |
|
(2) |
|
(3) |

|
(4) |
The chemisorbed oxygen species is mainly O- at the optimum working temperature of 230 ℃. When the sensor is exposed to ethanol vapor, the chemisorbed oxygen species react with ethanol molecules and release the electrons back to the materials. The abovementioned reaction decreases the thickness d of the electron depletion layer and a low resistance state is formed. The related reaction is explained as follows.

|
(5) |
Compared with the other ZnSnO3 products (Figs. 3b-d) in this work, the prepared ZnSnO3 microspheres feature uniform particle size with less agglomeration. In the basis of our speculation, the contact surface of the microspheres has a small grain boundary resistance, which is facilitates to electron transport and leads to enhance the gas sensing performance including sensitivity and selectivity. Thus, ZnSnO3 microspheres material is a good candidate for ethanol detection.
In summary, monodisperse ZnSnO3 microspheres with the diameters of ~700 nm are prepared by a facile and green synthesis route using microwave-assisted method. Meanwhile, ZnSnO3 products with various particle size and controllable morphology are synthesized by adjusting the ratio of Zn2+ and Sn4+. Compared with the other shapes of ZnSnO3 microstructures, ZnSnO3 microspheres exhibit superior gas-sensing properties towards ethanol vapors. The measurement results reveal that the response value of the sensor reaches 47-50 ppm ethanol vapor at 230 ℃ and the response/recovery times are 11 s and 12 s, respectively. The high sensitivity, good selectivity, short response/recovery times and satisfactory stability of the prepared sensor suggest that the micro-spherical ZnSnO3 material in this study is a reliable candidate for ethanol detection.
Declaration of competing interestThe authors declare that they have no known competing financial interests or personal relationships that could have appeared to influence the work reported in this paper.
AcknowledgmentsThis research was supported by National Nature Science Foundation of China (Nos. 61671284 and U1704255). The authors are grateful to the help of Instrumental Analysis and Research Center in Shanghai University for material characterization.
Appendix A. Supplementary dataSupplementary material related to this article can befound, in the online version, at doi:https://doi.org/10.1016/j.cclet.2020.01.004.
| [1] |
X. Wang, Y. Liu, B. Ding, et al., Sens. Actuator. B-Chem. 276 (2018) 211-221. DOI:10.1016/j.snb.2018.08.114 |
| [2] |
J. Sun, S. Bai, Y. Tian, et al., Sens. Actuator. B-Chem. 257 (2018) 29-36. DOI:10.1016/j.snb.2017.10.015 |
| [3] |
C. Liu, A. Piyadasa, M. Piech, et al., J. Mater. Chem. C 4 (2016) 6176-6184. DOI:10.1039/C6TC00887A |
| [4] |
F. Han, W.C. Li, C. Lei, B. He, K. Oshida, A.H. Lu, Small 10 (2014) 2637-2644. DOI:10.1002/smll.201400371 |
| [5] |
Y. Wang, D. Li, Y. Liu, J. Zhang, Mater. Lett. 167 (2016) 222-225. DOI:10.1016/j.matlet.2015.12.107 |
| [6] |
R. Guo, Y. Guo, H. Duan, H. Li, H. Liu, ACS Appl. Mater. Interfaces 9 (2017) 8271-8279. DOI:10.1021/acsami.6b16629 |
| [7] |
X. Jia, M. Tian, R. Dai, et al., Sens. Actuator. B-Chem. 240 (2017) 376-385. DOI:10.1016/j.snb.2016.08.146 |
| [8] |
T. Zhou, T. Zhang, R. Zhang, et al., ACS Appl. Mater. Interfaces 9 (2017) 14525-14533. DOI:10.1021/acsami.7b03112 |
| [9] |
M. Xia, H. Li, M. Li, et al., Sens. Actuator. B-Chem. 264 (2018) 119-127. DOI:10.1016/j.snb.2018.02.178 |
| [10] |
J. Li, T. Fu, Y. Chen, et al., Cryst. Eng. Comm. 16 (2014) 2977-2983. DOI:10.1039/c3ce42172d |
| [11] |
M. Miyauchi, Z. Liu, Z.G. Zhao, S. Anandan, K. Hara, Chem. Commun. 46 (2010) 1529-1531. DOI:10.1039/b921010e |
| [12] |
A. Datta, D. Mukherjee, C. Kons, et al., Small 10 (2014) 4093-4099. |
| [13] |
X. Jia, C. Cheng, S. Feng, et al., Appl. Surf. Sci. 481 (2019) 1001-1010. DOI:10.1016/j.apsusc.2019.03.198 |
| [14] |
J.M. Wu, C. Xu, Y. Zhang, et al., Adv. Mater. 24 (2012) 6094-6099. DOI:10.1002/adma.201202445 |
| [15] |
S. Singh, A. Singh, M. Wan, et al., Sens. Actuator. B-Chem. 205 (2014) 102-110. DOI:10.1016/j.snb.2014.08.026 |
| [16] |
K.Y. Lee, D. Kim, J.H. Lee, et al., Adv. Funct. Mater. 24 (2014) 6948. DOI:10.1002/adfm.201470288 |
| [17] |
X. Jia, C. Cheng, S. Yu, et al., Sens. Actuator. B-Chem. 300 (2019) 127012. DOI:10.1016/j.snb.2019.127012 |
| [18] |
Y.C. Ko, C.F. Tsai, C.C. Wang, et al., J. Am. Chem. Soc. 136 (2014) 14425-14431. DOI:10.1021/ja504804v |
| [19] |
J. Fan, B.M. De, V.L. Budarin, et al., J. Am. Chem. Soc. 135 (2013) 11728-11731. DOI:10.1021/ja4056273 |
| [20] |
X. Du, T. Yang, J. Lin, et al., ACS Appl. Mater. Interfaces 8 (2016) 15598-15606. DOI:10.1021/acsami.6b03332 |
| [21] |
N. Garino, A. Sacco, M. Castellino, et al., ACS Appl. Mater. Interfaces 8 (2016) 4633-4643. DOI:10.1021/acsami.5b11198 |
| [22] |
Z. Wang, P. Sun, T. Yang, et al., Sens. Actuator. B-Chem. 186 (2013) 734-740. DOI:10.1016/j.snb.2013.06.015 |
| [23] |
Q. Wang, C. Wang, H. Sun, P. Sun, G. Lu, Sens. Actuator. B-Chem. 222 (2015) 257-263. |
| [24] |
H. Song, S. Yan, Y. Yao, et al., Chem. Eng. J. 370 (2019) 1331-1340. DOI:10.1016/j.cej.2019.03.254 |
| [25] |
H.J. Kitchen, S.R. Vallance, J.L. Kennedy, et al., Chem. Rev. 114 (2014) 1170-1206. DOI:10.1021/cr4002353 |
| [26] |
S. Nekkanti, K. Veeramani, K.N. Praveen, et al., Green Chem. 18 (2016) 3439-3447. DOI:10.1039/C6GC00557H |
| [27] |
R. Sood, A. Donnadio, S. Giancola, et al., ACS Appl. Mater. Interfaces 8 (2016) 16897-16906. DOI:10.1021/acsami.6b02713 |
| [28] |
X. Jia, M. Tian, R. Dai, et al., Sens. Actuator. B-Chem. 240 (2016) 376-385. |
| [29] |
Y. Li, D.L. Li, J.C. Liu, Chin. Chem. Lett. 26 (2015) 304-308. DOI:10.1016/j.cclet.2014.12.002 |
| [30] |
P. Song, Q. Wang, Z. Yang, Sens. Actuator. B-Chem. 156 (2011) 983-989. DOI:10.1016/j.snb.2011.03.017 |