 2020, Vol. 31


Carbon monoxide (CO) is a colorless, odorless and nonirritating gas from incomplete combustion of carbon or carbonaceous materials. CO inhalation can lead to serious health problems. For humans, exposure to high concentration of CO gas would cause tissue damage or death [1]. Even under a low concentration, it can also be fatal to humans through long-term exposure [2, 3]. Since it is difficult to notice the existence of CO, real-time effective detection of CO is of paramount importance and development of sensitive gas detector is highly desired.
Among the various gas sensing materials, semiconducting metal oxides (SMO) have been widely investigated due to their high sensitivity, excellent selectivity and low cost [4-7]. In particular, zinc oxide (ZnO) is an excellent candidate for gas sensors with a wide direct bandgap of 3.37 eV, a large exciton binding energy of 60 meV, high electron mobility and excellent stability [8-12]. Recently, great efforts have been made to prepare ZnO materials with special morphologies, doped metal ions, and supported noble metal or semiconductor nanoparticles to enhance their performances as gas sensors in detecting various types of gases, such as CO [13-15], H2 [16-19], CH3OH [20, 21], NO2 [22-24] and H2S [25-28].
For CO detection, Arukumar et al. prepared a sensitive gas sensor by decorating Au nanoparticles on ZnO hierarchical architectures. The optimized operating temperature was 275 ℃ and the detection range was 5–1000 ppm. By changing the dosage of Au, the operating temperature could be reduced to room temperature with a negligible loss in detection range [13]. Moreover, during the detection process, the conductivity changes of the sensors which can be caused by the adsorption and the oxidation reaction of CO were taken as the detection signals.
Although the sensitivity and selectivity of the ZnO-based CO sensors have been carefully studied, detailed explorations of the mechanism of CO detection are rather limited. In the current work, aiming at obtaining the basic understanding of the fundamental characteristics of the CO detection process, we systematically investigated the CO adsorption and oxidation on the ZnO(1010) and (1120) surfaces via density functional theory (DFT) calculations. In addition, we also calculated the charge carrier concentrations at different stages of the surface processes to learn how the conductivities can change on both the surfaces.
All the calculations were performed on the basis of plane-wave DFT method by using the Vienna ab initio simulation package (VASP) code [29, 30] with the Perdew–Burke–Ernzerhof (PBE) Carbon monoxide (CO) is a colorless, odorless and nonirritating gas from incomplete combustion of carbon or carbonaceous materials. CO inhalation can lead to serious health problems. For humans, exposure to high concentration of CO gas would cause tissue damage or death [1]. Even under a low concentration, it can also be fatal to humans through long-term exposure [2, 3]. Since it is difficult to notice the existence of CO, real-time effective detection of CO is of paramount importance and development of sensitive gas detector is highly desired.
Among the various gas sensing materials, semiconducting metal oxides (SMO) have been widely investigated due to their high sensitivity, excellent selectivity and low cost [4-7]. In particular, zinc oxide (ZnO) is an excellent candidate for gas sensors with a wide direct bandgap of 3.37 eV, a large exciton binding energy of 60 meV, high electron mobility and excellent stability [8-12]. Recently, great efforts have been made to prepare ZnO materials with special morphologies, doped metal ions, and supported noble metal or semiconductor nanoparticles to enhance their performances as gas sensors in detecting various types of gases, such as CO [13-15], H2 [16-19], CH3OH [20, 21], NO2 [22-24] and H2S [25-28].
For CO detection, Arukumar et al. prepared a sensitive gas sensor by decorating Au nanoparticles on ZnO hierarchical architectures. The optimized operating temperature was 275 C and the detection range was 5–1000 ppm. By changing the dosage of Au, the operating temperature could be reduced to room temperature with a negligible loss in detection range [13].
Moreover, during the detection process, the conductivity changes of the sensors which can be caused by the adsorption and the oxidation reaction of CO were taken as the detection signals.
Although the sensitivity and selectivity of the ZnO-based CO sensors have been carefully studied, detailed explorations of the mechanism of CO detection are rather limited. In the current work, aiming at obtaining the basic understanding of the fundamental characteristics of the CO detection process, we systematically investigated the CO adsorption and oxidation on the ZnO(1010) and (1120) surfaces via density functional theory (DFT) calculations. In addition, we also calculated the charge carrier concentrations at different stages of the surface processes to learn how the conductivities can change on both the surfaces.
All the calculations were performed on the basis of plane-wave DFT method by using the Vienna ab initio simulation package (VASP) code [29, 30] with the Perdew–Burke–Ernzerhof (PBE) functional [31]. The core–electron interactions were represented by the project-augmented wave method (PAW) [32, 33], and the valence electrons of Zn (3d, 4s), O (2s, 2p) and C (2s, 2p) were treated explicitly employing a plane-wave basis-set with the kinetic energy cutoff of 400 eV. It needs to be mentioned that higher energy cutoff (450 eV) was also tested and its effects on the calculated adsorption structures and energies of CO at ZnO(1010) and (1120) are trivial (< 1%). For structure optimization, the ionic positions were allowed to relax until the forces were less than 0.05 eV/Å. The transition states (TSs) in reactions were located using a constrained optimization scheme [34-36] and were verified when all forces on atoms vanish and the total energy is a maximum along the reaction coordinate but a minimum with respect to the rest of the degrees of freedom.
The ZnO(1010) and (1120) surfaces were modeled by 4×2 and 2×2 surface slabs, respectively. The bottom two layers of both the slabs, which have six atomic layers in total, were kept fixed in all calculations (Fig. S1 in Supporting information). The vacuum between neighboring slabs was set to 15 Å along the z axis. The Brillouin-zone integration was performed using a 2×2×1 Monkhorst–Pack grid for the surfaces. The adsorption energy (Eads) was calculated as Eads =-[E(adsorbate/slab)-(Eslab+Eadsorbate)], where E(adsorbate/slab) is the total energy of the interacting system with the surface slab and adsorbate, and Eslab and Eadsorbate are the energies of the separate slab and adsorbate, respectively. Therefore, a positive Eads indicates that the adsorption process is exothermic, and the more positive the calculated adsorption energy, the stronger the adsorption is.
The exposed low-index surfaces known to dominate the nano-ZnO materials are (1010) and (1120) [37]. We first calculated the Eads of O2 at ZnO(1010) and (1120), and the results are 0.09 eV and 0.04 eV, respectively, indicating that O2 can be hardly captured by these surfaces. Therefore, we can expect that at ZnO(1010) and (1120), the possible O source for CO oxidation should be the lattice O atoms. Then, the adsorption of CO and its further oxidation at these ZnO surfaces were carefully studied.
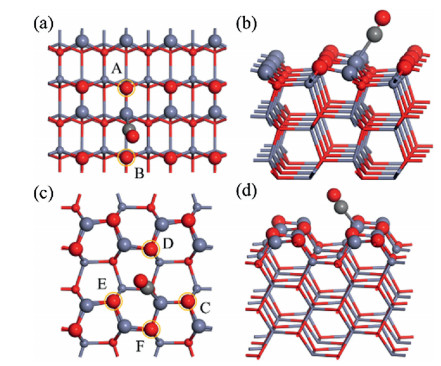
For the ZnO(1010) surface, as shown in Figs. S1a and b, it exposes three-fold coordinated O (O3c) and Zn (Zn3c). Moreover, one can also see that the exposed O3c and Zn3c bind with each other as a dimer which then sits side by side to form a protruding row. This provides equivalent chemical environment for each surface Zn3c, and there is therefore only one type of adsorption site for CO. The corresponding Eads was calculated to be 0.44 eV and the OC-Zn distance is 2.122 Å (Fig. 1). As it can be seen from Fig. 1a, two different lattice O, namely OA and OB from the same dimer and the dimer at the neighboring row, may react with the adsorbed CO. The distances of OC-OA and OC-OB were measured to be 3.537 and 2.670 Å, respectively.

|
Download:
|
| Fig. 1. Calculated structures of CO adsorption on the ZnO(1010) and (1120) surfaces from (a, c) top and (b, d) side views. The gray ball represents C. The red and purple balls represent O and Zn on the surfaces, while the atoms in the subsurface and bulk areas are plotted in small-ball and stick modes, respectively. | |
Similar to ZnO(1010), the ZnO(1120) surface also exposes protruding rows of O3c and Zn3c, though each row exhibits a zigzag configuration rather than that with side-by-side dimers (Fig. S1c and S1d). Nevertheless, all the exposed Zn3c at ZnO (1120) are also equivalent, and accordingly, there is only one CO adsorption structure (Fig. 1c). The Eads was calculated to be 0.40 eV and the OC-Zn distance is 2.124 Å. It needs to be mentioned that though ZnO(1120) has only one type of exposed lattice Zn atoms, four surface O3c with different chemical environment (OC, OD, OE and OF, Fig. 1c) exist around the adsorbed CO. The distances of OC-OC, OC-OD, OC-OE and OC-OF were calculated to be 3.414, 3.131, 2.886 and 3.283 Å, respectively. Then, the reactions between CO and these O3c at ZnO(1010) and ZnO(1120) were systematically studied.
We took the state with CO adsorption as the initial state (IS) of the surface reaction (Fig. 2), after which the adsorbed CO can move towards OA to combine with it for CO2 formation. In the transition state (TS1, Fig. 2) located through calculations, the O C-OA distance decreases from 3.537 Å to 1.808 Å. After TS1, a relatively stable intermediate CO2 complex was determined (IM1, Fig. 2), in which the bond distance between C and OA further decreases to 1.401 Å and the O- C-OA angle was calculated to be 122. In addition, the OA atom rises by about 0.03 Å in the TS1 and 0.20 Å in the IM1 along the z axis compared to its position in the IS. From the calculated energetics, we can also determine that the energy barrier for the above reaction is 0.34 eV, slightly lower than the CO adsorption energy, and the intermediate state (IM1) is about 0.04 eV more stable than the IS.

|
Download:
|
| Fig. 2. Calculated energy profile of CO oxidation by OA at ZnO(1010). The system with non-interacting surface and CO is set to zero in the energy bar. | |
In order to form the final product of gas phase CO2, the bent CO2 complex of IM1 needs to leave the ZnO(1010) surface. To locate the transition state in this desorption process, a series of calculations were performed by systematically increasing and fixing the z-axis coordinate of OA away from its position in the IM1. Interestingly, no obvious energy barrier was determined from IM1 to the final state (FS1, Fig. 2) involving gas-phase CO2 in the typical linear configuration high above the ZnO(1010) which now contains an oxygen vacancy. Furthermore, the FS1 is remarkably stable according to the calculated energies (Fig. 2). So, one may expect that CO oxidation can readily occur through reaction with lattice OA at ZnO(1010) via the meta-stable CO2 complex, leaving one oxygen vacancy at the surface.
It needs to be mentioned that surface carbonate species can be observed during the CO oxidation reactions [38], which may hinder the formation of gas-phase CO2 [39, 40]. So, we also considered the reaction of the intermediate bent CO2 complex (IM1) with a nearby O3c atom to form a tridentate carbonate (FS2, Fig. 2). The calculated relative stability of this state is actually 0.23 eV worse than that of IM1 (Fig. 2).
Unlike OA, the surface OB stays much closer to the adsorbed CO and the O C-OB distance is only 2.670 Å in the CO adsorption state, suggesting that it may be more facile for them to combine for reaction. It is interesting that no intermediate bent CO2 complex was located at this site and the adsorbed CO is directly oxidized to a gas-phase CO2 (FS3, Fig. S2 in Supporting information) following its combination with OB. From the determined transition state (TS2, Fig. S2), the corresponding energy barrier of this process was calculated to be as low as 0.09 eV. In addition, at this transition state, the OC-OB distance was determined to be 1.653 Å and the O-C-OB angle to be 115. Also from the calculated energetics, FS3 was measured to be 0.20 eV more stable than the CO adsorption state.
On the ZnO(1120) surface, as we have explained, four different types of surface lattice O (OC-OF, Fig. 1c) exist beside the adsorbed CO at a Zn3c. We first calculated the reaction between CO and OC (Fig. 3). By further shortening the distance between C and OC, we obtained the transition state (TS3), after which the intermediate state IM2 occurs. At TS3, CO moves towards OC and the distances of O C-OC as well as CO-Zn3c decrease. This transition state obtained for the formation of a bent CO2 has the structure very similar to that on the ZnO(1010) surface (OB), and the energy barrier is 0.49 eV and the OC–OC distance is 1.781 Å. Finally, the bonds of OC-OC and CO-Zn3c form in IM2 and the intermediate state has nearly the same stability as the state with the adsorbed CO.

|
Download:
|
| Fig. 3. Calculated energy profile of CO oxidation by OC at the ZnO(1120). | |
We then continued with our calculation to investigate the further reactions of the bent CO2 at ZnO(1120). We calculated the direct CO2 release and again found no energy barrier for the IM2 to evolve to the final state (FS4) with a gas phase CO2. This is similar to the case at ZnO(1010) that CO2 pull-out is a barrierless process starting from the surface CO2 species.
We also investigated the formation of carbonate as the bent CO2 in IM2 may approach the neighboring OD. This step is highly exothermic with the final state (FS5) being about 0.56 eV more stable than the IM2 state. Moreover, one can also see that the FS5 state is 0.33 eV more stable than the state with CO2 occurring in gas phase (FS4). In needs to be mentioned that we also located the transition state for this step (not shown) and obtained the corresponding energy barrier to be as high as 2.99 eV relative to IM2.
Through the same strategy, the pathways of OD and OE reactions with the adsorbed CO were also calculated, and the results are illustrated in the energy profiles in Figs. S3 and S4 (Supporting information), respectively. In the transition state (TS4) for the CO to react with OD, the OC-OD distance was determined to be 1.280 Å and the O-C-O angle to be 142. The energy barrier was estimated to be as high as 1.36 eV. Similarly, the energy barrier of CO reaction with OE was calculated to be 1.26 eV, and the OC-OE distance and O-C-O angle of the transition state (TS5) were determined to be 1.292 Å and 130, respectively. As the reaction of CO oxidation by OB at ZnO(1010), we found that in both the CO reactions with OD and OE, the CO2 molecule can directly form and desorb from the surface after the transition states.
For the CO oxidation through reaction with OF, which is just behind the adsorbed CO on the same row, we actually determined the intermediate state with the energy of 0.33 eV higher than that of CO adsorption, indicating that it is hard for CO to undergo the oxidation at this site. So this reaction path was not further investigated.
The resistance (R) of gas sensors is usually taken as the detection signal in applications. During CO adsorption and oxidation, there exists electron transfer between the reactant/ product and the sensor surface, resulting in its electrical property change. In addition, conductance (G) is the reciprocal of R and can be expressed to be G=σA/l, where s is the conductivity and A and l are the cross-sectional area and length of the conductor, respectively. So, G is directly proportional to s. Furthermore, the conductivity of semiconductors can be written as σ=nqμ, where n, q and μ are the concentration, charge and mobility of carriers, respectively [41-43]. There are two types of carriers in semiconductors, which are the free electrons and holes. Specifically, ZnO is a typical n-type semiconductor, which means that its main carriers are the free electrons. Accordingly, the conductivity of the ZnO(1010) and (1120) surfaces can be estimated by σ = neqeμe, where ne, qe and μe are the electron concentration, charge and mobility, respectively [44-47]. In addition, μe is the function of temperature only. Consequently, ne can be taken as the descriptor to learn the trend of the conductivity change at ZnO(1010) and (1120) during the surface processes involving CO.
In this work, ne in the conduction band is given by as follow:

|

|

|
where N(E) is the density of states for free electrons; f(E) is the probability distribution for Fermions; E is defined as the probability to be occupied by an electron; and k is the Boltzmann constant. Because it is very difficult to solve analytically for f(E), Boltzmann approximation where the denominator is purely exponential has to be used. So ne is given as follows:

|
In addition, T is set as 300 K to simulate the practical state of ZnO surface in current work. As shown in Fig. 4 and Table S1 (Supporting information), at ZnO(1010), ne increases with CO adsorption (IS) and then decreases following its oxidation by surface lattice O (IM, FS), and the same trend was also found at ZnO (1120). Moreover, we also calculated the Bader charges of C and O in CO (CCO and OCO), and the average ones of O and Zn in ZnO (OZnO and ZnZnO) at ZnO(1010) and (1120) (Tables S2 and S3 in Supporting information). The results show that some electrons will transfer from CO to ZnO after CO adsorption, and at IMs, these electrons will back to CO. This trend is consistent with that of ne at ZnO(1010) and (1120).

|
Download:
|
| Fig. 4. Calculated ne at ZnO(1010) and (1120) at different reaction stages. | |
In this work, we have performed systematic calculations on CO adsorption and oxidation at ZnO(1010) and (1120), which are the two major surfaces exposed at ZnO nanomaterials, aiming at understanding their performances as gas sensors. Firstly, our calculated results show that the adsorption of O2 molecule can hardly occur at these clean ZnO surfaces due to the very low adsorption energies, and therefore it may not affect the CO adsorption or induce its oxidation. In fact, the adsorptions of other species like atomic O and CO2 were also calculated and they were found to be quite weak as well. Therefore, such species will not interfere with the surface processes and detection of CO too. The relatively strong adsorptions of CO were determined with Eads higher than 0.4 eV at the two surfaces. For ZnO(1010), two different types of O3c (OA and OB, Fig. 1) exist beside the adsorbed CO, which may directly react with it. Our calculated results show that the O3c at the neighboring ZnO row has much higher activity compared with the one forming the same ZnO dimer with the Zn where the CO sits, though the barriers for the CO reactionwith both the surface lattice O3c are quite small (0.34 eV for OA and 0.09 eV for OB). We found that the OA-Zn-C angle changes from ~123° in the CO adsorption state to ~51° in TS1, while the OB-Zn-C angle only slightly changes from ~56° in the CO adsorption state to ~34° in TS2. These results then suggest that OA is less active because that significant structural distortion is required for it to achieve the transition state with CO.
Compared with ZnO(1010), the ZnO(1120) surface exhibits quite different atomic configurations, though both the surfaces expose Zn3c and O3c. Accordingly, at ZnO(1120), there exist four types of O3c beside the adsorbed CO. Among these O3c atoms, the one right beside the adsorbed CO on the same side of the Zn3c-O3c zig-zag row (OC) was determined to be the most active one to oxidize CO with the barrier of 0.49 eV only. For the two nearby O3c that has almost the same chemical environment (OD and OE), they performed in a similar way toward CO oxidation. Particularly, for the corresponding transition states of TS4 and TS5, they both occur with the break of the Zn-C bond, which could be the reason for the rather high barriers of the CO oxidation by OD and OE.
From the calculated reaction barriers, we can conclude that the OB and OC are the most active species at the ZnO(1010) and (1120) surfaces, respectively. Moreover, the OB species is even more active than OC (barrier: 0.09 vs. 0.49 eV), suggesting that the ZnO(1010) surface generally exhibits higher catalytic activities than (1120). This difference can be also understood from their bonding configurations. Though both OB and OC are three-fold coordinated, the former binds with one unsaturated Zn3c and two fully coordinated Zn4c, whereas the latter binds with two unsaturated Zn3c and one fully coordinated Zn4c. Considering that unsaturated Zn atoms are clearly much more active than the saturated ones, one can expect that the O3c at ZnO(1120) would be more strongly bonded by the two Zn3c, and the relatively weakly bonded O3c at ZnO(1010) therefore gives higher reactivity.
Additionally, the various products of CO oxidation at ZnO(1010) and (1120) were also investigated. From the calculated energy profiles in Figs. 2 and 3, we are able to tell that once the bent CO2 species occurs at the surfaces as the intermediate, it is easy to leave the surface as a CO2 molecule with no obvious barrier. However, it should also be noted that carbonate formation might be competing with the CO2 desorption. At ZnO(1010), the carbonate species is thermodynamically less stable than the corresponding gas-phase CO2. This is because that the dangling bonds of the bent CO2 are too far away from any adjacent O3c (~3.5 Å) in IM1. So, during the evolution process from IM1 to FS2, it has to break the original OC—O bond together with a serious surface distortion. Thus, FS2 is not so stable as FS1. By contrast, at ZnO(1120), the carbonate species is much more stable than the gas-phase CO2, largely because that no obvious structural distortion occurs after the formation of the carbonate species (FS5) and almost all the rest of surface atoms in FS5 keep their original positions. However, because the original OC—Zn bonds still need to be broken and the new surface bonds will be formed during the formation of carbonate species, there exists a relatively high barrier (2.99 eV) from IM2 to FS5. Thus, at ZnO(1120), it is hard to form the carbonate species during the CO oxidation, and CO2 is indeed the main product of CO oxidation at both ZnO(1010) and (1120)
Furthermore, the detection signals (resistances) of ZnO-based sensors in practical applications were studied via the calculated electron concentrations of ZnO(1010) and (1120) during CO adsorption and oxidation. First of all, the ne of clean ZnO(1010) and (1120) were determined as zero, being consistent with previous theoretical and experimental studies [48, 49]. Then, after CO adsorption, the ne would drastically increase to ~1021 cm-3 and decrease to ~1018 cm-3 during oxidation processes, which are also close to the determined ne of doped ZnO materials [50, 51]. It was mainly caused by electrons transferring from CO to ZnO during adsorption processes and back to CO (to form CO2) in oxidation reaction. As mentioned above, the resistance is inversely proportional to the electron concentration. So, in practical applications, the detection signal (R) will continuously decrease once the ZnO-based sensor are exposed to the air with some amount of CO, due to the adsorption and oxidation of CO; and when these processes reach equilibrium, the signal will become stable. Finally, after cutting off the CO source, the surface oxidation reaction by oxygen in the air would fully recover its stoichiometry so that the signal will increase. This trend is in fact consistent with the reported experiment results [6, 13-15].
In this work, we have performed DFT calculations to study the interactions between CO molecules and lattice oxygen of ZnO (1010) and (1120) surfaces. These reactions are closely related to the performance of ZnO-based materials as the CO gas sensors. Our calculations show that the surface lattice O can be directly involved in CO oxidation. We determined that the under-coordinated O3c of ZnO(1010) is more reactive compared to that of ZnO(1120). As the direct product of this combination reaction, the surface CO2 complex can readily leave the surfaces without any obvious barrier. The barriers of the whole reaction pathways are all relatively low, which indicates that ZnO-based CO sensors can work at relatively low temperatures. Besides, we also found that the formation of the surface carbonate species through further reaction of the CO2 complex with the surface O is rather difficult, suggesting that the effects of carbonate formation would be insignificant at this surface in competition with gas-phase CO2 formation. Moreover, the calculated free electron concentrations were utilized to estimate the conductivity changes of the surfaces at different stages of the surface processes, and their variation trend shows that the conductivities (or resistances) can be indeed taken as the signals for CO detection.
Declaration of competing interestThe authors declare that they have no known competing financial interests or personal relationships that could have appeared to influence the work reported in this paper.
AcknowledgmentsThis work was supported by National Key R & D Program of China (No. 2018YFA0208602), National Natural Science Foundation of China (Nos. 21825301, 21573067, 21421004) and Program of Shanghai Academic Research Leader (No. 17XD1401400). The authors also thank the National Super Computing Center in Jinan for the computing time.
Appendix A. Supplementary dataSupplementary material related to this article can be found, in the online version, at doi:https://doi.org/10.1016/j.cclet.2019.10.027.
| [1] |
P. Rodlamul, S. Tamura, N. Imanaka, J. Ceram. Soc. Jpn. 126 (2018) 750-754. |
| [2] |
World Health Organization, WHO Guidelines for Indoor Air Quality: Selected Pollutants, (2010).
|
| [3] |
K.Z. Qi, G.C. Wang, W.J. Zheng, Surf. Sci. 614 (2013) 53-63. |
| [4] |
D. Punetha, S.K. Pandey, IEEE Sens. J. 19 (2019) 2450-2457. |
| [5] |
T. Nandy, R.A. Coutu, C. Ababei, Sensors 18 (2018) 3443.
|
| [6] |
J.K. Lee, W.S. Lee, W.I. Lee, et al., Phys. Status Solidi A. 215 (2018) 1700929. |
| [7] |
M. Hjiri, L. El Mir, S.G. Leonardi, et al., Sens. Actuators B-Chem. 196 (2014) 413-420. |
| [8] |
L. Zhu, W. Zeng, Sens. Actuators A-Phys. 267 (2017) 242-261. |
| [9] |
K.Z. Qi, X.H. Xing, A. Zada, et al., Ceram. Int. 46 (2020) 1494-1502. |
| [10] |
K.Z. Qi, B. Cheng, J.G. Yu, W.K. Ho, J. Alloys. Compd. 727 (2017) 792-820. |
| [11] |
K.Z. Qi, Q. Qin, X.C. Duan, et al., Chem. Eur. J. 20 (2014) 9012-9017. |
| [12] |
K.Z. Qi, J.Q. Yang, J.Q. Fu, et al., CrystEngComm 15 (2013) 6729-6735. |
| [13] |
S. Arunkumar, T. Hou, Y. Kim, et al., Sens. Actuators B-Chem. 243 (2017) 990-1001. |
| [14] |
R. Dhahri, M. Hjiri, L. El Mir, et al., J. Phys. D Appl. Phys. 49 (2016) 135502. |
| [15] |
X. Pan, X. Zhao, Sensors 15 (2015) 8919-8930. |
| [16] |
O. Lupan, V. Cretu, V. Postica, et al., Sens. Actuators B-Chem. 223 (2016) 893-903. |
| [17] |
K. Yadav, S.K. Gahlaut, B.R. Mehta, J.P. Singh, Appl. Phys. Lett. 108 (2016) 071602.
|
| [18] |
S.M. Mohammad, Z. Hassan, R.A. Talib, et al., J. Mater. Sci. 27 (2016) 9461-9469. |
| [19] |
S.W. Fan, A.K. Srivastava, V.P. Dravid, Appl. Phys. Lett. 95 (2009) 142106. |
| [20] |
R. Paulraj, P. Shankar, G.K. Mani, L. Nallathambi, J.B.B. Rayappan, J.Mater. Sci. 28 (2017) 10799-10805. |
| [21] |
T.Y. Tiong, C.F. Dee, A.A. Hamzah, B.Y. Majlis, S.A. Rahman, Sens. Actuators BChem. 202 (2014) 1322-1332. |
| [22] |
J. Wang, X. Li, Y. Xia, et al., ACS Appl. Mater. Interfaces 8 (2016) 8600-8607. |
| [23] |
M.R. Alenezi, S.J. Henley, N.G. Emerson, S.R.P. Silva, Nanoscale 6 (2014) 235-247. |
| [24] |
L.M. Yu, F. Guo, S. Liu, et al., J. Alloys. Compd. 682 (2016) 352-356. |
| [25] |
A. Gusain, N.J. Joshi, P.V. Varde, D.K. Aswal, Sens. Actuators B-Chem. 239 (2017) 734-745. |
| [26] |
B.H. Zhang, M. Li, Z.L. Song, et al., Sens. Actuators B-Chem. 249 (2017) 558-563. |
| [27] |
Z.S. Hosseini, A. Irajizad, A. Mortezaali, Sens. Actuators B-Chem. 207 (2015) 865-871. |
| [28] |
J.F. Deng, Q.Y. Fu, W. Luo, et al., Sens. Actuators B-Chem. 224 (2016) 153-158. |
| [29] |
G. Kresse, J. Hafner, Phys. Rev. B 47 (1993) 558-561. |
| [30] |
G. Kresse, J. Hafner, Phys. Rev. B 49 (1994) 14251-14269. |
| [31] |
J.P. Perdew, K. Burke, M. Ernzerhof, Phys. Rev. Lett. 77 (1996) 3865-3868. |
| [32] |
P.E. Blochl, Phys. Rev. B 50 (1994) 17953-17979. |
| [33] |
G. Kresse, D. Joubert, Phys. Rev. B 59 (1999) 1758-1775. |
| [34] |
A. Alavi, P. Hu, T. Deutsch, P.L. Silvestrelli, J. Hutter, Phys. Rev. Lett. 80 (1998) 3650-3653. |
| [35] |
D. Wang, J. Jiang, H.F. Wang, P. Hu, ACS Catal. 6 (2015) 733-741. |
| [36] |
H.F. Wang, Z.P. Liu, J. Am. Chem. Soc. 130 (2008) 10996-11004. |
| [37] |
D.J. Cooke, A. Marmier, S.C. Parker, J. Phys. Chem. B 110 (2006) 7985-7991. |
| [38] |
T. Arai, K. Maruya, K. Domen, T. Onishi, Chem. Lett. 1 (1989) 47-50. |
| [39] |
Y. Madier, C. Descorme, A.M. Le Govic, D. Duprez, J. Phys. Chem. B 103 (1999) 10999-11006. |
| [40] |
M. Boaro, F. Giordano, S. Recchia, et al., Appl.Catal.BEnviron. 52 (2004) 225-237. |
| [41] |
J.M. Ziman, Principles of The Theory of Solids, World Book Inc, Beijing, 2009.
|
| [42] |
S. Mehraeen, V. Coropceanu, J.L. Bredas, Phys. Rev. B 87 (2013) 195209.
|
| [43] |
J.P. Heremans, B. Wiendlocha, A.M. Chamoire, Energ. Environ. Sci. 5 (2012) 5510-5530. |
| [44] |
M. Boujnah, M. Boumdyan, S. Naji, et al., J. Alloys. Compd. 671 (2016) 560-565. |
| [45] |
Q.Y. Hou, J.J. Li, C.W. Zhao, C. Ying, Y. Zhang, Physica B 406 (2011) 1956-1960. |
| [46] |
D. Fruchart, V.A. Romaka, Y.V. Stadnyk, et al., J. Alloys. Compd. 438 (2007) 8-14. |
| [47] |
T. Yamamoto, Phys. Status Solidi 193 (2002) 423-433. |
| [48] |
M. Saha, S. Ghosh, V.D. Ashok, S.K. De, Phys. Chem. Chem. Phys. 17 (2015) 16067-16079. |
| [49] |
A. Nakrela, N. Benramdane, A. Bouzidi, et al., Results Phys. 6 (2016) 133-138. |
| [50] |
Z.H. Wang, Z.W. Tian, D.M. Han, F.B. Gu, ACS Appl. Mater. Interfaces 8 (2016) 5466-5474. |
| [51] |
D. Gaspar, L. Pereira, K. Gehrke, et al., Sol. Energy Mater. Sol. Cells 163 (2017) 255-262. |