 2020, Vol. 31


b West China School of Stomatology, Sichuan University Chengdu 610041, China;
c West China School of Public Health and Healthy Food Evaluation Research Center, Sichuan University, Chengdu 610041, China
Carbon quantum dots (CQDs), as a new member of fluorescent nanomaterials, has attracted more and more attention owing to their unique properties including low cytotoxicity, environmental friendliness, chemical stability, electronic properties and broad excitation spectra [1-6]. Because of their advantages, CQDs can be widely applied to photocatalysis [7-9], sensors [10-12], lasers [13, 14], bio-imaging [2, 15-21], drug or gene delivery [22-24] and photodetectors [25]. However, there are still some obvious deficiencies limiting CQDs' applications, for example, the relatively low quantum yield and fewer biology functions. In order to improve the CQDs' performance and explore their other potential applications, various methods have been reported, such as surface modification and element doping [26, 27, 40]. Doping CQDs with heteroatoms is an effective way to increase the quantum yield and adjust their physicochemical features and photoluminescence [28, 29]. Among these approaches to form element-doping CQDs, the most common one is hydrothermal synthesis with citric acid (CA) and ethylenediamine (ED) as the raw materials to obtain the N-doped CQDs. Moreover, as another commonly adopted method, surface modification can improve the functionality and biocompatibility of nanometer materials for applications. For example, folic acid (FA), a biological micromolecule which plays a necessary role in various physiological functions, has been broadly used to modify nanometer materials to distinguish the tumor cells from normal cells. Grafting fluorescent nanoparticles with FA for targeted tumor imaging and targeted drug delivery have attracted significant attention [6, 30-34].
As these functionalized products of CQDs have gained increas-ing attention, there are growing concerns about the potential toxicity of these modified materials in biosystem. Plenty of published studies have reported that carbon material, such as graphene or graphene oxide, could cause serious pulmonary inflammation upon inhalation [35]. Meanwhile, surface function-alized carbon materials with improved property in physiological environments exhibit fewer toxic reaction both in vitro and in vivo [36, 37]. Md Nurunnabi et al. demonstrated that the graphene quantum dots did not show any mentionable toxicity in several vital organs and were safe for biological application [38]. However, Guo et al. showed that graphene quantum dots could result in various embryonic malformation and increase in embryonic mortality [39].
Although evaluation has been made regarding the biosafety and biocompatibility of CQDs after different functional modifications, no systemic comparisons have been reported in vitro and in vivo, which is particularly essential for prospective biological applications of these modified materials. As a promising class of functional CQDs, no research regarding fluorescence imaging by FA-CQDs in vivo has been reported and related toxicity study has not been done to date as well. In this study, we selected two functionalized CQDs and original CQDs to assess their toxicology in vitro and in vivo. The physicochemical property of these CQD materials and their biological behaviors were observed in vitro. A systematic and comprehensive toxicology analysis of these materials was performed in vivo. On the other hand, distribution and clearance of these materials, inflammatory reaction and pathological changes of vital organs were also studied. Both the in vitro and in vivo biological safety evaluation of CQDs were made using different cell lines and animals. The purpose of the multifarious biochemical tests is to detect whether the functionalized products of CQDs could influence the biological indicators at different concentration, and closely compare the physical condition of experimental animals with those treated by PBS. Our combined findings in vitro and in vivo through toxicity tests may eventually promote the biological application of these modified materials, such as cancer diagnosis, biological imaging, gene therapy and drug delivery.
First of all, pristine CQDs and its derivatives were synthesized by several methods described previously [41-45]. In brief, the fluorescent CQDs were obtained by one-step hydrothermal treatment using citric acid (purchased from J & K Chemicals, China) as the carbon source, and the N-doped CQDs used ethylenediamine as the nitrogen source. FA-CQDs were made by amidation reaction using EDC and NHS as the cross-linking agent. The details of synthetic process were described in Supporting information. Transmission electron microscopy (TEM) was used to characterize the morphology and size of these materials. TEM observation showed that the CQD materials were torispherical and uniform dispersion without apparent aggregation. Fig. 1 shows the size distribution histogram of CQD, NCQD, FA-CQD, which varied from 3.76 nm to 9.38 nmwith a mean value of around 6.99 nm, 5.18 nm and 7.23 nm, respectively. The inset pictures of Fig. 1 were high-resolution TEM (HRTEM) images, which revealed that the well-resolved lattice structure had formed with ~0.316, ~0.357 and ~0.321 nm spacing distance and agreed well with the (002) in-plane lattice spacing of graphite. The lattice parameters of the CQD materials accorded with the X-ray diffraction (XRD) pattern (Fig. S1b in Supporting informa-tion), similar to the previous reports about CQDs [38], which indicated that CQDs may be formed from a large and integrated sp2 domain.

|
Download:
|
| Fig. 1. Characterization of the CQD materials: (a) TEM images of CQDs (with HRTEM image and size distribution inset), (b) NCQDs (with HRTEM image and size distribution inset) and (c) FA-CQDs (with HRTEM image and size distribution inset). | |
The chemical structure of CQDs and its functional modification materials were investigated by FT-IR measurements. The FTIR spectra (Fig. S1c in Supporting information) show the absorption bands at 3398 and 3261 cm-1 corresponding to v(O-H) and v(N-H) stretching vibrations. The strong peaks at 3081 and 2939 cm-1 were related to the stretching vibrations of v(=C-H) and v(-C-H). The spectrum of NCQD shows v(C=O) stretching peak of carboxyl and acetyl at 1697 and 1769 cm-1, and shows a v(C=N) stretching peak at 1559 cm-1. Meanwhile, absorption peaks at 1439 cm-1, 1383 cm-1 resulted from δ(C–H). X-ray photoelectron spectroscopy (XPS) spectrum confirmed the existence of nitrogen element in the NCQDs, which assured that the nitrogen atom had been doped into the CQDs successfully. Next, the high-resolution XPS analysis of C 1s, N 1s, and O 1s spectra was presented in Fig. 2. The high-resolution C 1s spectrum could be fitted into four peaks at 284.7, 285.8, 286.3, and 287.8 eV, which corresponded to sp2 C in C=C, sp3 C in C-N, C-O, and C=O, respectively. The N 1s spectrum shows three characteristic peaks corresponding to pyridinic nitrogen at 398.5 eV, pyrrolic nitrogen at 399.3 eV, and graphitic nitrogen at 400.6 eV. The high-resolution O 1s spectra indicated two different types of oxygen bonds: C=O and C-O-C/C–O–H at 531.8 eV and 533.0 eV, respectively. The typical peaks suggested the existence of -OH, –NH2 and -COOH groups on the surface of the NCQDs.

|
Download:
|
| Fig. 2. XPS spectra of NCQDs and high resolution C 1s, N 1s and O 1s spectra of NCQDs. | |
The folate functionalization CQDs (FA-CQDs) were formed through an EDC/NHS crosslinking reaction between the amino groups on the CQDs and the carboxyl groups on FA. As shown in Fig. S1d (Supporting information), the UV–vis absorption spectrum of obtained FA-CQDs shows characteristic absorption peaks of FA at 278 nm and 340 nm, which indicated that the FA had been functionalized onto the surface of the CQDs successfully. Meanwhile, the zeta potentials of the CQDs, NCQDs and FACQDs were determined to be -8.35±0.51, -6.87±0.68 and -19.27±0.37 mV (pH 7.4).
To analyze the relevant optical properties of the CQDs and its functional modification materials, UV–vis absorption and PL spectra were recorded. In Fig. S1a (Supporting information), the solutions show pale-yellow color under visible light. When excited under ultraviolet (UV) light (365 nm), the CQDs, NCQDs and FA-CQDs (1 mg/mL) displayed a bright blue fluorescence. UV–vis absorption spectra of these materials showed that there were two peaks at 240 nm and 345 nm, which were attributed to the n–π* transition of C=O and the π–π* transition of C=C, respectively. Photoluminescence (PL) is an important feature of the fluorescent nanomaterials. As shown in Fig. S2 (Supporting information), the CQDs exhibited excitation-dependent PL behavior with the excitation wavelength of CQDs from 300 nm to 420 nm, NCQDs from 390 nm to 510 nm, and FA-CQDs from 360 nm to 480 nm. Meanwhile, the strongest emission bands located at λ = 459, 554, and 507 nm for CQDs, NCQDs, and FA-CQDs, respectively, and the corresponding excitation bands appeared at λ = 338, 469, and 418 nm, respectively.
The cellular uptake behavior of these materials was observed via laser confocal scanning microscopy (LCSM) with FR + rat c glioma cells (C6) cells as a model. The C6 cells were co-cultured with CQD materials (1 mg/mL) emitting blue fluorescence. To observe the changes that had taken place over time, the cell imaging at 0.5 h, 1 h, 2 h after adding CQD materials were collected(Fig. 3a). The L929 cells lines were selected to evaluate the cellular localization of the CQD materials (Fig. 3b). The cell membrane of the L929 cells were stained by Dil. Compared with the CQDs, the NCQDs and FA-CQDs exhibited a brighter blue fluorescence emission in cells. Meanwhile, the cells incubated with FA-CQDs showed bright fluorescence on the membrane and in the cytoplasm, which suggested that the FA-CQDs could be efficiently delivered into the cancer cells by receptor-mediated endocytosis because of the existence of the FR in the cancer cell membrane. The CQDs and its functional modification materials can be transferred into the cells and retained both in the cell membrane and in the cytoplasm.

|
Download:
|
| Fig. 3. Confocal laser scanning microscopic (CLSM) images of (a) C6 cells incubated with the CQDs materials and (b) L929 cells incubated with the CQDs materials (scale bar =50 μm). | |
Toxicity is an important factor for nanomaterials that can limit their biological applications. CCK-8 (Cell Counting Kit) assays and LDH (lactate dehydrogenase) release test were performed to examine the viability of cells, and to assess the cytotoxicity of CQDs materials. Mouse fibrocytoma cells (L929) and Madin-Darby canine kidney (MDCK) cells were co-cultured with different concentration of CQDs materials for 24 h and 72 h respectively. The cell viability and LDH leakage were estimated as the following equations, respectively:

|
(1) |

|
(2) |
As the concentration of these materials increased from 250 μg/mL to 1 mg/mL, the viability of L929 cells remained above 75% and MDCK cells' viability only slightly decreased after incubation with CQDs materials for 72 h. The MDCK cells incubated with FA-CQDs still remained above 95% viability after 72 h, particularly. However, at the high concentration of 2 mg/mL, Figs. S3a-f (Supporting information) show that the L929 cells reduced to 60%~70% viabilityandMDCK cells reduced to 70%~80% viability after 72 h. From the results of the LDH release test (Figs. S3g and h in Supporting information), compared with the MDCK cells, L929 cells exhibited a higher LDH releasing rate especiallyfor theNCQDs. It is worthmentioning that both CCK-8 assay and LDH release test show high cell viability and low LDH release rate of theMDCK cells culturedwith the FA-CQDs, which indicated that the FA-CQDs may not be taken through the normal FRcellmembrane, and thus cannot lead to an obvious toxicity. These results demonstrated that cell mortality rate and LDH leakage were positively correlated with the concentration of CQDs materials contained in the medium, and the CQDmaterials had low cytotoxicityand good biocompatibility even when the concentrations rose to 1 mg/mL. Meanwhile, these findings also demonstrated that the FA-CQDs can be used as a targeting drug carrier for distinguishing the cancer cells with overexpressed folic receptor.
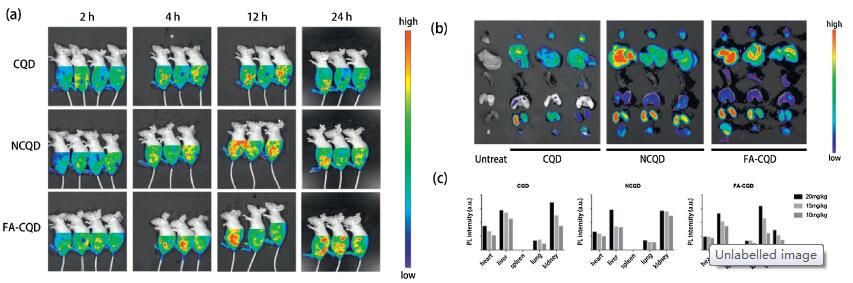
The in vivo fluorescence bioimaging of CQD materials was performed to further explore their fluorescent property and biodistribution. After the CQD, NCQD, FA-CQD (10, 15 and 20 mg/kg dosage) or PBS were injected into Balb/c nude mice intravenously, noninvasive images of these mice were taken directly. As shown in Fig. 4a, no obvious signals were observed immediately from the deep organs such as heart, liver, lung, or spleen after the injection of the CQD materials. However, at 12 h post injection of the FA-CQDs, a fluorescence signal was captured from the tumor tissues, which also indicated that the FA-CQDs could be applied to detect FR + superficial tumor and target drug delivery. After 12 h of intravenously injecting the CQD materials, many very bright dots were captured by the imaging system. At 24 h post injection, only few fluorescence signals were captured in 10 and 15 mg/kg dosage groups. Otherwise, there was still some bright fluorescence signal in the 20 mg/kg dosage groups perhaps due to the high concentration of the materials. To evaluate the biodistribution of these materials, the isolated organs including heart, liver, spleen, lung and kidney were imaged (Fig. 4b) and their PL intensity were analyzed (Fig. 4c) at 24 h after injection. There was significant fluorescence signal from liver and kidney of mice treated with CQD materials, which indicated that the CQD materials mainly accumulated in the liver, kidney, and in the heart as well. As observed from the fluorescence images in vivo, the kidney accumulation greatly increased at 12 h after intravenous injection, which suggested that the CQD materials might be excreted by the kidneys, probable because they were nanoscale particles. The results demonstrated that these nanoparticles spread over the entire body via systemic circulation and concentrated in different organs up to 12 h after intravenous injection. The fluorescence signal at 24 h after injection was lower than that at 12 h after injection, the probable reason for this situation was the excretion of these fluorescence materials.

|
Download:
|
| Fig. 4. (a) In vivo fluorescence bioimaging of CQD materials in nude mice (10, 15, 20 mg/kg and control group, from right to left). (b) Fluorescent images and (c) PL intensities from isolated organs at 24 h post injection of different dosages materials (10, 15, 20 mg/kg). | |
For clinical applications, it is essential that the CQD materials cannot cause severe side effects in vivo. All of the Balb/c mice used in this study were purchased from Chengdu Dashuo Experimental Animal Co., Ltd. and approved by the Sichuan University Animal Care and Use Committee. In vivo biocompatibility studies of these materials were performed on mice model for 14 days. To assess the biosafety of the CQD materials, routine blood tests, blood biochemistry assays, and histological examination were carried out for the control group (PBS group), CQD, NCQD, FA-CQD groups. The CQD materials were dissolved in PBS to form different concentration solution (10 and 15 mg/kg dosage) and injected through a single tail vein every 2 days for 2 weeks. At the same time, mice of the control group were treated with PBS. In the course of the experiment, all the experimental animals were alive and the fluctuations of body weight were similar with animals of the control group. Blood was collected from the mice on days 1, 6, and 14, and blood routine tests including white blood cell count (WBC), platelet count (PLT), red blood cell count (RBC), hemoglobin (HGB) and hematocrit (HCT) were performed. The results did not display any obvious differences in NCQDs and FA-CQDs groups except a negligible variation in WBC and RBC values (Fig. S4 in Supporting information). Compared with the mice in control group, the value of WBCs was higher in CQDs and NCQDs groups, but the range was still within normal levels. However, in CQDs groups, the 20 mg/kg dosage group exhibited an obvious increase of WBCs on day 1 (P < 0.05), which indicated that acute toxicity appeared in the mice of high concentration groups. On day 14, no statistically significant differences were observed in all the experimental groups, the probable reason might be the immuno-logical regulation of the body.
To explore the potential toxicity reaction of the CQD materials in vivo, a blood biochemistry assays was carried out. The important markers such as alanine aminotransferase (ALT), alkaline phosphatase (ALP), total bilirubin (TB), blood urea nitrogen (BUN) and creatinine (CRE) were selected to evaluate the hepatorenal function of the mice. As shown in Fig. S5 (Supporting information), the values of CRE and BUN were associated with the concentration of the CQD materials, but all the values were within normal ranges. The important hepatic indicators ALT, ALP, and TB were measured periodically on days 1, 6, and 14, and show no sign of liver injury. In 10 and 15 mg/kg dosage groups, the values were similar to those of the control group. Meanwhile, the values of 20 mg/kg dosage groups were higher than other groups, which demonstrated that high concentration of the CQD materials may cause potential liver toxic effect to the body. Therefore, our results suggested that the CQD materials had no toxicity for liver or kidney at the concentration up to 15 mg/kg, and the animals of those groups showed normal hepatorenal function, as the values of parameters were similar to the control group. Even though the concentration of the materials increased to a high level such as 20 mg/kg, the values were higher than other groups but were still within normal ranges.
To identify the microscopic interactions between CQD materials and the tissue of the body, histological analysis was carried out. Fig. S6 (Supporting information) and Fig. 5 provided visual observation of inflammation or lesions caused by intravenously injected CQD materials nanoparticles after 1 day and 14 days, respectively. As shown in Fig. 5, compared to control group, the mice of 10 mg/kg dosage groups did not show any obvious pathological change or malformation in the heart, spleen and kidney tissue. Histopathological study did not show severe toxic reaction as well, but the liver and lung exhibited some moderate pathological changes. Considering the mice of the control group also show the similar symptoms, these changes might be due to the environmental factors. As the CQD materials concentration increased, more and more injuries were induced in these organs, such as inflammatory cell infiltration, endomyocardial fibrosis, splenic nodule atrophy, and glomerular abnormalities. The most pronounced injuries were observed at the high concentration of NCQD 20 mg/kg as proven by the pathological changes in H & E staining, which showed up as necrosis and hemorrhage in the lung, glomeruli degeneration and necrosis, and splenic nodule atrophy. By contrast, all the experiment animals of FA-CQDs groups showed slight pathological changes. Cells and structure in the samples of these organs were observed to be normal and specific lesion different from the control group was not found in the samples.

|
Download:
|
| Fig. 5. Histological analysis of the CQD materials to evaluate toxicity. Histological study of the heart, liver, spleen, lung and kidney of the mice at 14 days after intravenous injection of the CQD materials at different concentrations (scale bar = 50 μm). | |
In summary, we prepared CQDs and its functional modification materials (CQDs, NCQDs, FA-CQDs) using the common methods. On the one hand, we did not observe any obvious toxic reaction or severe change from in vitro cytotoxicity assays with the dose of these CQD materials increasing to a high concentration at 1 mg/mL. On the other hand, the FA-CQDs may not be taken through the normal FR-cell membrane, and thus cannot lead to an obvious toxicity, as evidenced by the CCK-8 and LDH assays. The in vivo fluorescence bioimaging of nude mice and ex vivo organs suggested that the CQD materials mainly accumulated in the liver and kidney after 24 h post injection through tail vein. In vivo biocompatibility studies show that the CQD materials could not cause severe toxicities as evidenced by blood biochemistry and hematological analysis, and no severe pathological changes in the heart, liver, spleen, lung, or kidney were observed even at a high concentration of 15 mg/kg especially in the FA-CQDs groups. These results demonstrated that the CQD materials within proper concentration are suitable for biological application such as diagnosis, imaging and drug delivery.
AcknowledgmentsThe authors gratefully acknowledge financial support from the National Natural Science Foundation of China (Nos. 81970985, 81771122, 81601613, 21501123), Science & Technology Support Program of Sichuan Province (Nos. 2018SZ0037, 19YYJC2625), the Graduate Student's Research and Innovation Fund of Sichuan University (No. 2018YJSY108), the China Postdoctoral Science Foundation Funded Project (No. 2018M640931), and the Science & Technology Key Research and Development Program of Sichuan Province (No. 2019YFS0142).
Appendix A. Supplementary dataSupplementary material related to this article can be found, in the online version, at doi:https://doi.org/10.1016/j.cclet.2019.09.018.
| [1] |
S.N. Baker, G.A. Baker, Angew. Chem. Int. Ed. 49 (2010) 6726-6744. DOI:10.1002/anie.200906623 |
| [2] |
L. Cao, X. Wang, M.J. Meziani, et al., J. Am. Chem. Soc. 129 (2007) 11318-11319. DOI:10.1021/ja073527l |
| [3] |
Y. Wu, P. Wei, S. Pengpumkiat, E.A. Schumacher, V.T. Remcho, Anal. Chem. 87 (2015) 8510-8516. DOI:10.1021/acs.analchem.5b02019 |
| [4] |
S. Qu, X. Wang, Q. Lu, X. Liu, L. Wang, Angew. Chem. Int. Ed. 51 (2012) 12215-12218. DOI:10.1002/anie.201206791 |
| [5] |
M. Zhang, Q. Yao, C. Lu, Z. Li, W. Wang, ACS Appl. Mater. Interfaces 6 (2014) 20225-20233. DOI:10.1021/am505765e |
| [6] |
S. Zhu, Q. Meng, L. Wang, et al., Angew. Chem. Int. Ed. 52 (2013) 3953-3957. |
| [7] |
D. Tang, J. Liu, X. Wu, et al., ACS Appl. Mater. Interfaces 6 (2014) 7918-7925. DOI:10.1021/am501256x |
| [8] |
Q. Wang, M. Zhang, C. Chen, W. Ma, J. Zhao, Angew. Chem. Int. Ed. 49 (2010) 7976-7979. DOI:10.1002/anie.201001533 |
| [9] |
R. Yan, H. Wu, Q. Zheng, et al., RSC Adv. 4 (2014) 23097-23106. DOI:10.1039/C4RA02336F |
| [10] |
Y. Guo, Z. Wang, H. Shao, X. Jiang, Carbon 52 (2013) 583-589. DOI:10.1016/j.carbon.2012.10.028 |
| [11] |
S. Barman, M. Sadhukhan, J. Mater. Chem. 22 (2012) 21832-21837. DOI:10.1039/c2jm35501a |
| [12] |
S. Liu, J. Tian, L. Wang, et al., Adv. Mater. 24 (2012) 2037-2041. DOI:10.1002/adma.201200164 |
| [13] |
W.F. Zhang, H. Zhu, S.F. Yu, H.Y. Yang, Adv. Mater. 24 (2012) 2263-2267. |
| [14] |
H. Zhu, W. Zhang, S.F. Yu, Nanoscale 5 (2013) 1797-1802. DOI:10.1039/c3nr34028g |
| [15] |
W. Xiao, Y. Li, C. Hu, et al., J. Colloid Interface Sci. 497 (2017) 226-232. |
| [16] |
C. Hu, Y. Liu, J. Chen, Q. He, H. Gao, J. Colloid Interface Sci. 480 (2016) 85-90. DOI:10.1016/j.jcis.2016.07.007 |
| [17] |
S. Ruan, B. Zhu, H. Zhang, et al., J. Colloid Interface Sci. 422 (2014) 25-29. DOI:10.1016/j.jcis.2014.02.006 |
| [18] |
J. Qian, S. Ruan, X. Cao, et al., J. Colloid Interface Sci. 436 (2014) 227-233. DOI:10.1016/j.jcis.2014.08.059 |
| [19] |
S. Ruan, J. Wan, Y. Fu, et al., Bioconjug. Chem. 25 (2014) 1061-1068. DOI:10.1021/bc5001627 |
| [20] |
S. Ruan, J. Qian, S. Shen, et al., Bioconjug. Chem. 25 (2014) 2252-2259. |
| [21] |
S. Ruan, J. Qian, S. Shen, et al., Nanoscale 6 (2014) 10040-10047. DOI:10.1039/C4NR02657H |
| [22] |
H.U. Lee, S.Y. Park, E.S. Park, et al., Sci. Rep. 4 (2014) 4665. |
| [23] |
J. Chen, X. Cun, S. Ruan, et al., RSC Adv. 5 (2015) 57045-57049. DOI:10.1039/C5RA08245E |
| [24] |
M. Zheng, S. Ruan, S. Liu, et al., ACS Nano 9 (2015) 11455-11461. DOI:10.1021/acsnano.5b05575 |
| [25] |
D.Y. Guo, C.X. Shan, S.N. Qu, D.Z. Shen, Sci. Rep 4 (2014) 7649. |
| [26] |
X. Wang, L. Cao, S.T. Yang, et al., Angew. Chem. Int. Ed. 49 (2010) 5310-5314. DOI:10.1002/anie.201000982 |
| [27] |
Z. Lei, S. Xu, J. Wan, P. Wu, Nanoscale 8 (2016) 2219-2226. DOI:10.1039/C5NR07335A |
| [28] |
K. Yang, H. Gong, X. Shi, et al., Biomaterials 34 (2013) 2787-2795. |
| [29] |
K. Yang, J. Wan, S. Zhang, et al., ACS Nano 5 (2011) 516-522. DOI:10.1021/nn1024303 |
| [30] |
L. Tian, D. Ghosh, W. Chen, et al., Chem. Mater. 21 (2009) 2803-2809. |
| [31] |
D. Qu, M. Zheng, L. Zhang, et al., Sci. Rep 4 (2014) 5294. |
| [32] |
X. Yang, X. Yang, Z. Li, et al., J. Colloid Interface Sci. 456 (2015) 1-6. DOI:10.1016/j.jcis.2015.06.002 |
| [33] |
J. Geng, K. Li, D. Ding, et al., Small 8 (2012) 3655-3663. |
| [34] |
Z. Wang, B. Xu, L. Zhang, et al., Nanoscale 5 (2013) 2065-2072. DOI:10.1039/c2nr33685e |
| [35] |
M. Zhang, X. Zhou, S. Iijima, M. Yudasaka, Small 8 (2012) 2524-2531. DOI:10.1002/smll.201102595 |
| [36] |
Y. Song, Y. Chen, L. Feng, J. Ren, X. Qu, Chem. Commun. (Camb.) 47 (2011) 4436-4438. DOI:10.1039/c0cc05533f |
| [37] |
H. Cheng, C. Wang, Z. Xu, H. Lin, C. Zhang, RSC Adv. 5 (2015) 20-26. DOI:10.1039/C4RA12066C |
| [38] |
Y. Song, S. Wen, C. Wei, X. Li, H.J. Ma, J. Mater. Chem. 22 (2012) 12568-12573. DOI:10.1039/c2jm31582c |
| [39] |
M. Nurunnabi, Z. Khatun, K.M. Huh, et al., ACS Nano 7 (2013) 6858-6867. DOI:10.1021/nn402043c |
| [40] |
Z.G. Wang, R. Zhou, D. Jiang, et al., Biomed. Environ. Sci. 28 (2015) 341-351. |
| [41] |
X. Xu, K. Zhang, L. Zhao, et al., ACS Appl. Mater. Interfaces 8 (2016) 32706-32716. DOI:10.1021/acsami.6b12252 |
| [42] |
X. Zhao, J. Zhang, L. Shi, et al., RSC Adv. 7 (2017) 42159-42167. DOI:10.1039/C7RA07002K |
| [43] |
S. Li, S. Zhou, Y. Li, et al., ACS Appl. Mater. Interfaces 9 (2017) 22332-22341. DOI:10.1021/acsami.7b07267 |
| [44] |
J. Tan, R. Zou, J. Zhang, et al., Nanoscale 8 (2016) 4742-4747. DOI:10.1039/C5NR08516K |
| [45] |
J. Zhang, X. Zhang, S. Dong, X. Zhou, S. Dong, J. Photochem. Photobiol. A:Chem. 325 (2016) 104-110. DOI:10.1016/j.jphotochem.2016.04.012 |