 2018, Vol. 29


b Department of Applied Chemistry and Institute of Natural Sciences, Kyung Hee University, Yongin-si 17104, Republic of Korea
Fluorescence imaging methods are widely used for the detection and analysis of single biomolecules [1]. Cyanine dyes are commonly used fluorescent tags for single DNA molecule studies via fluorescence microscopy due to their high extinction coefficients (> 10, 000 mol-1 cm-1), moderate quantum yield, and high photostability [2]. Although YOYO-1 (Fig. S1 in Supporting information), a representative cyanine dye, does not emit fluorescence in free solutions, the dye can form a fluorescent complex with double strand DNA molecules [3]. The DNA-YOYO complex can yield up to a > 1000-fold enhancement in fluorescence with good stability and photobleaching resistance [4]. Several studies have been reported on the analysis of DNA molecules containing YOYO-1 at the single molecule level: Yasui et al. reported the separation of DNA fragments with ratios of 1:5 and 1:15 dye to DNA base pairs (bp), while controlling the dynamics of the DNA molecules within microchannel on fused silica substrates [5]. Kang et al. observed the real time enzyme digestion of YOYO-1 intercalated single DNA molecules for dye:bp ratios of 1:5 to 1:50 [6]. Although the above methods have claimed to report analysis with regard to various ratios of dye to bp, there is no experimental evidence for the intercalation of YOYO-1 at the single DNA molecular level.
A major drawback to the use of conventional fluorescence microscopy [7-9] for the study of single DNA molecules is the diffraction limitations [10-15]. Recent studies have enabled the indepth analysis of single DNA molecules. Flors et al. [16] observed single DNA molecules by stochastically switching the intercalated fluorophore and employing an optical resolution lower than the diffraction limits of conventional microscopy [17]. Persson et al. compared stimulated emission via depletion microscopy imaging with confocal microscopy images of a single DNA molecule to demonstrate the feasibility of sub-diffraction limit resolution imaging [18]. Earlier reports presented the base pair distance analysis of single DNA molecules via direct stochastic optical reconstruction microscopy [19].
In this report, binding-activated localization microscopy (BALM) [20] was employed as a super-resolution microscopic technique for the sub-diffraction limit super-resolution imaging of YOYO-1 dye intercalated single DNA molecules. Fluorescence activation and deactivation on YOYO-1 binding and unbinding to a DNA fluorescent complex were used as stochastic events to achieve sub-diffraction limit super-resolution imaging.
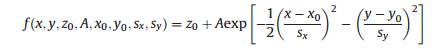
The linearly stretched λ-DNA molecules were imaged using a lab made BALM system [21-24] (Detail procedure of λ-DNA stretching and switching buffer were given in Supporting information). The BALM system setup (Fig. S2 in Supporting information) was slightly modified from a prior BALM imaging report [19]. A 488 nm argon ion laser (110 mW; 35-LAP-431-220, Melles Griot, Carlsbad, CA, USA) was briefly used as a light source. An electron-multiplying charge-coupled device camera (EMCCD, 512 × 512 pixel imaging array, iXon Ultra, Andor, Belfast, Ireland) was mounted onto an Olympus BX-53 upright microscope (Olympus Optical Co., Ltd, Tokyo, Japan); fluorescence emission was collected through a 100× objective lens with a numerical aperture of f/1.4 (UPlanSApo, Olympus). A Uniblitz mechanical shutter (Uniblitz Electronics, Rochester, NY, USA) was employed to control the laser beam. Images were collected with MetaMorph 7.8.6 software (Molecular Devices, Sunnyvale, CA, USA), and data was analyzed using the Quick palm plugin [25] in ImageJ software [14]. The exposure duration was 100 ms at a laser power of 100 mW and an EM gain of 2360 with 3 min acquisition time. To reconstruct the BALM images, ~2200 frames were acquired. In this study, 250-600 photons were detected per 100 ms for each λ-DNA molecule, corresponding to a localization precision of 20 nm. The acquired images were analyzed and reconstructed into super-resolution images for base pair distance analysis. The spatially isolated diffraction limited pots of individual YOYO-1 molecules that experienced stochastic blinking were localized by high-intensity and acquired with a desired photon count. Each spot was fitted with a nonlinear least square fitting method, and a best fit was obtained for each molecule with the following equation [26]:
|
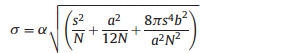
where A is the amplitude, z0 is a constant from the background noise, x0 and y0 are the center coordinates, and sx and sy are the standard deviation values along x and y, respectively. Background noise was estimated with the estimated signal intensity and the selected signal noise ratio. The Gaussian function was fitted to 8 nearby neighborhoods, with the localization precision (σ) calculated through the following equation [27]:
|
where a is the pixel size of the detector, N is the number of collected photons, b is the background noise of the detector, and s is the standard deviation of the point spread function.
A desirable instrumental setup and experimental conditions were the key to high precision single-molecule analysis. The effects of pH [28], incubation time, and temperature [29] were reported for the homogenous intercalation of YOYO-1 in λ-DNA. However, optimum conditions for the super-resolution imaging of λ-DNA with YOYO-1 have not yet been reported. The fluorescent dye should possess a high photon count and photostability for a considerable period of time in order to achieve high localized precision [30]. With regard to the fluorescent YOYO-1 complex with λ-DNA, photocleavage was an unsolved issue that required consideration prior to super-resolution imaging. Being an effective fluorescent dye for λ-DNA, YOYO-1 is also a DNA cleavage agent upon subjection with UV radiation [31]. Therefore, photocleavage should be reduced in order to achieve a high photon count and long photostability. Since the most common photocleavage mechanism involves the production of singlet oxygen, an effective oxygen scavenger is necessary to prevent photocleavage. MEA has been reported to be an efficient oxygen scavenger for both singlet oxygen and oxygen radicals [32].
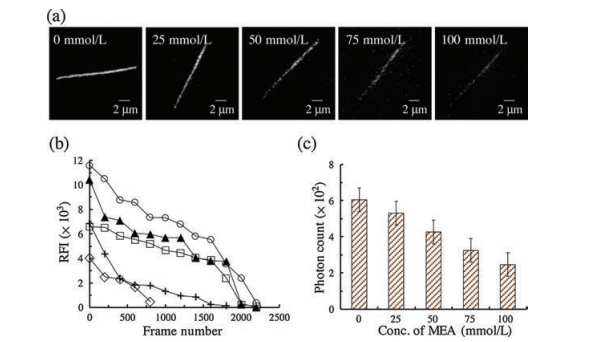
YOYO-1 intercalated with λ-DNA at a base pair ratio 1:100 was analyzed with five different MEA concentrations. Wide-field images (Fig. 1a) at different concentrations exhibited a decrease in fluorescence intensity with an increase in the MEA concentration. Sequences of images were obtained for an average of 2500 frames with 30 min acquisition time. The relative fluorescence intensity (RFI) was monitored in each frame (Fig. 1b), and the subsequent photons were calculated (Fig. 1c). A decrease in fluorescence intensity with the addition of MEA could be attributed to the reversible binding of YOYO-1 with MEA over that of λ-DNA [33]. The average relative fluorescence intensity (RFI) was measured in accordance with the progress of frames with a 100 ms exposure time. During the process, RFI (0 mmol/L) = 7121 ±345; RFI (25 mmol/L) = 5383 ± 241; RFI (50 mmol/L) = 4510 ± 214; RFI (75 mmol/L) = 2049 ± 98; and RFI (100 mmol/L) = 993 ± 41(Fig. 1b). An interesting observation was made with regard to the stability of the RFI throughout the image sequence. At MEA concentrations of 0 mmol/L and 25 mmol/L, the initial fluorescence intensity was high and sufficient to achieve high precision. However, the RFI was not stable throughout the image sequences and might have resulted in a lack of accuracy. For every 500 frames, a large dip in the RFI value was observed for the MEA concentration of 0 mmol/L. The MEA concentration of 25 mmol/L still exhibited a better photostability compared to the 0 mmol/L MEA concentration but lacked the stability required for long-term imaging as it yielded a large fluctuation. However, the MEA concentration of 50 mmol/L exhibited a better photostability with no fluctuations until becoming photobleached at around 2000 frames. At MEA concentrations of 75 mmol/L and 100 mmol/L, the initial fluorescence intensity was low and became photobleached at 1000 frames. Moreover, the 50 mmol/L MEA concentration featured a much better homogenous intercalation of YOYO-1 with λ-DNA (Fig. S3 in Supporting information).

|
Download:
|
| Fig. 1. (a) Wide-field fluorescence images of 1:100 (dye:DNAbp) YOYO-1-intercalated λ-DNA samples at five different MEA switching buffer concentrations. (b) Relative fluorescence intensity (RFI) and (c) number of photons detected for an average of 2500 frames of an image sequence at each concentration. | |
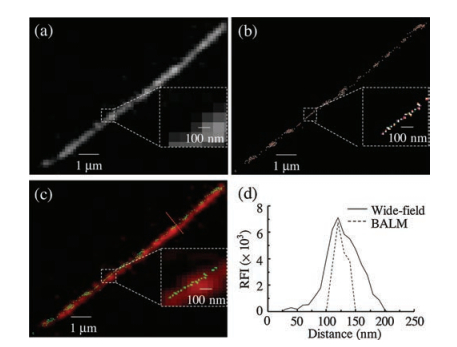
To overcome the diffraction limitation of wide-field images, BALM was employed as a super-resolution imaging tool for single λ-DNA molecules. The fluorescent YOYO-1 dye was bound to λ-DNA molecules and repeatedly cycled through absorption and fluorescence emission states. Freely diffused dye in the solution was non-fluorescent and undetectable; hence, the λ-DNA dye complex emitted strong fluorescence and could be detected precisely for the imaging of single molecules [34]. Comparisons were made between the images obtained via wide-field fluorescence and BALM (Fig. 2). As optimized, the BALM images were acquired using 50 mmol/L MEA photoswitching buffer. The widefield image (Fig. 2a) of a single λ-DNA molecule was distinct, although the resolution was insufficient for visualization (inset of Fig. 2a). However, the BALM image (Fig. 2b) revealed a highly precise image of a YOYO-1 intercalated with single DNA molecule (inset of Fig. 2b). The merged wide-field and BALM image (Fig. 2c) revealed the differences in resolution between the two images. A line-scan analysis (Fig. 2d) of the width showed a three-fold difference in resolution between the images. The width of λ-DNA was observed to be 51 nm in the BALM images, with the size being below the diffraction limit of conventional wide field microscopy. The advantage of BALM imaging featuring sub-diffraction limit resolution was its ability to distinguish individual particles residing in close proximity. With regard to the YOYO-1 dye, the material was internalized within the base pairs of λ-DNA; the distance between base pairs was ~0.34 nm. This distance was too small to be analyzed via conventional optical microscopy; thus, the results showed that BALM possessed the feasibility to analyze the intercalated dye with a spatial resolution of tens of nanometers.

|
Download:
|
| Fig. 2. (a) Wide-field fluorescence, (b) BALM, and (c) merged images of 1:100 (dye: DNA bp) YOYO-1-intercalated λ-DNA. (d) Line scan profiles of relative fluorescence intensity (RFI) vs. distance in nm for the red dotted line in (b). | |
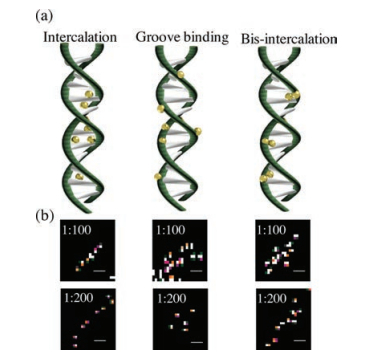
To analyze the distance between base pairs in single λ-DNA molecules, YOYO-1 dye was intercalated at various dye:DNA bp ratios. The dye:DNA bp ratios of 1:1, 1:10, 1:50, and 1:80 were imaged using approximately 2500 image sequences and were reconstructed into a single frame for analysis at the sub-diffraction limit (Fig. S4 in Supporting information). The RFI was observed for each concentration (Fig. S5 in Supporting information); the values were 1:1 = 15448 ± 643, 1:5 = 13413 ± 601, 1:10 = 12341 ±587, 1:50 = 9401 ±432, 1:80 = 8009 ± 398, 1:100 = 7648 ± 375, 1:200 = 5568 ± 247, and 1:300 = 4507 ± 225. The decrease in fluorescence intensity could be attributed to the quantity of YOYO-1 internalized within the λ-DNA. With a 1:1 base pair ratio, YOYO-1 intercalated closely with other molecules, and the base pair distance at this ratio was 0.34 nm; hence, it was quite difficult to differentiate the localization of individual fluorophores at this ratio. However, the fluorophore distribution pattern was at a constant location in a region followed by a saturated region (Fig. S4a). Although determining base pair distances with these ratios was not practically possible, the results showed that the method of approach was sufficient for the homogenous labelling of YOYO-1 with λ-DNA. The same description was applied to the following ratios: 1:5, 1:10, and 1:80. However, at 1:100 and 1:200 ratios, the distance between base pairs was around 34 nm and 64 nm, respectively. The discrepancy in intercalation was largely depends on the different mode of binding of YOYO-1 with λ-DNA. YOYO-1 possessed four positive charges (Fig. S1a in Supporting information) and could bind through bis-intercalation with the chromophore units in λ-DNA. YOYO-1 could also alter the morphology and physical properties of DNA, such as its helical pitch and persistence length [4]. Thus, YOYO-1 dye was observed to be internalized both homogenously and non-homogenously at different positions. The differences could be attributed to different modes of binding with λ-DNA [35]. The major binding modes were intercalation between base pairs, interaction with the anionic sugar phosphate backbone of DNA, and bis-intercalation with base pairs and the minor or major groove of DNA [36]. For the 1:100 and 1:200 ratios, all three major binding modes of YOYO-1 with λ-DNA were observed (Fig. 3). YOYO-1 observed through BALM images showed the dye to be localized at the center, indicating that YOYO-1 was intercalated between base pairs. In certain regions, YOYO-1 was not observed at the center and could only be observed at the corner, showing that the dye was bonded to the groove. However, in other regions, YOYO-1 was observed to be in both the center and corner, suggesting bis-intercalation of the dye (Fig. 3b).

|
Download:
|
| Fig. 3. (a) Schematic representations of the types of YOYO-1 binding with λ-DNA. (b) Specific regions of YOYO-1 in λ-DNA for the 1:100 and 1:200 (dye:DNAbp) ratios, representing each binding mode in (a). | |
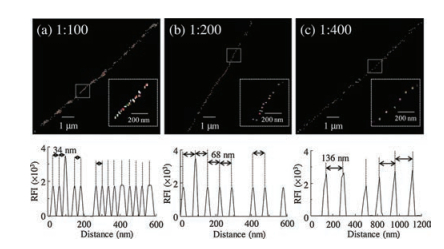
Due to the various binding modes of YOYO-1, the dye appeared to be distributed both homogenously and non-homogenously with λ-DNA [37]. It was difficult to conclusively analyze the base pair distances with the non-homogenous parts of λ-DNA (Fig. S6 in Supporting information). DNA base pair distances between the ratios of 1:1 to 1:80 were difficult to analyze due to the shortness. However, for the dye to DNA base pair ratios of 1:100, 34 nm (Fig. 4a), 1:200, 68 nm (Fig. 4b), and 1:400, 136 nm (Fig. 4c) samples showed values that were in agreement with the theoretical base pair distance values (34 nm at n = 10, 68 nm at n = 25, and 136 nm at n = 13) via DNA base pair distance analysis. In this study, BALM techniques were employed to observe the superresolution morphological dissemination of YOYO-1 dye within single DNA molecules. YOYO-1 is an excellent fluorescent dye and also functions as a DNA cleaving agent; hence, the conditions for fluorescence imaging were optimized. Stochastic fluorescence emission followed by super-localization yielded sub-diffraction limit images to analyze the exact locations of individual dye molecules within λ-DNA. Moreover, the dye tended to be attached to the minor groove as opposed to the major groove of the DNA main strand and could also participate in bis-intercalation, with an arm length of approximately 4 bp = 1.36 nm [38]. Therefore, all possible binding modes were analyzed; with the exact intercalation sites, the λ-DNA bp distances were calculated. Different binding modes of YOYO-1 dye with single λ-DNA molecules were visualized for the first time with sub-diffraction limit resolution and bp distance analysis. The results showed that the method could be a good application for studying the intercalating characteristics of single DNA molecules.

|
Download:
|
| Fig. 4. BALM images of (a) 1:100, (b) 1:200, and (c) 1:400 (dye:DNAbp) ratios and their representative RFI vs. distance plots in the insets of the respective images. | |
Acknowledgments
This work was supported by the Basic Science Research Program through the National Research Foundation of Korea (NRF) funded by the Ministry of Education, Science, and Technology (No. 2015R1A2A2A01003839).
Appendix A. Supplementary dataSupplementary data associated with this article can be found, in the online version, at http://dx.doi.org/10.1016/j.cclet.2017.08.018.
| [1] |
A.L. Mattheyses, S.M. Simon, J.Z. Rappoport, J. Cell. Sci. 123 (2010) 3621-3628. DOI:10.1242/jcs.056218 |
| [2] |
L.A. Ernst, R.K. Gupta, R.B. Mujumdar, A.S. Waggoner, Cytometry 10 (1989) 3-10. DOI:10.1002/(ISSN)1097-0320 |
| [3] |
A.N. Glazer, H.S. Rye, Nature 359 (1992) 859-861. DOI:10.1038/359859a0 |
| [4] |
H.S. Rye, S. Yue, D.E. Wemmer, et al., Nucl. Acids Res. 20 (1992) 2803-2812. DOI:10.1093/nar/20.11.2803 |
| [5] |
T. Yasui, S. Rahong, K. Motoyama, et al., ACS Nano 7 (2013) 3029-3035. DOI:10.1021/nn4002424 |
| [6] |
S.H. Kang, S. Lee, E.S. Yeung, Analyst 135 (2010) 1759-1764. DOI:10.1039/c0an00145g |
| [7] |
S. Lee, S.H. Kang, J. Nanomater. 2012 (2012) 1-7. |
| [8] |
D. Oh, S. Lee, S.H. Kang, Chem. Comm. 47 (2011) 9137-9139. DOI:10.1039/c1cc12911b |
| [9] |
Y. Heo, S. Lee, S.-W. Lee, S.H. Kang, Bull. Korean Chem. Soc. 34 (2013) 2725-2730. DOI:10.5012/bkcs.2013.34.9.2725 |
| [10] |
F. Cava, E. Kuru, Y.V. Brun, M.A. de Pedro, Curr. Opinion Microbiol. 16 (2013) 731-737. DOI:10.1016/j.mib.2013.09.004 |
| [11] |
M.J. Rust, M. Bates, X. Zhuang, Nat. Methods 3 (2006) 793-796. DOI:10.1038/nmeth929 |
| [12] |
E. Betzig, G.H. Patterson, R. Sougrat, et al., Science 313 (2006) 1642-1645. DOI:10.1126/science.1127344 |
| [13] |
M. Heilemann, S. Van De Linde, M. Schüttpelz, et al., Angew. Chem. Int. Ed. 47 (2008) 6172-6176. DOI:10.1002/anie.v47:33 |
| [14] |
D.T. Burnette, P. Sengupta, Y. Dai, J. Lippincott-Schwartz, B. Kachar, PNAS 108 (2011) 21081-21086. DOI:10.1073/pnas.1117430109 |
| [15] |
C. Steinhauer, C. Forthmann, J. Vogelsang, P. Tinnefeld, J. Am. Chem. Soc. 130 (2008) 16840-16841. DOI:10.1021/ja806590m |
| [16] |
C. Flors, Biopolymers 95 (2011) 290-297. DOI:10.1002/bip.v95.5 |
| [17] |
C. Flors, C.N. Ravarani, D. Dryden, ChemPhysChem 10 (2009) 2201-2204. DOI:10.1002/cphc.v10:13 |
| [18] |
F. Persson, P. Bingen, T. Staudt, et al., Angew. Chem. Int. Ed. 50 (2011) 5581-5583. DOI:10.1002/anie.201100371 |
| [19] |
S.K. Chakkarapani, G. Park, S.H. Kang, Chin. Chem. Lett. 26 (2015) 1490-1495. DOI:10.1016/j.cclet.2015.10.017 |
| [20] |
I. Schoen, J. Ries, E. Klotzsch, H. Ewers, V. Vogel, Nano letters 11 (2011) 4008-4011. DOI:10.1021/nl2025954 |
| [21] |
C. Kanony, B. Åkerman, E. Tuite, J. Am. Chem. Soc. 123 (2001) 7985-7995. DOI:10.1021/ja001047n |
| [22] |
Y. Yoshikawa, K. Hizume, Y. Oda, et al., Biophys. J. 90 (2006) 993-999. DOI:10.1529/biophysj.105.069963 |
| [23] |
R. Henriques, C. Griffiths, E. Hesper Rego, M.M. Mhlanga, Biopolymers 95 (2011) 322-331. DOI:10.1002/bip.v95.5 |
| [24] |
S.H. Kang, M.R. Shortreed, E.S. Yeung, Anal. Chem. 73 (2001) 1091-1099. DOI:10.1021/ac0013599 |
| [25] |
R. Henriques, M. Lelek, E.F. Fornasiero, et al., Nat. Methods 7 (2010) 339-340. DOI:10.1038/nmeth0510-339 |
| [26] |
A. Yildiz, J.N. Forkey, S.A. McKinney, et al., Science 300 (2003) 2061-2065. DOI:10.1126/science.1084398 |
| [27] |
R.E. Thompson, D.R. Larson, W.W. Webb, Biophys. J. 82 (2002) 2775-2783. DOI:10.1016/S0006-3495(02)75618-X |
| [28] |
M. Heilemann, S. van de Linde, A. Mukherjee, M. Sauer, Angew. Chem. Int. Ed. 48 (2009) 6903-6908. DOI:10.1002/anie.v48:37 |
| [29] |
K. Günther, M. Mertig, R. Seidel, Nucl. Acids Res. 38 (2010) 6526-6532. DOI:10.1093/nar/gkq434 |
| [30] |
B.E. Urban, B. Dong, T.Q. Nguyen, et al., Sci. Rep(2016). |
| [31] |
B. Li, J. Hu, Y. Wang, et al., Chin. Sci. Bull. 48 (2003) 673-675. DOI:10.1360/03tb9144 |
| [32] |
D. Akanmu, R. Cecchini, O.I. Aruoma, B. Halliwell, Arch. Biochem. Biophy. 288 (1991) 10-16. DOI:10.1016/0003-9861(91)90158-F |
| [33] |
A. Szczurek, L. Klewes, J. Xing, et al., Nucl. Acids Res. 45 (2017) 1-11. DOI:10.1093/nar/gkw1046 |
| [34] |
K.I. Mortensen, L.S. Churchman, J.A. Spudich, H. Flyvbjerg, Nat. Methods 7 (2010) 377-381. DOI:10.1038/nmeth.1447 |
| [35] |
A. Rescifina, C. Zagni, M.G. Varrica, V. Pistarà, A. Corsaro, Europ. J. Med. Chem. 74 (2014) 95-115. DOI:10.1016/j.ejmech.2013.11.029 |
| [36] |
L. Strekowski, B. Wilson, Mutat. Res. 623 (2007) 3-13. DOI:10.1016/j.mrfmmm.2007.03.008 |
| [37] |
E.S. Tobias, M. Connor, M. Ferguson-Smith, Essential Medical Genetics[M]. John Wiley & Sons, 2011.
|
| [38] |
F. Johansen, J.P. Jacobsen, J. Biomol. Struct. Dyn. 16 (1998) 205-222. DOI:10.1080/07391102.1998.10508240 |