 2018, Vol. 29


b Fujian Institute of Research on the Structure of Matter Fujian, Chinese Academy of Sciences, Fuzhou 350002, China;
c State Key Laboratory of Physical Chemistry of Solid Surfaces, College of Chemistry and Chemical Engineering, Xiamen University, Xiamen 361005, China
Chemical properties of functional materials is not only determined by the intrinsic nature of single-molecule structure but also close packing and intermolecular interactions of the building blocks, including hydrogen bonding, π … π stacking, CH … π interactions, and halogen bonding, etc. [1-3]. On this regard, extensive investigations have been devoted to alter molecular aggregation patterns and intermolecular interactions [4, 5], endeavoring to attain tunable chemical and/or physical properties of the correlated bulk materials [6]. Molecular aggregation widely exists in aqueous solutions of dyes, organic aerosols, liquid crystals, thin solid films and biological systems, which are largely associated with strong/weak intermolecular interactions and excited electronic states rendering the optic response of molecular aggregates a significant research topic [7, 8].
Numerous molecule aggregates have been meticulously investigated by using UV–vis absorption, fluorescence spectroscopies [9]. For example, the full width at half maximum (FWHM) of UV– vis absorption spectra of organic molecules was found to change upon aggregation states due to undetectable intermolecular interactions. The weakly coupled aggregates of organic molecules often display significantly different fluorescence compared with their monomers [6, 10, 11], determined by cooperativity and directivity of intermolecular interactions, charge/energy transfer and/or chemical transformation of molecular aggregates. Among others, resonant two-photon ionization spectroscopy has been applied to study host–guest interactions of molecular beams of butylbenzene-related clusters formed by supersonic expansion [12]. Also a few early studies upon benzene, utilizing resonant iondip infrared spectroscopy, revealed the underlying nature of delocalized π-electrons interaction of prototypical aromatic compounds.
It is notable that, the fingerprints of Raman spectroscopy actually have unique advantages to be applied to molecular aggregates [13-15], due to its well-known capability to differentiate isomers [16, 17], to monitor phase changes of functional materials, to trace conformation/chirality transition of organic molecules [18-20], and to judge interface adsorption behaviors. A few previous Raman investigations towards organic molecule aggregates have enabled to clarify the difference on ionic surfactants and photogenerating reactions [21-23]. Raman spectroscopic research of molecular aggregates is becoming a significant solution to identify aggregation states in liquid and aerosol [24], and to unravel unexplainable issues by macroscopic crystallography or single-molecule chemistry in various fields such as catalysis, optics, magnetism, and medicine, etc. [25, 26].
Here, we present a study of mesoscale Zinc(Ⅱ) tetraphenylporphyrin (ZnTPP) aggregates. ZnTPP is chosen as the object considering that it is an important precursor in the synthesis of multifunctional materials [27], and it plays essential role in many molecular systems relevant to medicine, photosynthesis and other photon-driven processes in nature. ZnTPP is known as a macrocyclic conjugate system of 18 π-electrons with four nitrogen atoms combined with the Zinc center analogues to modified macrocycle, as well as novel condensed-phase architectures. We provide here a joint experimental and theoretical study upon different aggregates of ZnTPP, by performing a comparison with the density-functionaltheory (DFT) calculation results. Generalized Kohn–Sham based energy decomposition analysis (GKS-EDA) is conducted enlightening to understand how the weak interactions contribute to the nature of porphyrins in mesoscale.
Silver nitrate (99.995%), trisodium citrate (anhydrous, 99%), and ZnTPP were purchased from Alfa Aesar. Ethanol, toluene, acetone dichloromethane and acetonitrile (spectral purity) were purchased from Beijing Chemical Industry Group Co., Ltd. All chemicals were used as received without further purification. The nanorods ZnTPP were synthesized via reprecipitation method, simply by microfluid injection of near-saturated ethanol solution of ZnTPP directly on cover slips and dewetting naturally. The nanosheets ZnTPP was obtained by rapidly injecting 1 mL of 1 mmol/L ZnTPP solution of acetonitrile into 5 mL aqueous solution of 0.5 mol/L poly(vinyl pyrrolidone) and 10 mmol/L sodium nitrite [28]. The morphologies of ZnTPP samples were measured with a Hitachi S-4800 field emission scanning electron microscopy (FE-SEM), an accelerating voltage of 10 kV. UV–vis absorption spectra were recorded with a UV-3600 spectrophotometer. Raman spectra were collected with a Renishaw H13325 spectrometer using a 514.5 nm laser pertaining to near-resonance excitation.
First-principle calculations were performed within Gaussian 09 program package. The models were configured with GaussView software with optimized geometry. The modeling of dimer structures is determined by considering normal molecular distances on a basis of molecule stacks from the Cambridge crystallographic data center (CCDC) database [29]. Various structures of ZnTPP are optimized using density functional theory (DFT) at B3LYP level with 6-31G(d) basis set for ZnTPP [30, 31], with diffuse functions and polarization for all atoms included. The harmonic vibrational frequency calculations on the optimized geometries are performed at each level of theory to ensure the structures at local minima. A scaling factor (0.985) was used to correct the frequency calculation results.
Decomposing the interaction energies into physically significant components is quantitatively analyzed by the GKS-EDA method [32], which is performed by the home version of GAMESS program [33, 34]. The GKS-EDA scheme is put into use for intermolecular interaction research by various DFT functions (local, hybrid, double hybrid, rang-separated and dispersion correction) [35], and disassembles the total interaction energy into the following items:
|
(1) |
Here, △Eele represents the electrostatic interaction energy, calculated from monomers' Kohn Sham orbitals. △EPauli represents the Pauli repulsion energy, which is the sum of exchange and repulsion interactions arising from the normalization and antisymmetry of Kohn–Sham determinants. Among others, △Epol is the polarization interaction attribute to the variation of Kohn– Sham orbitals by the SCF procedure; △Ecorr is the correlation interaction prescribed by the GKS correlation energy; △Edisp stands for the dispersion interaction, which is optional for dispersion correction DFT calculation.
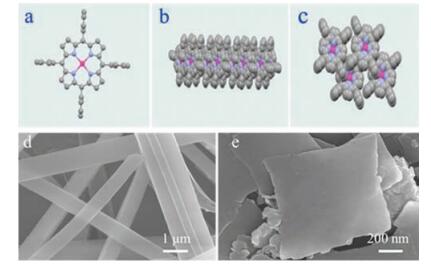
Figs. 1a–c represent the molecular structure of a single ZnTPP molecule in comparing with its aggregation along xoz plane and xoy plane, respectively. The different patterns of ZnTPP indicate that the final architectures of this organic molecule can be tunable depending on varied kinetic factors including whether or not a balance of intermolecular forces, interfacial effect, solvent effect and dewetting rate [13], as well as pre-existing components organized by specific local interactions and stabilizer [32, 36]. With reasonable efforts, we have successfully obtained different ZnTPP nanostructures of nanorods and nanosheets, as shown of SEM images in Figs. 1d–e. The SEM images show that the nanorods are well faceted with a rectangular cross-section and the length is several micrometers. In comparison, nanosheets of ZnTPP were based on a two-dimension preferential growth with a side-length of ~900 nm and a thickness of ~100 nm [28].

|
Download:
|
| Fig. 1. The molecular structure of (a) a single ZnTPP, (b) aggregation along xoz plane, (c) xoy plane and its periodic packing structure seen from the y axis. SEM images of different structure ZnTPP (d) nanorods and (e) nanosheets. | |
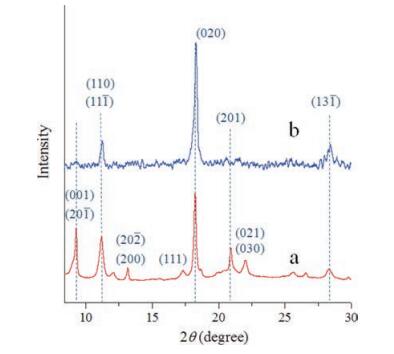
The different morphologies of ZnTPP are further characterized by X-ray diffraction (XRD) analysis. As shown in Fig. 2, the nanorods and particularly the nanosheets favor preferential growth along the (020) faces, while the raw powders (Fig. S1 in Supporting information) of ZnTPP take on a few directions indicating varied growth. It is notable that, there is serious restriction of growth along the (001) direction for nanorods, but it completely disappeared in the nanosheets sample. Meanwhile, the XRD peak assigned to (110) faces does exist for both the nanosheets and nanorods samples and the relative intensity of (001) exist discrepancy [37]. These XRD patterns are well consistent with the observation of SEM morphologies, pertaining to altered packing behavior of ZnTPP molecular.

|
Download:
|
| Fig. 2. XRD patterns of (a) nanorods, (b) nanosheets of ZnTPPs. | |
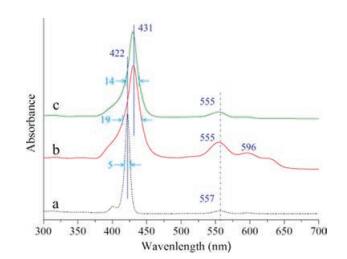
Fig. 3 presents UV–vis absorption spectra of ZnTPP nanorods and nanosheets in comparison with 10-7 mol/L ethanol solution. Compared with the spectrum from 10-7 mol/L ethanol solution (Fig. 3a), the nanorods and nanosheets samples find obvious absorption peaks of aggregates in the long wavelength region. Also, significant red shifts of the Soret band of ZnTPP monomer (~422 nm) are noted for all the aggregate samples including nanosheets (~430 nm) and nanorods (~431 nm) samples in comparation with the dilute solution (more details regarding the solvent polarity were provided in Figs. S2 and S3 in Supporting information). The red shift of the Soret band for ZnTPPnanorods is due to the π…π molecular interaction thus the larger redshift for ZnTPP nanorods (compared with nanosheets) coincides with the regular preferential growth along the (001) direction (Fig. 1b vs. c) [38]. The red shifts of monomer absorption bands in mesoscale aggregates are consistent with previous investigations [39, 40]. Besides red shifts, the full width at half maximum (FWHM) of the monomer absorption bands (a half width of ~5 nm centered at ~422 nm) is found to be much smaller than that in raw powder ZnTPP (~26 nm, Fig. S4 in Supporting information), nanorods (~19 nm) and nanosheets (~14 nm). Thevariation of UV–vis absorption spectra illustrates altered aggregation states of ZnTPP nanorods and nanosheets comparingwith raw powder and dilutes solutions. All these data indicate that the ZnTPP intermolecular interactions can be tunable by controlling the external local environment and nascent molecular stacking behavior.

|
Download:
|
| Fig. 3. UV–vis absorption spectra of ZnTPP: (a) 10-7 mol/L ethanol solution, (b) nanorods and (c) nanosheets. | |
The UV–vis spectral narrowing or broadening can be well explained via exciton theory. According to Kasha exciton theory, different accumulations of molecules have different tilt angles and thus different structure. For the side-by-side (or face-to-face) accumulation, the tilt angle value is greater than 54.7°; whereas for the head-to-tail (or linear) accumulation, it is less than 54.7° [13]. The approximate tilt angle for an accumulation of N molecules can be calculated according to the following equation [41].
|
(2) |
where N is the spectral shift from the monomer absorption, h means Planck's constant, r stands for the separation of centers, φ represents the tilt angle between the line of centers and the molecular long axes; < p2> is the transition dipole moment of monomer, equals 
Considering that ZnTPP molecules undertake weak van der Waals intermolecular interaction but just slightly altered aggregation behavior, it is reasonable to observe similar UV–vis absorption. However, Raman scattering of molecule aggregates, held together by dispersion and electrostatic forces, differ from each other. Moreover, the Raman bands observed for the aggregates could shift from those of isolated monomers depending on the intermolecular interactions (i.e., strong or weak; covalent or non-covalently coupling). It is worth noting that the excited states of organic molecules often bring forth new Raman bands associated with lattice motions, e.g., typical motions in the aggregate formation direction. This characteristic enables Raman spectroscopy a unique approach to identify molecule aggregates [15].
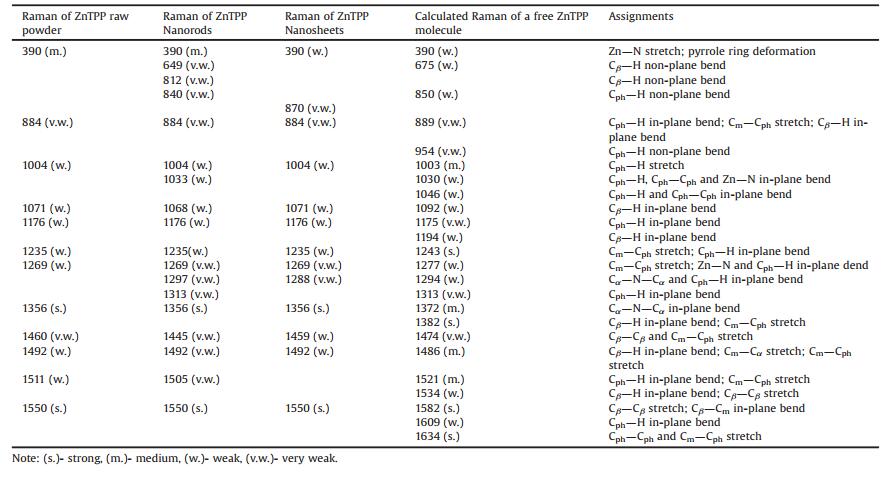
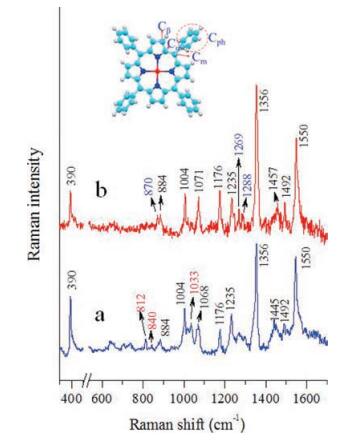
Fig. 4 presents the experimental Raman spectra of ZnTPP nanorods and nanosheets. As is shown there are abundant Ramanactive modes observed in the region from 300 cm-1 to 1700 cm-1, such as the peaks at 390 cm-1 (Zn-N stretching), 1004 cm-1 (Cph-H stretching), 1176 cm-1 (Cph-H in-plane bend), 1235 cm-1 (Cm-Cph stretching), and 1492 cm-1 (Cβ-H in-plane bend) respectively [42, 43]. These peaks display rare differences in the two spectra, including peak positions and half-widths, indicating that there is no major modification towards the intrinsic molecule structures in the two types of mesoscale aggregates [44, 45]. However, there are differences especially for the Raman of the nanosheets, where a few weak peaks emerged, such as ~870 cm-1, 1269 cm-1and 1288 cm-1; meanwhile, there are a few distinguishable peaks in the nanorods spectrum (Fig. 4a), seen as the 812 cm-1, 840 cm-1, and 1033 cm-1 modes. Also the relative intensity of 390 cm-1 in nanosheets spectrum is weaker than the others, indicating that the Zn-N stretching mode is restricted by adjacent molecules (Fig. 4b). In addition, the relative intensities and half widths of 1356 cm-1(Cα-N-Cα in-plane bend) and 1550 cm-1 (Cβ-Cβ stretching) modes display minor differences. Table 1 lists the vibrational modes of ZnTPP from both experimental and theoretical results and the Raman spectrum of raw powder ZnTPP is provided in Fig. S5 (Supporting information) [42, 43, 46].

|
Download:
|
| Fig. 4. The experimental normal Raman spectra of ZnTPP of (a) nanorods and (b) nanosheets; baselines are subtracted in view of high fluorescence background of these ZnTPP samples. The insert shows the molecular structure, ph = phenyl. Cα, Cβ = pyrrole carbon, Cm = methane bridge carbon, Cph = phenyl carbon. | |
|
|
Table 1 A list showing the vibrational modes of ZnTPP. |
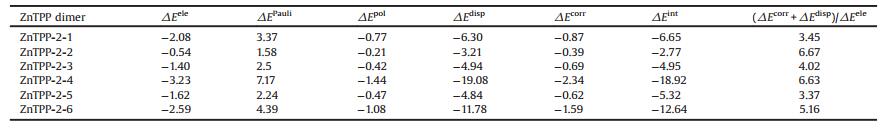
Further, we have conducted GKS-EDA calculation using the ωB97X-D functional to provide insight into the intermolecular interactions contributing to the stabilization of the ZnTPP aggregates, as shown in Table 2. The optimized structures are shown in Fig. S6 (Supporting information). It is speculated that correlation and dispersion interactions are the prime contributors to the binding for all the possible ZnTPP dimers. Large △Ecorr + △Edisp values lead to strong binding energies, showing that the dimer interaction belongs to typical van der Waals interaction. Moreover, a close look into the ratio of sum of correlation and dispersion interactions to the electrostatic interactions (△Ecorr + △Edisp)/△Eele, it is found that all the ZnTPP dimers fall in the category of the dispersion dominated clusters [47, 48]. All the above results reveal that ZnTPP aggregates are stabilized by dispersion interaction, which is due to the presence of π…π stacking between the ZnTPP monomers.
|
|
Table 2 The calculated decomposition of interaction energies (kcal/mol) of dimer ZnTPP. |
In summary, we report a comprehensive spectroscopic investigation towards the different aggregation states involved in tunable ZnTPP raw powder, nanorods, and nanosheets. Along with XRD characterization and UV–vis absorption spectroscopic analysis, we demonstrate the molecular packing behavior, weak intermolecular interactions of ZnTPP aggregates in mesoscale. ZnTPP nanorods and nanosheets exhibit distinguishable Raman spectra, enabling fingerprint identification for molecular aggregates and providing insights into an in-depth understanding of intermolecular interactions involved in complex chemical processes.
AcknowledgmentsThis work was financially supported by the National Project "Development of Advanced Scientific Instruments Based on Deep Ultraviolet Laser Source" (No. Y31M0112C1) and the National Basic Research Program of China (No. 2011CB808402). Z. Luo acknowledges the National Thousand Youth Talents Program and Young Professionals Program in Institute of Chemistry, Chinese Academy of Sciences (No. Y3297B1261). P. Su acknowledges the National Natural Science Foundation of China (No. 21373165).
Appendix A. Supplementary dataSupplementary data associated with this article can be found, in the online version, at https://doi.org/10.1016/j.cclet.2017.11.009.
| [1] |
J.D. Dunitz, A. Gavezzotti, Chem. Soc. Rev. 38 (2009) 2622-2633. DOI:10.1039/b822963p |
| [2] |
L. Bouteiller, P. van der Schoot, J. Am. Chem. Soc. 134 (2012) 1363-1366. DOI:10.1021/ja210706v |
| [3] |
Z.M. Hudson, I. Manners, Science 344 (2014) 482-483. DOI:10.1126/science.1254140 |
| [4] |
S.R. Amrutha, M. Jayakannan, J. Phys. Chem. B 112 (2008) 1119-1129. |
| [5] |
R. Hu, J. Feng, D.H. Hu, et al., Angew. Chem. Int. Ed. 49 (2010) 4915-4918. DOI:10.1002/anie.v49:29 |
| [6] |
S. Köhn, H. Kolbe, M. Korger, et al., Aggregation and Interface Behaviour of Carotenoids, in: G. Britton (Eds. ), Carotenoids, Birkhäuser Basel, Basel, 2008, pp. 53-98.
|
| [7] |
U. Adhikari, S. Scheiner, J. Chem. Phys. 135 (2011) 184306. DOI:10.1063/1.3660355 |
| [8] |
K.S. Kim, P. Tarakeshwar, J.Y. Lee, Chem. Rev. 100 (2000) 4145-4186. DOI:10.1021/cr990051i |
| [9] |
X.F. Ma, R. Sun, J.H. Cheng, et al., J. Chem. Educ. 93 (2016) 345-350. DOI:10.1021/acs.jchemed.5b00483 |
| [10] |
B.K. An, K.S. Ki, J.S. Don, P.S. Young, J. Am. Chem. Soc. 124 (2002) 14410-14415. DOI:10.1021/ja0269082 |
| [11] |
J.W. Chen, C.C.W. Law, J.W.Y. Lam, et al., Chem. Mater. 15 (2003) 1535-1546. DOI:10.1021/cm021715z |
| [12] |
A. Giardini, A. Paladini, F. Rondino, et al., Appl. Phys. A 93 (2008) 893-899. DOI:10.1007/s00339-008-4764-z |
| [13] |
Z.X. Luo, A.D. Peng, H.B. Fu, et al., J. Mater. Chem. 18 (2008) 133-138. DOI:10.1039/B715461E |
| [14] |
J. Chen, W.H. Ding, Z. Luo, B.H. Loo, J.N. Yao, J. Raman Spectrosc. 47 (2016) 623-635. DOI:10.1002/jrs.v47.6 |
| [15] |
Z. X. Luo, J. N. Yao, Raman Investigations of Atomic/Molecular Clusters and Aggregates, in: K. Maaz (Eds. ), Raman Spectroscopy and Applications, InTech, Rijeka, 2017, pp. 31-46.
|
| [16] |
N.S. Chong, K. Donthula, R.A. Davies, W.H. Ilsley, B.G. Ooi, et al., Vib. Spectrosc. 81 (2015) 22-31. DOI:10.1016/j.vibspec.2015.09.002 |
| [17] |
B. Subramanian, N. Tchoukanova, Y. Djaoued, et al., J. Raman Spectrosc. 45 (2014) 299-304. DOI:10.1002/jrs.v45.4 |
| [18] |
Z.X. Luo, B.H. Loo, X.Q. Cao, A.D. Peng, J.N. Yao, J. Phys. Chem. C 116 (2012) 2884-2890. DOI:10.1021/jp208566d |
| [19] |
M. Melchiorre, C. Ferreri, A. Tinti, C. Chatgilialoglu, A. Torreggiami, Appl. Spectrosc. 69 (2015) 613-622. DOI:10.1366/14-07706 |
| [20] |
G. Zajac, A. Kaczor, A. Pallares Zazo, et al., J. Phys. Chem. B 120 (2016) 4028-4033. DOI:10.1021/acs.jpcb.6b02273 |
| [21] |
R.P. Cooney, C.G. Barraclough, T.W. Healy, J. Phys. Chem. 87 (1983) 1868-1873. DOI:10.1021/j100234a009 |
| [22] |
R. Gaufrès, J.L. Bribes, S. Sportouch, J. Ammour, J. Maillols, J. Raman Spectrosc. 19 (1988) 149-153. DOI:10.1002/jrs.v19:3 |
| [23] |
P. Wang, L.M. Fu, J.P. Zhang, et al., Chem. Phys. Lett. 458 (2008) 175-179. DOI:10.1016/j.cplett.2008.04.094 |
| [24] |
P. An, C.Q. Yuan, X.H. Liu, D.B. Xiao, Z.X. Luo, Chin. Chem. Lett. 27 (2016) 527-534. DOI:10.1016/j.cclet.2016.01.036 |
| [25] |
Z.X. Luo, J.C. Smith, T.M. Goff, J.H. Adair, A.W. Castleman, Chem. Phys. 423 (2013) 73-78. DOI:10.1016/j.chemphys.2013.06.021 |
| [26] |
Z.X. Luo, Y.S. Zhao, W.S. Yang, et al., J. Phys. Chem. A 113 (2009) 9612-9616. DOI:10.1021/jp9041028 |
| [27] |
X.L. Zhang, J.W. Jiang, Y.T. Liu, et al., Sci. Rep. 6 (2016) 22756. DOI:10.1038/srep22756 |
| [28] |
H.H. Li, L.L. Jie, J.N. Pan, L.T. Kang, J.N. Yao, J. Mater. Chem. A 4 (2016) 6577-6584. DOI:10.1039/C6TA01582D |
| [29] |
W.T. Chen, Z.L. Yao, J.W. Wen, X.G. Yi, Z.G. Luo, J. Chem. Res. 37 (2013) 491-493. DOI:10.3184/174751913X13736450723137 |
| [30] |
L. Chen, Y. Gao, Y. Cheng, et al., J. Phys. Chem. C 119 (2015) 17429-17437. DOI:10.1021/acs.jpcc.5b04453 |
| [31] |
J. Chen, H.Y. Zhang, X.H. Liu, et al., Phys. Chem. Chem. Phys. 18 (2016) 7190-7196. DOI:10.1039/C5CP06892D |
| [32] |
E.A. Silinsh, C.B. Duke, Phys. Today 34 (1981) 64-66. |
| [33] |
M.W. Schmidt, K.K. Baldridge, J.A. Boatz, et al., J. Comput. Chem. 14 (1993) 1347-1363. DOI:10.1002/(ISSN)1096-987X |
| [34] |
P.F. Su, Z. Jiang, Z.C. Chen, W. Wu, J. Phys. Chem. A 118 (2014) 2531-2542. DOI:10.1021/jp500405s |
| [35] |
C.Q. Yuan, H.M. Wu, M.Y. Jia, et al., Phys. Chem. Chem. Phys. 18 (2016) 29249-29257. DOI:10.1039/C6CP04922B |
| [36] |
C. Berkdemir, A.W. Castleman, J.O. Sofo, Phys. Chem. Chem. Phys. 14 (2012) 9642-9653. DOI:10.1039/c2cp40509a |
| [37] |
L.T. Kang, H.B. Fu, X.Q. Cao, Q. Shi, J.N. Yao, J. Am. Chem. Soc. 133 (2011) 1895-1901. DOI:10.1021/ja108730u |
| [38] |
L.Q. Yun, L. Yong, L.H. Guo, et al., J. Phys. Chem. C 111 (2007) 7298-7301. DOI:10.1021/jp071256v |
| [39] |
S. Kladsomboon, S. Pratontep, T. Puntheeranurak, T. Kerdcharoen, J. Nanosci. Nanotechnol. 11 (2011) 10589-10594. DOI:10.1166/jnn.2011.4048 |
| [40] |
D. Rota Martir, G.J. Hedley, D.B. Cordes, et al., Dalton Trans. 45 (2016) 17195-17205. DOI:10.1039/C6DT02619B |
| [41] |
E.S. Emerson, M.A. Conlin, A.E. Rosenoff, et al., J. Phys. Chem. 71 (1967) 2396-2403. DOI:10.1021/j100867a003 |
| [42] |
Y. Hirohito, N. Masaya, I. Koichi, Chem. Lett. 11 (1982) 1397-1400. DOI:10.1246/cl.1982.1397 |
| [43] |
V.A. Walters, J.C. De Paula, G.T. Babcock, G.E. Leroi, J. Am. Chem. Soc. 111 (1989) 8300-8302. DOI:10.1021/ja00203a053 |
| [44] |
S. Akimoto, A. Ohmori, I. Yamazaki, J. Phys. Chem. B 101 (1997) 3753-3758. DOI:10.1021/jp962711i |
| [45] |
D.L. Gerrard, W.F. Maddams, Appl. Spectrosc. 30 (1976) 554-555. DOI:10.1366/000370276774456778 |
| [46] |
M. Atamian, R.J. Donohoe, J.S. Lindsey, D.F. Bocian, J. Phys. Chem. 93 (1989) 2236-2243. DOI:10.1021/j100343a012 |
| [47] |
J. Řezáč, K.E. Riley, P. Hobza, J. Chem, Theo. Comput. 7 (2011) 34669-3470. |
| [48] |
P. Jurecka, J. Sponer, J. Cerny, P. Hobza, Phys. Chem. Chem. Phys. 8 (2006) 1985-1993. DOI:10.1039/B600027D |