 2016, Vol. 27


b Tianjin Key Laboratory of Biosensing and Molecular Recognition, Tianjin 300071, China; ;
c State Key Laboratory of Medicinal Chemical Biology, Tianjin 300071, China ;
d Collaborative Innovation Center of Chemical Science and Engineering, Tianjin 300071, China
Chronic kidney disease is now recognized as a worldwide public health problem with an increasing prevalence [1, 2]. In the early stage of the disease process, patients frequently experience no symptoms at all. However, even in the absence of symptoms, chronic kidney disease negatively affects various organs, raises the risk of cardiovascular events, and increases the risk of hospitalization and death [3]. Fortunately, current evidence has proved that some of the adverse outcomes can be delayed or even prevented by early detection and treatment [4, 5]. A common clinical practice to identify and monitor the patients with kidney damage is testing the urine for albumin. Urine dipstick test is widely used as an initial screening tool for detecting proteinuria because of its low cost and wide availability [6]. However, the detection limit of urine dipstick is about 250 mg/L, which is much higher than the normal limit [7]. The decision of normal limit for urine albumin reported by laboratories varied from 15 mg/L to 30 mg/L [8], and recent studies have found that both renal and cardiovascular risks begin to increase at levels currently considered to be in the normal range [9]. Therefore, accurate and precise measurement of urinary albumin is essential in clinical medicine for kidney diseases. Routine laboratory methods to determine albumin in urine are based on albumin-specific assays [10, 11]. Since they are based on highly specific interactions between the protein of interest and a targeted antibody, some immunoassays allow detection of very low amounts of albumin in urine. However, immunochemical methods are usually subjected to weak antibody affinity, crossreactivity, or denatured epitopes, and thus potentially bias the total albumin measurement [12]. Recently, the combination of internal standards and mass spectrometry (MS) has emerged as a powerful means for quantitative proteomics [13-16]. MS-based approaches do not require the generation of antibodies and can provide the level of molecular specificity and breadth of unbiased proteome coverage. Among the many types and configurations of mass spectrometer, liquid chromatography coupled to tandem mass spectrometry (LC-MS/MS) is perhaps the most commonly used method for MS-based proteomics studies. However, optimizing the performance of an LC-MS/MS system for quantitative proteomics measurements can be a challenging work, and absolute quantification methods for LC-MS/MS-based proteomics require internal standards, such as stable isotope-labeled proteins or peptides with known concentrations [17].
For routine operation, rapid analysis and inexpensive disposables (or no disposables) are desirable. While the method should be reliable, easily automated, the results should be accurate and precise [18]. Near-infrared diffuse reflectance spectroscopy (NIRDRS) has been proved to be a fast, convenient and nondestructive analytical method. Combining with chemometrics, accurate determination can be achieved [19-21]. Each NIRDRS measurement spend only less than 1 min. For protein analysis, quantification by NIRDRS does not need antibodies or internal standards. Therefore, NIRDRS in combination with chemometrics has the potential to be an effective analytical method for clinical laboratory measurements. However, drawback of near-infrared (NIR) spectroscopic analysis is its high detection limit. Much effort has been done for improving the detection limit. Among various trials, enrichment technique in combination with NIRDRS has been proved to be an efficient way [22]. In our previous works, low content substances, such as metal ions [23, 24], organic acids [25], phenolic compounds [26], and deoxyribonucleic acid [27], etc. in complex matrix have been detected by NIRDRS combined with preconcentration. The detection limit of deoxyribonucleic acid in dilute solutions with interferences can be as low as 3 mg/L [27], and the measurement was directly performed with the absorbent without desorption. Therefore, an NIR-based method for the accurate and precise quantitation of urinary albumin in urine may be developed as a candidate for quantitative determination of urinary albumin.
This work is devoted to investigate the feasibility of the quantification for albumin in urine by NIRDRS combined with preconcentration and chemometric modeling. Thiourea-functionalized silica (TF-SiO2) nanoparticles were used for preconcentration of albumin from urine solution. Then NIRDRS was applied to measure the adsorbent with the adsorbate directly without desorption. Partial least squares (PLS) regression was used as a calibration tool for modeling the weak spectral signal of albumin in the complex spectra of the absorbent, including the strong spectral responses of TF-SiO2 nanoparticles. Signal processing techniques were used to optimize the model. The NIR-based method offers a new idea for urinary albumin detection method and could be rather helpful for early diagnosis of kidney disease.
2. ExperimentalChemical reagents, including ethanol, toluene and acetone, are of analytical purity grade. Thiourea (99%), silicon dioxide (SiO2, 99.5%, particle size: 50 nm), and cyanuric chloride (99%) were purchased from Aladdin Chemistry Co., Ltd. (Shanghai, China). (3- Aminopropyl)triethoxysilanne (APTES, 98%) was provided by Shanghai Macklin Biochemical Co., Ltd. (Shanghai, China) and methanesulfonic acid (70% aq. soln.) was provided by Alfa Aesar Chemistry Co., Ltd. (Tianjin, China). Human albumin serum (HSA, 96%-99%) was obtained from Takara Bio Co., Ltd (Tianjin, China). Pure water was obtained from Tianjin Wahaha Co., (Tianjin, China). Urine samples were collected anonymously from laboratory healthy voluntary donors. The supernatant of the urine was stored at -20 ℃ after centrifuged for 15 min at 3000 rpm using a TDL-5-A centrifuge (Anting Scientific Instrument Factory, Shanghai, China). The urinary albumin concentration was measured by a human microalbuminuria enzyme linked immunosorbent assay (ELISA) kit produced by Cusabio Biotech Co., Ltd. (Wuhan, China), and the absorbance was read on a Synergy 2 Multi-mode Microplate Reader (Bio-Tek, Vermont, USA). The urinary albumin concentration of the mixed urine sample was calculated to be 1.18 mg/L according to its absorbance. A 5.00 g/L stock solution of HSA was prepared in water, and all the urine samples were prepared by adding HSA solution in 3-fold diluted urine to reach a series of final concentrations ranging from 1.89 mg/L to 30.39 mg/L. 40 samples were prepared to establish the calibration model, and 17 samples were prepared for validation of themethod. Among the 17 samples, there were 7 different concentrations of urine solutions with duplicates foreach to check the reproducibility of themodel, andone concentration with triplicates was prepared to calculate the relative standard deviation (RSD) value besides the reproducibility.
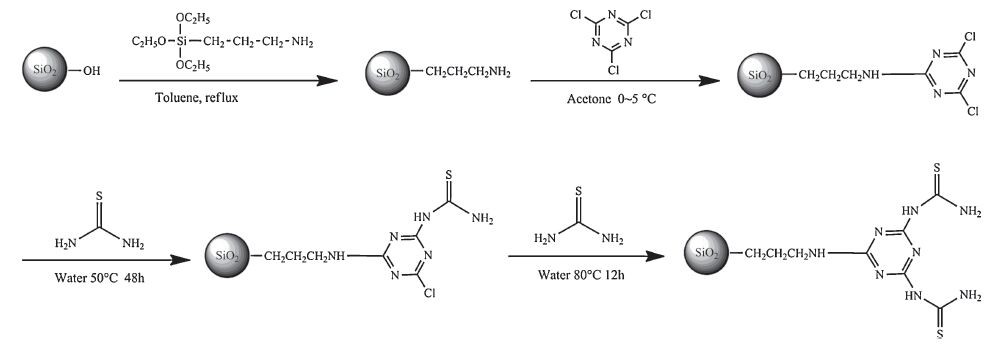
The reaction scheme for the preparation of TF-SiO2 nanoparticles is shown in Fig. 1. Firstly, amine-functionalized silica (AFSiO2) nanoparticles were prepared through two steps of hydroxylation and condensation according to the published method [28]. SiO2 (40 g), methanesulfonic acid (21.5 mL) and pure water (278.5 mL) were added into flask. After stirred and refluxed for 6 h, the suspension solution was centrifuged, washed with pure water to neutral, and dried. The product was added into flask with APTES and toluene. AF-SiO2 nanoparticles were obtained after stirred and refluxed for 6 h, and were washed by ethanol before dried in vacuum. Then, cyanuric-functionalized silica (CF-SiO2) nanoparticles were obtained according to the procedure described in a previous article with some modifications [29, 30]. Cyanuric chloride and AF-SiO2 nanoparticles in molar ratio of 1:1 were added into acetone that cooled in ice bath. The reaction was under continuously stirring and the temperature was kept at 0-5 ℃.
NaHCO3 NaHCO3 was then simultaneously added dropwise. After centrifugation and washing, CF-SiO2 nanoparticles were dried under vacuum. Finally, TF-SiO2 nanoparticles were prepared by condensation of thiourea and triazine ring of CF-SiO2 nanoparticles [30]. Thiourea and CF-SiO2 nanoparticles in molar ratio of 2:1 were added into water. After stirring at 50 ℃ for 12 h, the temperature was raised to 80 ℃ and kept for 6 h. The product was then centrifuged and washed for 5 times before dried under vacuum.
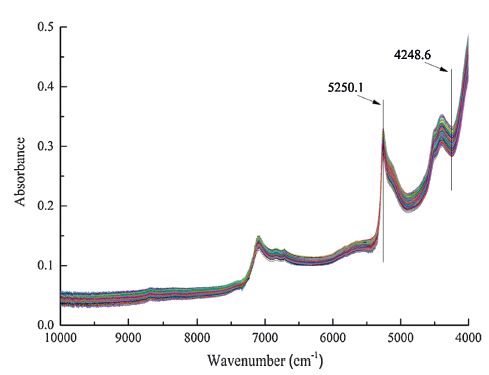
The adsorption operation was carried out by adding 0.30 g TFSiO2 nanoparticles and 100 mL of urine samples into a conical flask. After shaken for 3 min at room temperature (25 ℃), the solution was filtered by vacuum pump. The solids were further air-dried under room temperature. The adsorbent with analyte was then directly measured to obtain NIR spectra. Before the measurement, Vertex 70 spectrometer (Bruker Optics, Ettlingen, Germany) was balanced at 25 ℃ for 2 h. The reference spectrum was obtained by the gold-coated background auxiliary provided with the instrument. NIR spectra of the samples were measured on the spectrometer with near infrared integrating sphere diffuse reflection accessory (Bruker Optics, Ettlingen, Germany). The wavenumber range of the measurement is from 10, 000 cm-1 to 4000 cm-1, and the spectra were digitalized with ca. 2 cm-1 interval in Fourier transform. Scan number of both reference and sample spectra was set as 64 to increase signal to noise ratio. For each sample, three parallel measurements were performed to obtain an average spectrum. Fig. 2 shows the averaged spectra of the 57 samples.

|
Download:
|
| Figure 1. The schematic diagram for synthesis of TF-SiO2 nanoparticles. | |

|
Download:
|
| Figure 2. NIR spectra of the samples. | |
Owing to the low content, it is difficult to recognize the information of albumin in the spectra. Therefore, PLS modeling was used for the quantitative analysis. To select informative wavenumber region, the software package OPUS 6.0 (Bruker, Ettlingen, Germany) was used initially. The principle of the method is the combination of different signal processing methods and wavenumber regions. The wavenumber regions that produced the best results in cross validation were selected. The calculation of PLS regression was then completed on Matlab (MathWorks, USA) platform. 40 calibration samples were used to establish the quantitative model. The latent variable (LV) number used during the construction of the model was determined by Monte Carlo cross validation (MCCV) [31]. The performance of the model was assessed according to its correlation coefficient (R), root mean squared error of cross validation (RMSECV) and residual predictive deviation (RPD). The predictability of the model was evaluated by R and root mean square error of prediction (RMSEP) of validation samples. To optimize the model, signal processing techniques including standard normal variate (SNV) [32], multiplicative scatter correction (MSC) [33], Savitzky-Golay (SG) smoothing [34], continuous wavelet transform (CWT) [35] and derivative [36] were adopted. SNV and MSC are used to correct the scattering effect in the spectra measurements. SG smoothing serves to denoise the spectra. CWT can eliminate both the variant background and the noise. Derivative was performed to remove baseline variations while SG algorithm [34] was used in this process to suppress the effect of fluctuating noise.
3. Results and discussionCharacterization of the TF-SiO2 nanoparticles was performed by a MAGNA-IR 560 Fourier transformation infrared spectroscopy (FT-IR, Nicolet, USA) and an Axis Ultra DLD X-ray photoelectron spectroscopy (XPS, Kratos Analytical, UK) analysis. In FT-IR spectrum, a broad band at 3421 cm-1 attributes to OH stretching frequency, overlapping the amino stretching band in the same region. The bands at 1629.6 cm-1, 1533.4 cm-1 and 1450.2 cm-1 can be assigned to the skeletal stretching vibrations in the triazine ring. The band at 1101.2 cm-1 corresponds to Si-O-Si stretching frequency and 802.2 cm-1 corresponds to Si-O stretching frequency. These facts support that the cyanuric chloride is successfully grafted on the surface of the nanoparticles. The results of XPS show that CF-SiO2 nanoparticles contain 5.09% chlorine, and TF-SiO2 nanoparticles contain 1.34% sulfur without chlorine, which proves that chlorine has been substituted by thiourea in the triazine ring. The results demonstrate the successful modification of thiourea group.
To optimize the adsorption time, adsorption rate under different adsorption time was investigated. 0.30 g adsorbent and 100 mL 100 mg/L HSA solution were used to conduct the experiment. The adsorption rate changing from 1 min to 20 min was investigated. The results suggest that the adsorption rate increases with the adsorption time until 96.9% at 3 min, and then the value becomes almost a constant. Therefore, 3 min was used in this study.
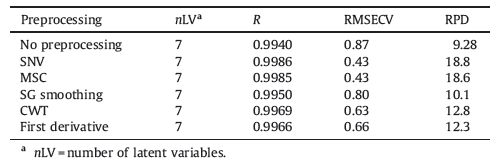
The optimal wavenumber region selected by OPUS 6.0 is 5250.1-4248.6 cm-1, as labeled in Fig. 2. PLS model was then built by both raw and processed spectra. Five spectral processing methods mentioned in the experimental section were used to optimize the model. Results obtained by different signal processing techniques were summarized in Table 1. As mentioned above, LV numbers for each model were determined by using MCCV. The models were assessed by the three parameters of R, RMSECV and RPD. A RPD value over 5.0 is generally a criterion for a model that acceptable for accurate quantitative analysis [37, 38]. All the RPD values in the table are much higher than 5.0, indicating that all the models can offer accurate quantitative results.
|
|
Table 1 PLS models and results of cross validation. |
From the results in Table 1, it can be seen that the raw model is acceptable for quantitative determination and signal preprocessing can further improve the model. Although the improvement of CWT, first derivative and SG smoothing are not so significant, the improvements of SNV and MSC are distinct. As mentioned above, SNV and MSC are used to correct the scattering effect in the spectra measurements. Therefore, it can be inferred that scattering effect has a great impact on the deviation. In this work, SNV was selected for signal preprocessing to obtain a minimal error. The values of RPD and R are 18.8 and 0.9986, respectively. The RESECV value can be as low as 0.43.
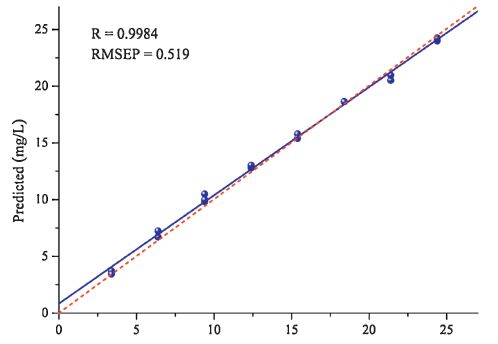
For studying the reliability of the optimizedmodel, 17 samples were used for further external validation. The experiment conditions of adsorption and spectral measurement were the same as that for the model construction. The prediction was based on the optimized model. Fig. 3 shows the relationship between the reference values and predicted concentrations of the samples in the validation set. The fitted straight linewas obtained by least square regression. The values of R and RMSEP are 0.9984 and 0.519, respectively. The recoveries of the 17 samples calculated in the range of 3.39-24.39 mg/L are between 95.9%- 113.1%. The differences between two predicted values were less than 0.7 mg/L, which proves the reproducibility of the method. Moreover, RSD, an indicator to evaluate the repeatability, was calculated from the three predicted values of the triplicate samples. The RSD value for the samples with concentration of 9.393 mg/L is 3.5%.

|
Download:
|
| Figure 3. Relationship between the reference values and the predicted concentrations. The straight line was obtained by least square fitting, and the dot line shows the diagonal of the plot. | |
4. Conclusion
A method for quantitative analysis of urinary albumin in normal concentration was developed by using NIRDRS combined with preconcentration. In this method, TF-SiO2 nanoparticles were used as adsorbent for enrichment of urinary albumin to enhance the sensitivity, measurement and prediction were then performed by NIRDRS and PLS regression. The recoveries are from 95.9% to 113.1% with an acceptable reproducibility in spite of the existence of other interfering substances. The concentration that can be quantitatively determined is 1.89 mg/L, which is far below the limit level of normal urinary albumin concentration range. As the urine solution used in this work is uniform, mixed by different samples, the compositional variation was not considered in the experiment. Although further works are still needed, the method may provide a simple and efficient way for fast quantification of urinary albumin, especially for clinical preliminary diagnosis.
AcknowledgmentsThis work is supported by National Natural Science Foundation of China (No. 21475068) and MOE Innovation Team (No. IRT13022) of China.
| [1] | S.J. Chadban, E.M. Briganti, P.G. Kerr, et al. Prevalence of kidney damage in Australian adults:the AusDiab kidney study. J. Am. Soc. Nephrol. 14 (2003) S131–S138. DOI:10.1097/01.ASN.0000070152.11927.4A |
| [2] | L.X. Zhang, F. Wang, L. Wang, et al. Prevalence of chronic kidney disease in China:a cross-sectional survey. Lancet 379 (2012) 815–822. DOI:10.1016/S0140-6736(12)60033-6 |
| [3] | A.S. Levey, J. Coresh, E. Balk, et al. National Kidney Foundation practice guidelines for chronic kidney disease:evaluation, classification, and stratification. Ann. Intern. Med. 139 (2003) 137–147. DOI:10.7326/0003-4819-139-2-200307150-00013 |
| [4] | G.T. Hernandez, H. Nasri. World Kidney Day 2014:increasing awareness of chronic kidney disease and aging. J. Renal. Inj. Prev. 3 (2014) 3–4. |
| [5] | W.G. Couser, G. Remuzzi, S. Mendis, M. Tonelli. The contribution of chronic kidney disease to the global burden of major noncommunicable diseases. Kidney Int. 80 (2011) 1258–1270. DOI:10.1038/ki.2011.368 |
| [6] | D. Lim, D.Y. Lee, S.H. Cho, et al. Diagnostic accuracy of urine dipstick for proteinuria in older outpatients. Kidney Res. Clin. Pract. 33 (2014) 199–203. DOI:10.1016/j.krcp.2014.10.003 |
| [7] | J. Barratt, P. Topham. Urine proteomics:the present and future of measuring urinary protein components in disease. Can. Med. Assoc. J. 177 (2007) 361–368. DOI:10.1503/cmaj.061590 |
| [8] | W.G. Miller, D.E. Bruns, G.L. Hortin, et al. Current issues in measurement and reporting of urinary albumin excretion. Clin. Chem. 55 (2009) 24–38. |
| [9] | P.A. McFarlane. Testing for albuminuria in 2014. Can. J. Diabetes 38 (2014) 372–375. DOI:10.1016/j.jcjd.2014.07.221 |
| [10] | A. Shaikh, J.C. Seegmiller, T.M. Borland, et al. Comparison between immunoturbidimetry, size-exclusion chromatography, and LC-MS to quantify urinary albumin. Clin. Chem. 54 (2008) 1504–1510. DOI:10.1373/clinchem.2008.107508 |
| [11] | R. Liu, G. Li, X.F. Cui, et al. Methodological evaluation and comparison of five urinary albumin measurements. J. Clin. Lab. Anal. 25 (2011) 324–329. DOI:10.1002/jcla.20477 |
| [12] | J.R. Barr, V.L. Maggio, D.G. Patterson Jr., et al. Isotope dilution-mass spectrometric quantification of specific proteins:model application with apolipoprotein A-I. Clin. Chem. 42 (1996) 1676–1682. |
| [13] | J.C. Seegmiller, D.R. Barnidge, B.E. Burns, et al. Quantification of urinary albumin by using protein cleavage and LC-MS/MS. Clin. Chem. 55 (2009) 1100–1107. DOI:10.1373/clinchem.2008.115543 |
| [14] | J.M. Dersch, T.T.T.N. Nguyen, J. Østergaard, S. Stürup, B. Gammelgaard. Selective analysis of human serum albumin based on SEC-ICP-MS after labelling with iophenoxic acid. Anal. Bioanal. Chem. 407 (2015) 2829–2836. DOI:10.1007/s00216-015-8507-7 |
| [15] | E.P. Diamandis. Protein quantification by mass spectrometry:is it ready for prime time?. Clin. Chem 55 (2009) 1427–1430. DOI:10.1373/clinchem.2009.128058 |
| [16] | A. Beasley-Green, N.M. Burris, D.M. Bunk, K.W. Phinney. Multiplexed LC-MS/MS assay for urine albumin. J. Proteome Res. 13 (2014) 3930–3939. DOI:10.1021/pr500204c |
| [17] | A.M. Hawkridge. Practical considerations and current limitations in quantitative mass spectrometry-based proteomics, in:C.E. Eyers, S.J. Gaskell (Eds.), Quantitative Proteomics. RSC Publishing, Cambridge (2014) pp.3–25. |
| [18] | J.W. Hall, A. Pollard. Near-infrared spectrophotometry:a new dimension in clinical chemistry. Clin. Chem. 38 (1992) 1623–1631. |
| [19] | W.J. Dong, Y.N. Ni, S. Kokot. Quantitative analysis of two adulterants in Cynanchum stauntonii by near-infrared spectroscopy combined with multi-variate calibrations. Chem. Pap. 66 (2012) 1083–1091. |
| [20] | X.G. Shao, X.H. Bian, J.J. Liu, M. Zhang, W.S. Cai. Multivariate calibration methods in near infrared spectroscopic analysis. Anal. Methods 2 (2010) 1662–1666. DOI:10.1039/c0ay00421a |
| [21] | C.J. Cui, W.S. Cai, X.G. Shao. Near-infrared diffuse reflectance spectroscopy with sample spots and chemometrics for fast determination of bovine serum albumin in micro-volume samples. Chin. Chem. Lett. 24 (2013) 67–69. DOI:10.1016/j.cclet.2012.12.012 |
| [22] | X.M. Wei, Z.X. Huang, W. Zhang, Y.P. Du. Improving the sensitivity of NIR spectroscopy with an enrichment technique:determining a trace analyte of ethyl carbamate. Anal. Sci. 23 (2007) 853–856. DOI:10.2116/analsci.23.853 |
| [23] | J.H. Li, Y. Zhang, W.S. Cai, X.G. Shao. Simultaneous determination of mercury, lead and cadmium ions in water using near-infrared spectroscopy with preconcentration by thiol-functionalized magnesium phyllosilicate clay. Talanta 84 (2011) 679–683. DOI:10.1016/j.talanta.2011.01.072 |
| [24] | N. Sheng, W.S. Cai, X.G. Shao. An approach by using near-infrared diffuse reflectance spectroscopy and resin adsorption for the determination of copper, cobalt and nickel ions in dilute solution. Talanta 79 (2009) 339–343. DOI:10.1016/j.talanta.2009.03.059 |
| [25] | Y. Hao, W.S. Cai, X.G. Shao. A strategy for enhancing the quantitative determination ability of the diffuse reflectance near-infrared spectroscopy, Spectrochim. Acta A Mol. Biomol. Spectrosc 72 (2009) 115–119. DOI:10.1016/j.saa.2008.08.011 |
| [26] | Y. Zhang, Y. Hao, W.S. Cai, X.G. Shao. Simultaneous determination of phenol and p-nitrophenol in wastewater using near-infrared diffuse reflectance spectroscopy with adsorption preconcentration. Anal. Methods 3 (2011) 703–708. DOI:10.1039/c0ay00775g |
| [27] | Y.F. Yang, J.R. Tu, W.S. Cai, X.G. Shao. Feasibility for quantitative determination of deoxyribonucleic acid by using near-infrared diffuse reflectance spectroscopy. Talanta 99 (2012) 871–874. DOI:10.1016/j.talanta.2012.07.049 |
| [28] | L.J. Liu, R.X. Zhuo. Activation and silanization of porous silica beads. Ion Exch. Adsorpt. 11 (1995) 541–544. |
| [29] | G.B. Yang, D.M. Xu, Z.L. Zhao, K.D. Zhang. Synthesis and characterization of a sixarm initiating core containing 1,3,5-triazine. Chem. Res. Appl. 21 (2009) 243–247. |
| [30] | L.S. Bai, X.Y. Wen. Preparation of thiourea modified crosslinked chitosan and its adsorption to bovine serum albumin. J. Anhui Univ. Tech. 23 (2006) 399–403. |
| [31] | S. Wold. Cross-validatory estimation of the number of components in factor and principal components models. Technometrics 20 (1978) 397–405. DOI:10.1080/00401706.1978.10489693 |
| [32] | R.J. Barnes, M.S. Dhanoa, S.J. Lister. Standard normal variate transformation and de-trending of near-infrared diffuse reflectance spectra. Appl. Spectrosc. 43 (1989) 772–777. DOI:10.1366/0003702894202201 |
| [33] | P. Geladi, D. MacDougall, H. Martens. Linearization and scatter-correction for near-infrared reflectance spectra of meat. Appl. Spectrosc. 39 (1985) 491–500. DOI:10.1366/0003702854248656 |
| [34] | A. Savitzky, M.J.E. Golay. Smoothing and differentiation of data by simplified least squares procedures. Anal. Chem. 36 (1964) 1627–1639. DOI:10.1021/ac60214a047 |
| [35] | X.G. Shao, A.K.M. Leung, F.T. Chau. Wavelet:a new trend in chemistry. Acc. Chem. Res. 36 (2003) 276–283. DOI:10.1021/ar990163w |
| [36] | S.J. Baek, A. Park, J. Kim, A.G. Shen, J.M. Hu. A simple background elimination method for Raman spectra, Chemom. Intel. Lab. Syst 98 (2009) 24–30. DOI:10.1016/j.chemolab.2009.04.007 |
| [37] | D.F. Malley, P.C. Williams. Use of near-infrared reflectance spectroscopy in prediction of heavy metals in freshwater sediment by their association with organic matter. Environ. Sci. Technol. 31 (1997) 3461–3467. DOI:10.1021/es970214p |
| [38] | M. Forouzangohar, D. Cozzolino, R.S. Kookana, et al. Direct comparison between visible near- and mid-infrared spectroscopy for describing diuron sorption in soils. Environ. Sci. Technol. 43 (2009) 4049–4055. DOI:10.1021/es8029945 |