 2016, Vol. 27


b Analytical and Testing Center, Soochow University, Suzhou 215123, China
Contamination by heavy metals can cause hazardous effects on the ecosystem and on the human health [1-3]. It is therefore very important to monitor, in real-time, the concentration of heavy metals in the environment with selective and sensitive sensors. A variety of analytical methods, including atomic/molecular absorption spectroscopy [4], inductively coupled plasma emission/mass spectrometry [5], electrochemical methods [6] and ion chromatography [7], have been reported and used successfully for the determination of heavy metals in environmental samples. Yet, there are still strong demands for developing simple, sensitive, selective and rapid methods with inexpensive instrumentation and consumables.
Semiconducting nanoparticles or QDs (quantum dots) are highly luminescent fluorophores which have attracted enormous attention in the applications of analytical chemistry [8-10]. The optical properties of QDs are very dependent on the size and surface property of the nanoparticles. The intensity of fluorescence emission can be changed as a result of the physical or chemical interactions between the QDs and a given chemical species. Moreover, QDs show considerable advantages over traditional organic fluorophores, including broad absorption and narrow emission spectra, high luminescence, and excellent stability against photo-bleaching. These unique properties of QDs can be employed to develop fluorescent probes for detecting various analytes if appropriate conditions are applied.
Chen and Rosenzweig [11] reported for the first time that Zn2+ and Cu2+ could be determined by using CdS QDs capped with thioglycerol and L-cysteine. From then on, a variety of QDs-based fluorescent sensors with the same principle have been reported for the detection of metal ions, e.g. Cu2+ [12], Pb2+ [13] and Hg2+ [14]. These fluorescent probes exhibited the distinct advantages, such as high sensitivity and low cost. However, they often suffered from the interference caused by the co-existing ions. In order to alleviate the interference, QDs functionalized with selective metal chelating reagents including diethyldithio-carbamate, dithizone, and rhodanine were synthesized and used for the determination of Cu2+ [15], Pb2+ [16] and Ag+ [17], respectively, in our laboratory.
In the present study, thiourea (TU) was employed to modify the surface of the core-shell CdSe/CdS QDs. The functionalized QDs were thus used as the fluorescence sensor for the determination of trace amount of mercury in environmental samples. TU is commonly used as a masking agent for reducing the interference of Hg2+ in titration analysis and molecular absorption spectrophotometry due to its specific and strong Hg2+ bonding capability. The objective of this study is to develop a sensitive and selective probe for the detection of mercury ions by exploring the unique properties of QDs and the specificity of TU.
2. Experimental 2.1. ApparatusFluorescence signals were acquired on an F-4600 fluorescence spectrophotometer (Hitachi, Japan). Ultraviolet-visible absorption spectra were obtained with a TU-1901 UV/vis spectrophotometer (Purkinje General, China). The transmission electron microscopic (TEM) images were taken by an FEI Tecnai G20 (FEI, Holland) with an acceleration voltage of 200 kV. The X-ray photoelectron spectroscopic measurements were conducted by an ESCALAB 250Xi (Thermo Scientific, UK). An Allegra 64R high-speed refrigerated centrifuge (Beckman, USA) was used to separate particles from solution. An AA240FS atomic absorption spectrometer (Varian, USA) with a cold vapor generation accessory was used for the verification test. A Delta 320 pH meter (Mettler-Toledo, Switzerland) was used to measure pH values.
2.2. ReagentsStandard stock mercury solution was purchased from Aladdin (Shanghai, China). Thiourea and other chemicals were provided by Sinopharm Chemical Reagent (Shanghai, China). All chemicals were of analytical-reagent grade except for nitric acid which was of guaranteed-reagent grade. Phosphate buffer solution was prepared by mixing an appropriate amount of 1/15 mol L-1 disodium hydrogen phosphate solution and 1/15 mol L-1 potassium dihydrogen phosphate solution [18]. Deionized water used for preparing aqueous solutions was obtained by a Milli-Q system (Millipore, USA).
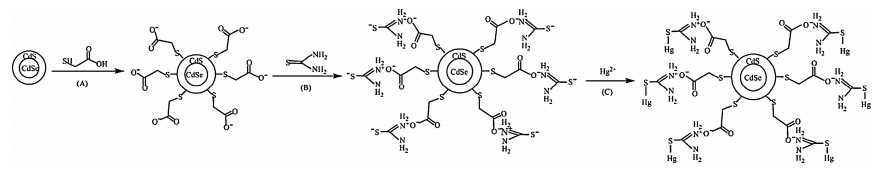
2.3. Synthesis of TU-functionalized QDsThe hydrophobic core-shell CdSe/CdS QDs were firstly synthesized in organic phase and then capped by TGA according to a previously reported method [19]. The capping of TGA is shown schematically in Fig. 1A. The exposed polar carboxylic acid group of TGA rendered the QDs water-soluble. The TGA capped QDs were then functionalized with TU by bonding TU to the TGA on the surface of CdSe/CdS QDs via electrostatic interaction. This process is shown in Fig. 1B schematically and is described as follows. 5 mL of 50 μmol L-1 TU ethanol solution were added to 5 mL of 0.25 g L-1 TGA capped QDs solution. The mixture was stirred for 1 h at r.t., allowing TU to bond to the TGA-capped QDs by means of electrostatic interaction. The functionalized QDs were then separated from the bulk solution via acetone precipitation and centrifugation. The resulting TU-functionalized QDs were redissolved in 10 mL of pH 7.17 phosphate buffer solution and stored in dark at 4 ℃ for further use.

|
Download:
|
| Figure 1. Scheme for the synthesis of TU-functionalized QDs (A and B) and the coordination of Hg2+ with the functionalized QDs (C). | |
2.4. Analytical procedure
A 100 μL of standard or sample solution of mercury and 200 μL of the TU-functionalized QDs were added to 700 μL of pH 7.73 PBS and mixed thoroughly for 10 min. The mixture was placed in a quartz cuvette with an optical path of 10 mm. Then the fluorescence spectrum of the solution was recorded at an excitation wavelength of 380 nm. Both of the excitation and emission slits were 10 nm. The fluorescence intensity of the solution at the maximum emission wavelength was used for quantitative analysis.
2.5. Sample preparationBoth water and soil samples were collected in the local industry area. After collection, water samples were filtered through a mixed cellulose membrane filter of 0.45 μm pore size. Then, 5 mL of nitric acid and 1 mL of hydrogen peroxide solution were added to the 100 mL filtered sample. The mixture were heated and boiled for 30 min. Soil samples were digested according to the procedure described in a Chinese National Standard Method [20]. The digested samples were diluted appropriately and adjusted to pH 4 with 1/15 mol L-1 phosphate buffer prior to analysis.
3. Results and discussion 3.1. Synthesis and characterization of TU-functionalized QDsAfter the core-shell CdSe/CdS QDs were synthesized in the organic phase, the modification of their surface was usually required by capping with some appropriate hydrophilic reagents such as TGA, L-cysteine, and thioglycerol [21-23]. These reagents were bonded to the QDs by coordinating with rich residual cadmium on the surface of QDs. The modification did not only improve their quality and stability, but also gave them water solubility which is requisite for the further application. In the beginning of this study, attempts were also made to cap the surface of QDs directly with TU. However, the mixture turned to an emulsion with the addition of TU to the QDs hexane solution. It was probably because the exposed amine groups of TU attached to the QDs were hydrophobic, resulting in the water-insolubility of the formed TU-capped QDs. Therefore, as shown in Fig. 1A, TGA was used in this study to cap the synthesized hydrophobic QDs prior to the bonding of TU. The TGA capped QDs precipitated immediately in the hexane solution owing to the exposed polar carboxylic acid groups of TGA. The precipitate was separated by centrifugation and ready to be dissolved in phosphate buffer solution.
As schematically shown in Fig. 1B, TU was then bonded to the TGA-capped QDs by means of electrostatic interaction. After the TGA-capped QDs were dissolved in phosphate buffer of pH 7.17, the carboxyl group of TGA on QDs was deprotonated, making the surface of QDs negatively charged [21]. Meanwhile, the nitrogen atom of TU was positively charged while the sulfur atom was negatively charged due to the intramolecular charge/electron transfer. Thus, the amine groups of TU with a positive charge could be electrostatically attracted onto the negatively-charged TGAcapped QDs to form the TU-functionalized QDs. The exposed negatively charged sulfur atom of TU was ready to coordinate with the analyte, Hg2+, as demonstrated in Fig. 1C.
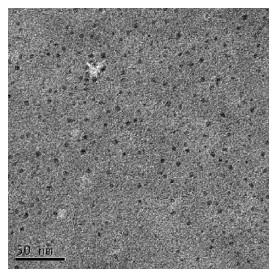
The morphology of the functionalized QDs was examined by the TEM. The TEM image, shown in Fig. 2, indicates that the QDs are dispersed spherically with the diameter ranging from 5 nm to 7 nm.

|
Download:
|
| Figure 2. TEM image of TU-functionalized QDs. | |
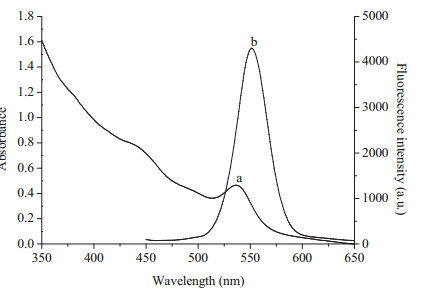
The prepared TU-functionalized QDs possessed excellent optical properties. The UV-vis absorption spectrum and fluorescence spectrum of the QDs are shown in Fig. 3. It can be noted that the QDs had a broad absorption spectrum with a maximum absorption at 536 nm. The emission band was fairly narrow and symmetrical with a full width at half maximum of 30 nm and the maximum emission wavelength was 551 nm. The functionalized QDs exhibited high optical stability without an obvious decrease of fluorescence intensity over a period of 2 weeks.

|
Download:
|
| Figure 3. UV–vis absorption spectrum (a) and fluorescence spectrum (b) of TUfunctionalized QDs. | |
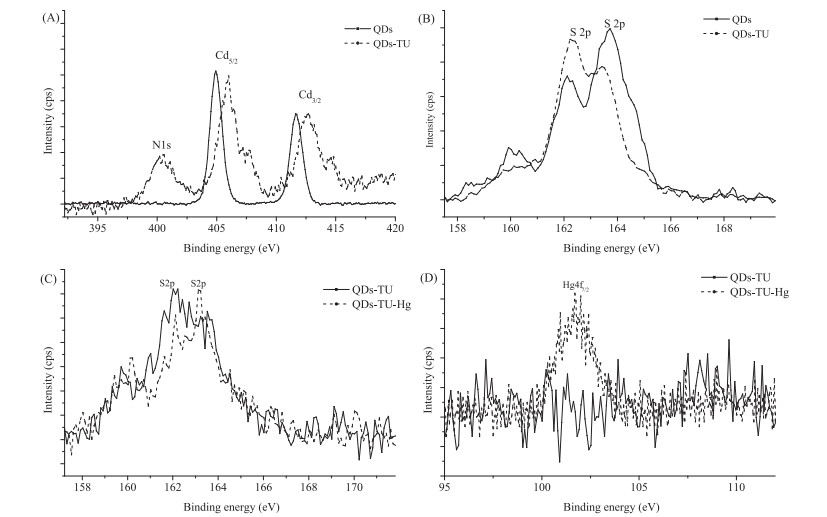
The surface analysis of QDs was conducted by X-ray photoelectron spectroscopy (XPS). As shown in Fig. 4A, a new peak at 400 kV (N 1s) appeared in the XPS spectra of TU-functionalized QDs. The peak was attributed to nitrogen atoms of TU which provided the evidence that TU had bound to the surface of QDs. The S 2p peak of TU-functionalized QDs was shifted to 162.5 eV from 164 eV for the QDs in Fig. 4B. It was due to the lower binding energy of the S5 5C bond of TU.

|
Download:
|
| Figure 4. XPS spectra of N 1s (A) and S 2p (B) of CdSe/CdS QDs (solid line) and TU-functionalized QDs (----), and XPS spectra of S 2p (C) and Hg 4f (D) of TU-functionalized QDs before (solid line) and after (----) addition of 10 mg L-1 Hg2+. | |
3.2. Optimization of TU bonded on QDs
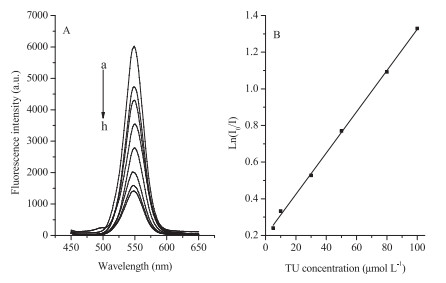
The TU-functionalized QDs provided the basis for mercury detection as it was observed that the fluorescence intensity of the QDs was decreased upon the coordination of the mercapto groups of TU with Hg2+. It is conceivable that the more TU bonded to the surface of QDs, the more coordination sites for Hg2+ and thus the wider linear range. However, as shown in Fig. 5, the fluorescence intensity of QDs decreased gradually with the binding of TU to the TGA-capped QDs. A linear relationship existed between the TU concentration and ln(0I/I), where I0and I are the luminescence of QDs without and with the addition of TU. This revealed that a static quenching process was involved [24-26]. The quenching was caused by the formation of a stable compound (Fig. 1B) via the reaction between the fluorophore (QDs in this study) and the quencher (TU in this study). A hydrophobic effect could enhance the static quenching due to the exposed amine groups of TU attached to the QDs. The relationship between ln(I0/I) and the concentration of the quencher could be expressed by the Perrin equation [24], ln(I0/I)=KpCTU, where Kp is the static quenching constant and CTU is the concentration of TU. This also indicated that TU had been bonded to the surface of the QDs [27].

|
Download:
|
| Figure 5. (A) Fluorescence spectra of TU-functionalized QDs with the addition of different TU concentrations. The TU concentrations added for spectrum (a) to (h) were 0, 5, 10, 30, 50, 80, 100, 120 μmol L-1, respectively. (B) Relationship between ln(I0/I) and TU concentration. | |
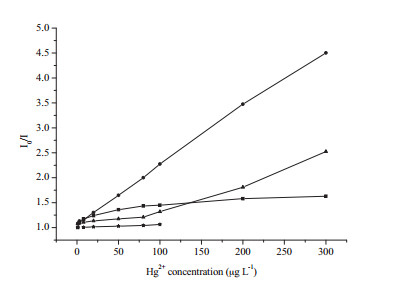
In order to optimize the amount of TU bonded to the surface of TGA-capped QDs, the effect of TU at different concentrations on the fluorescence intensity of the functionalized QDs after coordinating with Hg2+ was investigated. As shown in Fig. 6, the fluorescence of CdSe/CdS QDs without TU modification was not quenched significantly after Hg2+ was added. The addition of TU at lower concentration (10 μmol L-1) introduced less ligands for Hg2+ and caused lower quenching of the fluorescence of QDs, which led to a narrower linear range. On the other hand, higher TU concentration (100 μmol L-1) caused stronger quenching of fluorescence intensity and thus reduced the sensitivity. Therefore, 50 μmol L-1 TU was chosen in the preparation of TU-functionalized QDs as a compromise between sensitivity and linear range.

|
Download:
|
| Figure 6. Effect of TU at different concentrations on the fluorescence intensity of the functionalized QDs after coordinating with Hg2+. (★) 0 μmol L-1 TU; (■) 10 μmol L-1 TU; (●) 50 μmol L-1 TU; and (▲) 100 μmol L-1 TU. | |
3.3. Mechanism of Hg2+ on fluorescence quenching
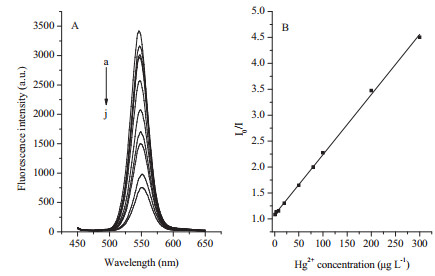
As shown in Fig. 7, the fluorescence intensity of the functionalizedQDs was quenched uponthe addition of Hg2+ and the extent of quenching was dependent on the concentration of Hg2+. It was proposed in this study that the quenching might be caused by the coordination of Hg2+ and TU bonded on the TGA-capped QDs. The coordination changed the physical property of the functionalized QDs, causing the decrease of fluorescence intensity [11].

|
Download:
|
| Figure 7. Fluoresccence spectra (A) and calibration plot of TU-modified QDs after the addition of different Hg2+ concentrations (B). The Hg2+ concentration for spectrum from (a) to (j) were 0, 1, 3, 8, 20, 50, 80, 100, 200, 300 μg L-1, respectively. | |
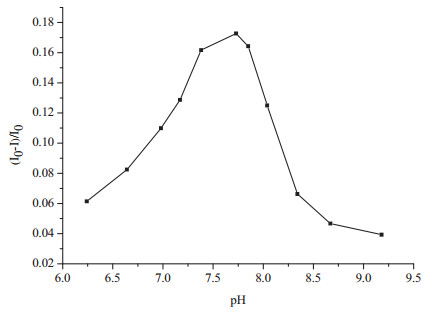
The proposal was firstly evaluated by investigating the effect of pH on the fluorescence intensity of the QDs with the addition of Hg2+. It can be seen in Fig. 8 that the pH of the solution had a significant effect on the fluorescence intensity. The quenching was intensified with the increase of pH and reached to the maximum at pH 7.73. This is because the thiol group of TU is deprotonated easily in a weakly alkaline solution which favors the coordination between TU and the soft acid, Hg2+. Yet, the fluorescence intensity of the functionalized QDs increased when the pH was higher than 8.04. This might be due to the decomposition of TU to sulfite and cyanamide at higher pHs [28] which recovered the fluorescence of the QDs.

|
Download:
|
| Figure 8. Effect of pH on the extent of fluoresccence quenching of TU-functionalized QDs with the addition of 20 μg L-1 Hg2+. | |
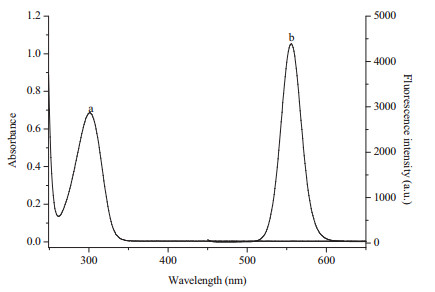
The coordination of TU and Hg2+ might take place either on the surface of QDs, or in the solution. If it were the latter case, which means TU was stripped from the QDs by Hg2+, the fluorescence of QDs would be recovered [29]. Yet, it was quenched in this study. In addition, as shown in Fig. 9, the absorption spectrum of the Hg2+-TU complex does not overlap the emission spectrum of the QDs. The inner filtration of fluorescence, one of the common causes for quenching, was thus ruled out. Therefore, it can be deduced that the coordination took place on the surface of QDs. This conclusion was also supported by the XPS data. As shown in Fig. 4C, S 2p peak of QDs-TU-Hg2+ was shifted to 163.5 eV from 162 eV for the TU-functionalized QDs. The Hg 4f peak appeared in Fig. 4D. These data revealed that Hg2+ had been coordinated with TU on the surface of QDs.

|
Download:
|
| Figure 9. Absorption spectrum of Hg2+-TU complex (a) and emission spectrum of TUQDs conjugates (b). | |
The coordination between Hg2+ and TU on the surface of QDs promoted the electron transfer process in the complex of QDs-TU-Hg2+. Following the photoexcitation of QDs, the excited electron in the conduction band of QDs could be easily transferred through TU to Hg2+. The electron transfer interdicted the radiative recombination process and thus quenched the fluorescence of QDs, as suggested previously in other reports [30-32]. It was therefore concluded that the electron transfer is the primary mechanism for fluorescence quenching in this study.
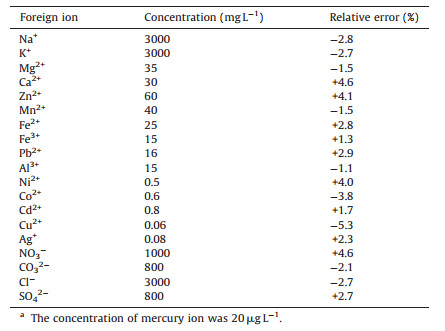
3.4. Interference studyTo evaluate the selectivity of the developed sensor, the effect of potentially interfering ions commonly present in water and soil samples were investigated. The results are shown in Table 1. It could be seen that the probe was generally free from the foreign ions. In particular, most transition metal ions except Cu2+ exhibited a negligibly adverse effect in the tested concentration on the determination of Hg2+. This could be ascribed to the strong and specific Hg2+ bonding capacity of TU introduced on the QDs. The association constants of TU and some of transition metal ions are 1.9 × 1026 (Hg2+), 2.5 × 10¹⁵ (Cu2+), 1.2 × 10¹³ (Ag+), 3.5 × 10³ (Cd2+), 1.1 × 10² (Pb2+), and 2.7 × 10⁶ (Fe2+) [33]. The association constant of TU-Hg2+ is the highest among these transition metal ions, which ensured the superior selectivity of the sensor. Yet, it should be noted that Cu2+ spiked at the concentration of 60 μg L-1 could cause some interference with the detection of Hg2+, showing quenching of the fluorescence. In the case of analyzing samples with higher Cu2+ concentration, the interference might be alleviated with potassium cyanide as masking agent [34].
|
|
Table 1 Effect of foreign ions on the fluorescence intensity of TU-functionalized QDsa. |
3.5. Analytical performance of TU-functionalized QDs
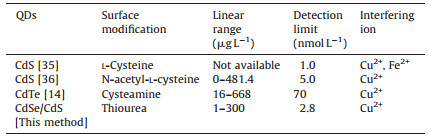
As shown in Fig. 7, the fluorescence of as-prepared TUfunctionalized QDs was continuously quenched with the increase of Hg2+ concentration. A linear relationship between I0/I and Hg2+ concentration in the range of 1-300 μg L-1 was obtained, which could be used for the quantification of Hg2+. The regression equation is I0/I=1.082 + 0.0116 × CHg (r=0.9989), where I and I0 were the fluorescence intensity of TU-functionalized QDs with and without the addition of Hg2+ at a given concentration, CHg, respectively. A detection limit of 0.56 μg L-1 (3σ) was achieved and the relative standard deviation was 1.6% (n=11) for the measurements of 20 μg L-1 Hg2+. It can be seen from Table 2 that the developed method exhibited lower detection limit than those previously reported methods based on QDs.
|
|
Table 2 Comparison of the QDs-based fluorescent probes for Hg2+ determination. |
3.6. Application on environment sample analysis
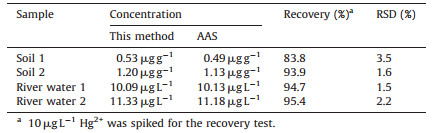
The developed fluorescent sensor was successfully applied to several environmental samples and the results are presented in Table 3. The accuracy of the developed method was evaluated by analyzing the samples by atomic absorption spectroscopy (AAS). The relative standard deviation which was used for evaluating the precision of the method is lower than 3.5%, which was obtained by repeating the experiment three times to measure the PL data under the same conditions. The average recovery is between 83.8% and 95.4%, indicating that the method is reliable for mercury detection. Meanwhile, the analysis results are in good agreement with those given by AAS method.
|
|
Table 3 Determination of mercury in environmental samples (n=3). |
4. Conclusion
A new sensor using TU functionalized QDs was developed and applied successfully to the determination of mercury in environmental samples. It showed excellent sensitivity and superior selectivity due to the strong and specific bonding capability of TU with mercury ions and the unique photoluminescence properties of the QDs. The principle of detection may be extended to the analysis of other analytes, if appropriate reagents are attached to QDs.
AcknowledgmentThe authors are grateful for the financial support from the National Natural Science Foundation of China (Nos. 20345006 and 20575043).
| [1] | Clarkson T.W., Magos L., Myers G.J.. The toxicology of mercury-current exposures and clinical manifestations. N. Engl. J. Med. 349 (2003) 1731–1737. DOI:10.1056/NEJMra022471 |
| [2] | Müller A.K., Westergaard K., Christensen S., Sørensen S.J.. The effect of long-term mercury pollution on the soil microbial community. FEMS Microbiol. Ecol. 36 (2001) 11–19. DOI:10.1111/fem.2001.36.issue-1 |
| [3] | Li P., Feng X.B., Qiu G.L.. Methylmercury exposure and health effects from rice and fish consumption:a review. Int. J. Environ. Res. Public Health 7 (2010) 2666–2691. DOI:10.3390/ijerph7062666 |
| [4] | Cizdziel J.V., Gerstenberger S.. Determination of total mercury in human hair and animal fur by combustion atomic absorption spectrometry. Talanta 64 (2004) 918–921. DOI:10.1016/j.talanta.2004.04.013 |
| [5] | Hsu W.H., Jiang S.J., Sahayam A.C.. Determination of Cu, As, Hg and Pb in vegetable oils by electrothermal vaporization inductively coupled plasma mass spectrometry with palladium nanoparticles as modifier. Talanta 117 (2013) 268–272. DOI:10.1016/j.talanta.2013.09.013 |
| [6] | Jena B.K., Raj C.R.. Gold nanoelectrode ensembles for the simultaneous electrochemical detection of ultratrace arsenic, mercury, and copper. Anal. Chem. 80 (2008) 4836–4844. DOI:10.1021/ac071064w |
| [7] | Zhou Q.X., Xing A., Zhao K.F.. Simultaneous determination of nickel, cobalt and mercury ions in water samples by solid phase extraction using multiwalled carbon nanotubes as adsorbent after chelating with sodium diethyldithiocarbamate prior to high performance liquid chromatography. J. Chromatogr. A 1360 (2014) 76–81. DOI:10.1016/j.chroma.2014.07.084 |
| [8] | Dong Y.P., Zhou Y., Wang J., Dong Y.Q., Wang C.M.. Electrogenerated chemiluminescence of quantum dots with lucigenin as coreactant for sensitive detection of catechol. Talanta 146 (2016) 266–271. DOI:10.1016/j.talanta.2015.08.054 |
| [9] | Vasudevan D., Trinchi A., Hardin S.G., Cole I.S.. Fluorescent heavy metal cation sensing with water dispersible 2MPA capped CdSe/ZnS quantum dots. J. Lumin. 166 (2015) 88–92. DOI:10.1016/j.jlumin.2015.04.043 |
| [10] | Khataee A., Lotfi R., Hasanzadeh A., Iranifam M., Joo S.W.. A flow injection chemiluminescence method for determination of nalidixic acid based on KMnO4-morin sensitized with CdS quantum dots. Spectrochim. Acta A 154 (2016) 243–251. DOI:10.1016/j.saa.2015.10.039 |
| [11] | Chen Y.F., Rosenzweig Z.. Luminescent CdS quantum dots as selective ion probes. Anal. Chem. 74 (2002) 5132–5138. DOI:10.1021/ac0258251 |
| [12] | Koneswaran M., Narayanaswamy R.. L-Cysteine-capped ZnS quantum dots based fluorescence sensor for Cu2+ ion. Sens. Actuators B 139 (2009) 104–109. DOI:10.1016/j.snb.2008.09.028 |
| [13] | Ali E.M., Zheng Y.G., Yu H.H., Ying J.Y.. Ultrasensitive Pb2+ detection by glutathione-capped quantum dots. Anal. Chem. 79 (2007) 9452–9458. DOI:10.1021/ac071074x |
| [14] | Pei J.Y., Zhu H., Wang X.L., Zhang H.C., Yang X.R.. Synthesis of cysteamine-coated CdTe quantum dots and its application in mercury (Ⅱ) detection. Anal. Chim. Acta 757 (2012) 63–68. DOI:10.1016/j.aca.2012.10.037 |
| [15] | Wang J.Z., Zhou X.P., Ma H.B., Tao G.H.. Diethyldithiocarbamate functionalized CdSe/CdS quantum dots as a fluorescent probe for copper ion detection. Spectrochim. Acta A 81 (2011) 178–183. DOI:10.1016/j.saa.2011.05.098 |
| [16] | Zhao Q., Rong X.L., Ma H.B., Tao G.H.. Dithizone functionalized CdSe/CdS quantum dots as turn-on fluorescent probe for ultrasensitive detection of lead ion. J. Hazard. Mater. 250- 251 (2013) 45–52. |
| [17] | Chen L., Zhao Q., Zhang X.Y., Tao G.H.. Determination of silver ion based on the redshift of emission wavelength of quantum dots functionalized with rhodanine. Chin. Chem. Lett. 25 (2014) 261–264. DOI:10.1016/j.cclet.2013.10.029 |
| [18] | Z.H. Liu, L.Z. San, Handbook of Analytical Chemistry, 2nd ed., Chemical Industry Press, Beijing, 2000. |
| [19] | Deng Z.T., Cao L., Tang F.Q., Zou B.S.. A new route to zinc-blende CdSe nanocrystals:mechanism and synthesis. J. Phys. Chem. B 109 (2005) 16671–16675. DOI:10.1021/jp052484x |
| [20] | National Environmental Protection Agency, GB/T 17136-1997 Soil Quality-determination of Total Mercury-cold Atomic Absorption Spectrophotometry, NEPA, Beijing, 1997. |
| [21] | Chan W.C.W., Nie S.M.. Quantum dot bioconjugates for ultrasensitive nonisotopic detection. Science 281 (1998) 2016–2018. DOI:10.1126/science.281.5385.2016 |
| [22] | Zhang Y.H., Zhang H.S., Guo X.F., Wang H.. L-Cysteine-coated CdSe/CdS core-shell quantum dots as selective fluorescence probe for copper (Ⅱ) determination. Microchem. J. 89 (2008) 142–147. DOI:10.1016/j.microc.2008.01.008 |
| [23] | N.B.Brahim, N.B.H.Mohamed, M.Echabaane, al et. Thioglycerol-functionalizedCdSe quantum dots detecting cadmium ions. Sens. Actuators B 220 (2015) 1346–1353. DOI:10.1016/j.snb.2015.07.049 |
| [24] | J.R. Lakowicz, Quenching of fluorescence, in:J.R. Lakowicz (Ed.), Principles of Fluorescence Spectroscopy, 3rd ed., Springer, New York, USA, 2006, pp. 277-330. |
| [25] | Liu X.F., Xia Y.M., Fang Y.. Effect of metal ions on the interaction between bovine serum albumin and berberine chloride extracted from a traditional Chinese Herb coptis chinensis franch. J. Inorg. Biochem. 99 (2005) 1449–1457. DOI:10.1016/j.jinorgbio.2005.02.025 |
| [26] | Ghali M.. Static quenching of bovine serum albumin conjugated with small size CdS nanocrystalline quantum dots. J. Lumin. 130 (2010) 1254–1257. DOI:10.1016/j.jlumin.2010.02.034 |
| [27] | Kamat P.V.. Photochemistry on nonreactive and reactive (semiconductor) surfaces. Chem. Rev. 93 (1993) 267–300. DOI:10.1021/cr00017a013 |
| [28] | H.B. Jia, H. Kuang, Handbook of Organic Chemistry, Science Press, Beijing, 2006. |
| [29] | Wu P., Yan X.P.. Ni2+-modulated homocysteine-capped CdTe quantum dots as a turn-on photoluminescent sensor for detecting histidine in biological fluids. Biosens. Bioelectron. 26 (2010) 485–490. DOI:10.1016/j.bios.2010.07.068 |
| [30] | Liu I.S., Lo H.H., Chien C.T., et al. Enhancing photoluminescence quenching and photoelectric properties of CdSe quantum dots with hole accepting ligands. J. Mater. Chem. 18 (2008) 675–682. DOI:10.1039/b715253a |
| [31] | de Silva A.P., Nimal Gunaratne H.Q., Gunnlaugsson T., et al. Signaling recognition events with fluorescent sensors and switches. Chem. Rev. 97 (1997) 1515–1566. DOI:10.1021/cr960386p |
| [32] | Callan J.F., Mulrooney R.C., Kamila S., McCaughan B.. Anion sensing with luminescent quantum dots-a modular approach based on the photoinduced electron transfer (PET) mechanism. J. Fluoresc. 18 (2008) 527–532. DOI:10.1007/s10895-007-0295-9 |
| [33] | M.L. Li, Concise Handbook of Chemical Data, Chemical Industry Press, Beijing, 2003. |
| [34] | Ruedas-Rama M.J., Hall E.A.H.. Multiplexed energy transfer mechanisms in a dualfunction quantum dot for zinc and manganese. Analyst 134 (2009) 159–169. DOI:10.1039/B814879A |
| [35] | Satnami M.L., Vaishanav S.K., Nagwanshi R., Ghosh K.K.. Spectrofluorometric determination of mercury and lead by colloidal CdS nanomaterial. J. Dispers. Sci. Technol. 37 (2016) 196–204. DOI:10.1080/01932691.2015.1039020 |
| [36] | Duan J.L., Jiang X.C., Ni S.Q., Yang M., Zhan J.H.. Facile synthesis of N-acetyl-Lcysteine capped ZnS quantum dots as an eco-friendly fluorescence sensor for Hg2+. Talanta 85 (2011) 1738–1743. DOI:10.1016/j.talanta.2011.06.071 |