 2015, 26 (2): 203-210


2. 福建省气象科学研究所,福州 350001;
3. 广东省防雷中心,广州 510080
2. Fujian Provincial Meteorological Bureau, Fuzhou 350001;
3. Lightning Protection Center of Guangdong Province, Guangzhou 510080
闪电先导发展过程的模拟研究一直是雷电物理研究的重点问题,其突出的特点是不仅能够在模式建立的理论基础上,针对影响闪电发生发展的各个物理参量进行分析,与实际观测相互补充,对理论进行验证,而且能够进行实际应用,以研究先导与地面构筑间的相互作用,为雷电防护提供参考。
目前国内外均有较多的相关研究。最初的闪电先导始发模式主要用于判断长间隙放电实验中的击穿电压,有两个基于长间隙放电实验得到的经典模式:Carrara等[1]提出的临界半径概念和Rizk[2]提出的数学化始发判断模型。随后,Petrov等[3]、Akyuz等[4]在流光区域的长度和地面突起建筑对电场局部加强的基础上提出了电场强度的临界范围,用以判断先导是否可以持续发展。Eriksson[5]、Dellera等[6-7]、Rizk[8]也先后提出了3个不同的关于闪电先导发生发展的数值模拟模型,但由于在不同阶段进行了不同的简化假设,模式建立时在一定程度上缺乏先导放电最新的物理理解,模式中所使用的先导电荷分布、上行先导速度比的设定、上行先导相关参数等物理输入量各有不同,相应的模拟结果也有所不同。因此有必要建立一个闪电先导自持发展的模式。Becerra等[9-12]在流光转化为先导的基础上提出了一个自适应上行正先导发展模式。这个模型能够模拟上行正先导从初始形成到不断发展的过程,且计算过程中实现了多个物理参量的计算,克服了对假定输入条件的依赖性。模拟发现,上行正连接先导的发展不仅受下行梯级先导速度的影响,还受到预期回击电流、下行梯级先导水平位置及瞬态电场的影响。此外,国内也有较多的模拟模型。谢施君等[13]建立了先导起始并发展的一维仿真体系,并通过实验室条件下与自然雷电条件下的上行先导发展情况对模式进行了较好验证。任晓毓等[14-15]建立了闪电先导随机发展模型,模拟闪电先导通道发展路径及其分叉现象,对闪电先导与地物之间的相互作用进行探讨。
本文主要参考借鉴了Becerra等[9-12]的自持发展理论模型以及任晓毓等[14-15]的下行梯级先导随机发展模式,建立了闪电先导三维自持发展模型,模拟分析了下行梯级先导随机向下发展的情况下闪电上行先导在三维空间内的发生发展过程。
1 闪电先导三维自持发展模式的建立一般认为,当下行梯级先导不断向下发展接近地面目标并在其上激发出向上发展的连接先导时,雷击将发生。相应地,本文所建立的闪电先导三维自持发展模型如图 1所示,主要模拟研究了电晕起始放电、流光发展、上行正先导的始发、发展,直至下行梯级先导发生最后一跳与其连接的物理过程。

|
|
| 图 1. 闪电先导三维自持发展数值模拟模型 Fig 1. A 3D self-consistent propagation model of lightning leader | |
首先是近地面三维模拟空间内电场求解。此处数值模拟空间内各点电位值均满足泊松方程ΔΦ=f,假定三维模拟空间长x,宽y,高z,单位:m,各个方向上的单元步长分别为Δx,Δy,Δz,对模拟空间进行格点化,则可得出相应的单元网格及对应的格点矩阵。采用有限差分法进行计算 (图 2),可求得空间点 (i, j, k) 处的电势值Φ(i, j, k) 时的迭代公式为

|
(1) |

|
|
| 图 2. 空间离散化示意图 (a) 对模拟区域格点化,(b) 七点差分模型 Fig 2. The spatial discretization model (a) gridding of the simulation field, (b)7-point finite difference scheme | |
其中,迭代因子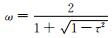
由于观测资料显示雷暴云下电场强度随高度增加而增加,因此假定模式中所选取范围内地面上方的电场随高度呈线性增加,其线性增加系数为α(单位:V/m2),下边界背景场值为E0(下边界处高度h=0),则距离下边界h处,初始场强为
|
(2) |
下行梯级先导、地面、建筑物、金属杆、风力发电机等地面构筑物均满足Dirichlet边界条件,空气边界则满足Neumann条件。该数值模拟中假定地面、地面建筑物以及地面尖端等充分接触形成的等势面电势值为0。
考虑到下行梯级先导和上行正先导的不断发展对空间电场的影响,该数值模拟过程中每当闪电先导发展一步,三维空间内的电场分布情况则根据闪电先导通道的实时发展位置重新计算,从而实现电场的动态变化,进而对上行先导、下行梯级先导下一步的空间发展长度及方向进行判断。
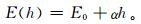
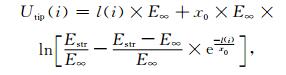
1.1 下行梯级先导的模拟雷暴云中产生的下行梯级负先导不断向下发展将导致近地面空间内电场分布不断变化,从而影响闪电上行连接先导的始发与发展过程。目前下行梯级先导的数值模拟工作主要有物理模式和随机模式两种。本文梯级先导的设计主要采用随机模式。假定下行梯级先导内电势恒定,速度取定值,为2×10⁵ m·s-1。当下行梯级先导发展到t时刻,对某一个已发展点而言,其头部周围空间内26个相邻格点与先导头部之间的电场强度分别为Em(m=1,2,3, …),则两者之间发生放电的概率Pm为
|
(3) |
式 (3) 中,|Em|-|Eth| < 0时,Pm=0,Eth为正负先导传播开始的电场值,此处取2.16×10⁵ V·m-1。然后根据概率大小随机选取下一步的发展点。
1.2 上行正先导的始发判断当模拟空间的背景电场不断变化时,对空间内可能始发上行正先导的点进行循环判断,当满足一定条件时,则认为形成了稳定的初始先导。其判断过程如图 3所示。

|
|
| 图 3. 上行先导始发判断数值模拟计算流程图 Fig 3. The numerical simulation flowchart of calculating the upward leader inception condition | |
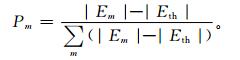
当给定模拟空间内初始电场分布情况或者下行梯级先导不断向下发展时,分析t=0时刻空间电场的分布情况Ul(0),并计算得到空间内格点电场强度E;若E>2.16×10⁵ V·m-1,则认为该点处可以产生第1个电晕放电,进而可利用模拟电荷法计算出一个电晕区内产生的电荷量ΔQ(0),若电荷量ΔQ (0)≥1μC,则将产生进一步的电晕区 (即second corona),即认为形成了不稳定先导,否则返回重新判断。若t=i时可形成不稳定先导,则假设已形成不稳定先导的先导通道为圆柱体等离子体,初始长度为l0,则可以得到此时先导头部电势[2]为
|
(4) |
式 (4) 中,l(i)为先导发展到第i步时的长度,E∞为先导通道稳态初始场强,取为3×10⁴ V·m-1;Estr为先导通道初始平均场强,取为4.5×10⁵ V·m-1;x0为常数系数,取为0.75。
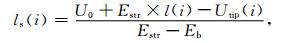
利用模拟电荷法可以计算得出此时电晕区长度ls(i),电荷量ΔQ(i)、先导增加的长度Δl(i);判断若l(i+1)≥lmax, 则形成稳定上行正先导,否则看l(i+1) 是否在减小,如果不是则继续循环计算Δl(i),否则中断,认为先导失败,未形成稳定上行正先导。其中,lmax值取2 m。
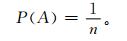
若满足始发的点有n个,则可通过以下古典概率模型计算各点的始发概率P(A) 为导致A可能出现的结果与等可能出现的结果的总数的比值,即
|
(5) |
根据以上古典模型随机选取k个始发点,进行下一步的发展判断。其中,k值可利用高斯函数 (取整函数) 进行求解k=[n/2+1]。
关于电晕区电荷量的算法,主要采用模拟电荷法 (CSM)[16]进行计算。如图 4所示,电晕放电前,电极头部附近区域电势分布为U1,正极性流光放电起始后,在电晕区电荷量作用下,模拟区域内电势分布发生畸变,为U2,考虑正极性迎面流注以及负极性下行先导前方流光的空间电位变化,流光区空间电荷总量可根据下式进行计算:

|
(6) |

|
|
| 图 4. CSM简单几何算法示意图 Fig 4. The geometry algorithm of CSM | |
其中,系数KQ为几何系数, 单位:C/(V·m),其反映了流注区域的几何形态、流光分支数目和长度对流光区域空间电荷总量的贡献,本文取KQ=3.5×10-11 C/(V·m)。
1.3 上行正先导的发展过程及各物理量的计算对于上行正先导发展过程的数值模拟,主要是在先导始发判断模式的基础上扩展得到的。若通过1.2节判断上行稳定正先导初始形成,则开始上行正先导发展过程的模拟计算。首先假定稳定先导形 成后的初始条件,给定上行正先导初始时即t=0时的先导长度l0以及电晕区电场强度,计算t=i(i=1,2,3, …) 时,先导头部电势以及电晕区长度,并计算电晕区电荷量,结合电晕区电荷量、电流强度、先导速度及线电荷密度间的关系 (式 (7)~式 (11))[9-12],可计算出上行先导发展过程中该步长的空间发展位置、先导速度、先导电流、线电荷密度等物理特征量。其中,Eb为先导电晕放电前空间电场强度。对满足条件的所有点,采用随机概率方法式 (3) 进行下一点方向的选取,并在相应的方向上前进Δl的距离。电晕区伸展长度
|
(7) |
先导电流

|
(8) |
先导速度

|
(9) |
先导前进长度

|
(10) |
线电荷密度

|
(11) |
当闪电上行正先导不断发展并向下行负梯级先导不断靠近时,认为当先导之间满足一定条件时,将发生最后一跳。此处判断其是否发生最后一跳的主要依据是先导之间的电场强度值达到500 kV·m-1,即击穿场强时,先导将发生连接。
2 初步模拟结果分析及验证 2.1 上行先导发展速度特征尽管自然条件下上行正先导的观测有限,尤其是始于地面的上行连接先导,更难被观测到,但高建筑物或者构筑物上始发的上行正连接先导则可以通过一定的光学观测系统进行观测分析,如Lu等[17-19]在广州针对高建筑物顶部的雷电连接过程开展了综合观测,获得了多个个例,分析得到了连接过程中下行先导和上行先导的发展特征。
本文以广州国际金融中心为模拟对象,假定模拟空间高度为1000 m,地面建筑物高440 m,边长为70 m,取下行负梯级先导始发位置水平偏离建筑物距离分别为0, 141, 283 m时,背景电场强度变化梯度α分别为1000 V/m2, 800 V/m2时的6种情况分别进行了模拟,得到如下所示的个例1~个例6共6个理想建筑物遭雷击个例 (图 5)。其中,蓝色线条和红色端点为先导发展过程中形成的通道,黄色线条为连接先导。

|
|
| 图 5. 高建筑上方闪击事件模拟个例 (H为模型中建筑物理想高度,R为上行先导初始位置相对于建筑物中心的水平偏移距离,α为背景电场强度线性增加系数) Fig 5. Simulation cases of lightning flashes striking on tall structures (H is the height of the structure, R is the horizontal distance between the upward leader and the center of the roof, α is the linear increation coefficient of the electric field intensity) | |
得到图 6中闪电上行正先导发展速度随时间的变化规律,假定模拟结果中的0时刻参考点为上行先导始发的前一时刻,两者间隔一个时间步长Δt。可以看出,随着上行正先导的不断发展,其速度随时间不断增大,且初期增长较缓慢,在0~600 μs之间,上行正先导速度由104 m·s-1量级增加至105 m·s-1量级,在最后200 μs内,先导速度明显增加,达到106 m·s-1量级,平均值达到5×10⁵ m·s-1。McEachron[20]、Berger[21]、Kito等[22]和Wada等[23]利用高塔、高速摄像等方法均得出上行正先导速度变化范围约为104~106 m·s-1,并给出随着上行先导的不断发展,其自身速度不断增加的结论。张义军等[24]通过分析2006—2011年广州野外试验基地人工引雷数据,提出人工触发闪电的上行正先导的发展速度为104~105 m·s-1量级。李俊等[25-26]及张义军等[27]认为上行先导初始阶段的二维平均速度为104 m·s-1量级,后增加到105 m·s-1量级。Lu等[18]通过对广州高建筑雷电观测试验中获得的个例的分析,发现在下行先导影响下,上行连接先导发展过程中的二维速度平均值为105 m·s-1量级,随时间逐渐加快,特别是回击前160 μs内由3.6×10⁵ m·s-1迅速增至1.71×10⁶ m·s-1。比较可知,模拟得到的上行先导速度在量级上和随时间变化的趋势上,与已有研究均有较好的一致性。

|
|
| 图 6. 先导速度随时间变化图 Fig 6. Variations of the upward leader speed under different conditions | |
2.2 上行正先导电流强度、平均线电荷密度及发展总长度
关于自然闪电先导通道内的线电荷密度、先导通道电流强度的研究,很难实现直接对其测量。相关研究表明,闪电先导通道内的电流强度与通道亮度呈正相关,闪电通道电流的增大或减小必然会引起亮度相应的增强或减弱。因此,可以利用模式中计算得到的电流在一定程度上表征上行正先导发展过程中的亮度变化。
由图 7可知,上行正先导在发展过程中,其电流强度处于不断变化的状态。发展初期 (t < 600 μs),上行正先导电流强度呈稳定增长趋势,由0.01 A左右增至10 A量级,随后,电流强度增强幅度较大,同时波动也较大。Lu等[19]通过高速摄像数据分析得出,上行先导在发展过程中其头部亮度整体上呈增强的趋势,且在回击前200 μs内亮度提升明显。可以看出先导电流强度随时间呈逐渐增强趋势,且与其头部亮度随时间的变化具有一定的相关性,与已有研究较为一致。

|
|
| 图 7. 电流强度变化 Fig 7. Variations of currents of the upward leader under different conditions | |
对以上6次个例中上行正先导相应产生的线电荷密度、发展长度进行统计分析 (表 1),模拟试验中得到个例1~个例6中建筑物上方激发产生的上行先导通道内的平均线电荷密度为50.0~108.0 μC·m-1,平均值约为64.3 μC·m-1,平均发展长度约为417 m。
|
|
表 1 不同情况下模拟得到的先导长度和线电荷密度 Table 1 Lengths and charge per-unit length of the upward leader under different conditions |
闪电先导线电荷密度qL主要受空间背景电场分布等物理参量的影响。长间隙放电实验中计算得到的典型值为20~50 μC·m-1,Lalande[28]则根据人工引雷实验计算得到线电荷密度值约为65 μC·m-1。郑栋等[29]提出了一个计算上行正先导中线电荷密度与电流的新方法,并利用高速摄像仪的光学观测资料及已有的相关计算结果进行比较验证,得出先导头部线电荷密度5~378.7 μC·m-1,发展过程中线电荷密度随上行先导发展高度增加增大,且二者之间的拟合优度约为0.78。比较可知,该数值模拟得到的结果具有一定合理性。
3 小结由于该闪电先导三维自持模拟模型建立在闪电先导初始放电、发展机制的理论基础上,因此,可以利用该模式对闪电下行先导以及连接过程进行自持模拟,并根据模拟结果分析雷电物理过程的规律。通过模拟结果与实际光学观测试验数据以及已有研究结果的对比分析,得出以下初步结论:
1) 上行正先导在始发及发展过程中,其速度呈逐渐增加趋势,且随着最后一跳的发生,上行正先导的速度增加明显,整个过程中变化范围为104~106 m·s-1量级。
2) 上行正先导通道内电流强度随时间也具有逐渐增加趋势,该变化趋势与光学观测得到的先导头部亮度的变化趋势一致。
3) 建筑物上方激发产生的上行先导通道内的平均线电荷密度为50~108 μC·m-1,平均值约为64.3 μC·m-1,发展长度约为417 m。
闪电先导三维自持模拟模型的建立及模拟应用,能够为进一步研究雷击地面构筑物特征提供参考。
| [1] | Carrara G, Thione L. Switching surge strength of large air gaps:A physical approach. IEEE Transactions on Power Apparatus and Systems, 1976, 95, (2): 512–524. DOI:10.1109/T-PAS.1976.32131 |
| [2] | Rizk F. A model for switching impulse leader inception and breakdown of long air-gaps. IEEE Transactions on Power Delivery, 1989, 4, (1): 596–603. DOI:10.1109/61.19251 |
| [3] | Petrov N I, Waters R T. Determination of the striking distance of lightning to earthed structures. Proceedings of the Royal Society A:Mathematical, Physical and Engineering Sciences, 1995, 450, (1940): 589–601. DOI:10.1098/rspa.1995.0102 |
| [4] | Akyuz M, Cooray V. The Franklin lightning conductor:conditions necessary for the initiation of a connecting leader. Journal of Electrostatics, 2001, 51-52: 319–325. DOI:10.1016/S0304-3886(01)00113-9 |
| [5] | Eriksson A J.The Lightning Ground Flash-An Engineering Study.Faculty of Engineering, University of Natal, Pretoria, 1979. |
| [6] | Dellera L, Garbagnati E. Lightning strike simulation by means of the Leader Progression Model, Part I:Description of the model and evaluation of free-standing structures. IEEE Transactions on Power Delivery, 1990, PWRD-5: 2009–2023. |
| [7] | Dellera L, Garbagnati E. Lightning strike simulation by means of the Leader Progression Model:Ⅱ.Exposure and shielding failure evaluation of overhead lines with assessment of application graphs. IEEE Transactions on Power Delivery, 1990, PWRD-5: 2023–2029. |
| [8] | Rizk F. Modeling of transmission lines:Exposure to direct lightning strokes. IEEE Transactions on Power Delivery, 1990, PWRD-5: 1983–1989. |
| [9] | Becerra M, Cooray V. Dynamic Modeling of the Lightning Upward Connecting Leader Inception. 28th ICLP, 2006: 543–548. |
| [10] | Becerra M, Cooray V. A simplified physical model to determine the lightning upward connecting leader inception. IEEE Transactions on Power Delivery, 2006, 21, (2): 897–908. DOI:10.1109/TPWRD.2005.859290 |
| [11] | Becerra M, Cooray V. On the interaction of lightning upward connecting positive leaders with humans. IEEE Transactions on Electromagnetic Compatibility, 2009, 51, (4): 1001–1008. DOI:10.1109/TEMC.2009.2033265 |
| [12] | Becerra M, Cooray V. A self-consistent upward leader propagation model. Journal of Physics D:Applied Physics, 2006, 39: 3708–3715. DOI:10.1088/0022-3727/39/16/028 |
| [13] | 谢施君, 何俊佳, 陈维江, 等. 避雷针迎面先导发展物理过程仿真研究. 中国电机工程学报, 2012, 32, (10): 32–40. |
| [14] | 任晓毓, 张义军, 吕伟涛, 等. 闪电先导随机模式的建立与应用. 应用气象学报, 2011, 22, (2): 194–202. DOI:10.11898/1001-7313.20110208 |
| [15] | 任晓毓, 张义军, 吕伟涛, 等. 雷击建筑物的先导连接过程模拟. 应用气象学报, 2010, 21, (4): 450–457. DOI:10.11898/1001-7313.20100408 |
| [16] | Singer H, Steinbigler H, Weiss P. A charge simulation method for the calculation of high voltage fields. IEEE Transactions on Power Apparatus and Systems, 1974, PAS-93: 1660–1668. DOI:10.1109/TPAS.1974.293898 |
| [17] | Lu W, Chen L, Ma Y, et al. Lightning attachment process involving connection of the downward negative leader to the lateral surface of the upward connecting leader. Geophys Res Lett, 2013, 40: 1–5. DOI:10.1029/2012GL054022 |
| [18] | Lu W, Zhang Y, Chen L, et al. Attachment Processes of Two Natural Downward Lightning Flashes Striking on High Structures. 30th International Conference on Lightning Protection, 2010. |
| [19] | Lu W, Chen L, Zhang Y, et al. Characteristics of unconnected upward leaders initiated from tall structures observed in Guangzhou. J Geophys Res, 2012, 117, (D19). DOI:10.1029/2012JD018035 |
| [20] | McEachron K B. Lightning to the Empire State building. Journal of The Franklin Institution, 1939, 227: 149–217. DOI:10.1016/S0016-0032(39)90397-2 |
| [21] | Berger K. Novel observations of lightning discharges:Results of research on Mount San Salvatore. Journal of The Franklin Institution, 1967, 283: 478–525. DOI:10.1016/0016-0032(67)90598-4 |
| [22] | Kito Y, Horii K, Higashiyama Y, et al. Optical aspects of winter lightning discharges triggered by the rocket-wire technique in Hukuriku district of Japan. J Geophys Res, 1985, 90: 6147–6157. DOI:10.1029/JD090iD04p06147 |
| [23] | Wada A, Asakawa A, Shindo T, et al.Leader and Return Stroke Speed of Upward-initiated Lightning.Proceedings of International Conference on Atmospheric Electricity (ICAE), 2003, C3-20. |
| [24] | 张义军, 杨少杰, 吕伟涛, 等. 2006—2011年广州人工触发闪电观测试验和应用. 应用气象学报, 2012, 23, (5): 513–522. DOI:10.11898/1001-7313.20120501 |
| [25] | 李俊, 张义军, 吕伟涛, 等. 一次多回击自然闪电的高速摄像观测. 应用气象学报, 2008, 19, (4): 401–411. DOI:10.11898/1001-7313.20080403 |
| [26] | 李俊, 吕伟涛, 张义军, 等. 一次多分叉多接地的空中触发闪电过程. 应用气象学报, 2010, 21, (1): 95–100. DOI:10.11898/1001-7313.20100113 |
| [27] | 张义军, 周秀骥. 雷电研究的回顾和进展. 应用气象学报, 2006, 17, (6): 829–834. DOI:10.11898/1001-7313.20060619 |
| [28] | Lalande P.Study of the Lightning Stroke Conditions on a Grounded Structure.Paris:University of Paris, 1996. |
| [29] | 郑栋, 张义军, 吕伟涛, 等. 先导-回击模型与人工触发闪电特征参数计算. 中国电机工程学报, 2006, 26, (23): 151–157. DOI:10.3321/j.issn:0258-8013.2006.23.027 |