 2009, 20 (2): 252-256


2. 深圳市气象局, 深圳 518040
2. Shenzhen Meteorological Administration, Shenzhen 518040
20世纪70年代以来, 我国经济快速发展的同时主要城市能见度水平呈现不断恶化的趋势。珠三角城市群也经历着同样的情形[1], 近年来更是频繁发生霾天气。在排除了因降水等导致能见度下降的情况, 定义日均能见度低于10 km且相对湿度小于80%为一个霾日[2-3]。按此标准, 2007年深圳市共发生霾日231 d, 霾问题已十分严重。
造成大气能见度下降的首要原因是颗粒物的散射和吸收, 可贡献城市大气总消光系数的80%~90% [4-7]。研究证实, 细粒子PM2.5是PM10中主要的消光粒径段[4-6, 8]。另外, 相对湿度对水溶性颗粒物消光的影响十分显著[4, 9-10]。霾是大气能见度极端恶化的情况, 它会危害人体健康、降低城市景观审美, 甚至造成交通事故[11]。通过量化大气能见度与颗粒物浓度的关系可以深入理解霾现象的发生。然而, 目前国内的研究主要集中在分析气象因子以及气溶胶光学厚度与大气能见度的关系, 对城市大气颗粒物 (尤其是PM2.5) 与能见度之间的定量关系研究很少。仅有的相关研究并未建立起纳入相对湿度影响的统计模型[2]。
本研究利用能见度和细粒子浓度等相关数据, 在分析深圳市大气消光特点的基础上筛选最优模型来描述消光系数与其影响因素的关系, 以便进一步了解深圳霾天气发生的特点。
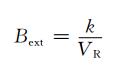
1 数据和资料 1.1 数据描述收集的数据资料包括大气能见度、相对湿度、PM2.5质量浓度。能见度和相对湿度数据来自深圳市的国家基本气象站, 代表市区的平均状况。其中, 能见度采用《地面气象观测规范》中规定的目测方法得到的小时观测数据, 利用下式将其VR转换为消光系数Bext :
|
(1) |
式(1)中, k是Kochmeider常数, 一般取3.91[13]。
细粒子浓度则由架设于深圳大学城校园内的TEOM (Tapered Element Oscillating Microbalance, 即锥形元件振荡微量天平) 在线监测仪 (1400a系列,美国Rupprecht & Patashnick公司) 进行连续监测得到的小时均值。数据处理时, 由于高湿环境下TEOM测量结果可能存在偏差[14], 因此相应的PM2.5监测数据做如下考虑:在负值 (或零值) 前有大值出现的情况, 将负值 (或零值) 以及之前的大值作为异常值剔除; 对于相对湿度很高 (不小于90%) 而相应PM2.5数据波动不大的情况, 为保持完整性, 数据仍保留。
各项数据经过异常值剔除后再匹配, 最终获得8024组时间分辨率为1 h的有效数据, 数据有效率为91.6%。
1.2 深圳市细粒子污染与大气能见度状况2007年深圳市细粒子污染比较严重, 年均浓度达到53.4±37.3 μg · m-3, 是美国环保局推荐标准的3倍多, 但好于我国其他主要城市[15-18];全年日均细粒子浓度最高可达155.7 μg · m-3。相应地, 该年能见度水平较差, 年均能见度仅为13.4±9.3km。能见度与细粒子污染水平的季节变化趋势吻合。另外, 深圳市的相对湿度水平较高, 年均达70%。
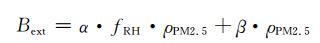
2 能见度与PM2.5的相关模型 2.1 模型的形式由于没有考虑相对湿度的影响, 利用一元线性回归拟合PM2.5质量浓度与消光系数的关系效果不好(R2=0.23)。TEOM监测仪在测量前会对进气加热 (至50℃) 以去除水分, 因此其测量结果不能代表环境大气中细粒子的吸湿状况。而实际上, 深圳市年均相对湿度高达70%, 且吸湿性组分可占到细粒子总质量的40% [15], 必须考虑相对湿度的影响。水汽间接影响颗粒物的消光作用, 因此将HR (以相对湿度影响修正因子fRH来表示) 与PM2.5中水溶性组分以某种形式结合并纳入模型中, 得出如下基本形式:
|
(2) |
式(2)中, α, β分别代表水溶性组分与非水溶性组分对消光所占的权重。常见的fRH有以下几种形式:
形式2:根据粒子吸湿性增长半径与
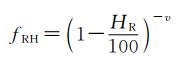
形式3 :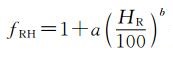
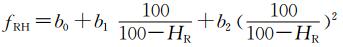
上述4种fRH形式都被广泛应用到不同地区研究中, 并得到适合于当地的参数值, 但缺乏普适性。文章尝试将文献中常见的fRH形式应用到深圳市, 采用回归分析技术筛选出最适于深圳市的fRH形式同时确定相应的参数值, 最终得到消光系数与颗粒物质量浓度相关关系的定量描述。
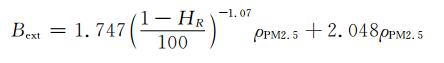
2.2 回归分析筛选fRH以及参数的确定运用SPSS (Statistical Package for the Social Sciences, 即社会科学统计软件包) 对式(2)中消光系数和消光影响因素进行回归分析。分析时采用两种方式:一是给定各fRH形式中的参数值后进行多元线性回归 (MLR), 参数值取文献常见值, 回归时自变量强制进入; 二是各fRH形式中的参数待定, 采用Levenberg-Marquardt算法进行非线性回归分析 (NRL) 同时确定参数值和回归系数。每种fRH形式都采用上述两种方式, 最终获得10组结果 (见表 1)。除形式1外, 其他3种形式的模型拟合效果相当。形式2因形式简洁而最终被选用, 得到最适于深圳情况的模型形式:
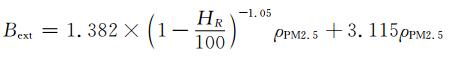
|
(3) |
|
|
表 1 不同fRH形式的模型拟合结果 Table 1 Regression models with different fRH forms |
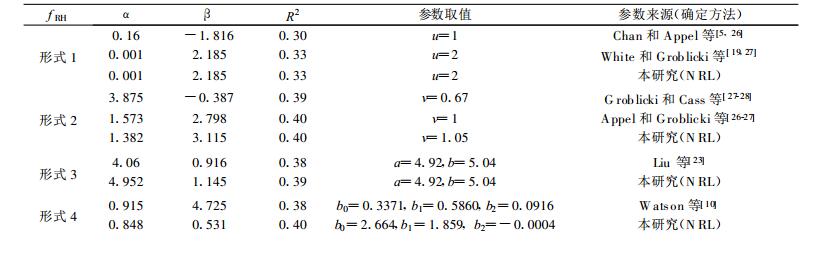
图 1反映了式(3)的拟合效果。可见将相对湿度纳入模型后消光系数与细粒子浓度之间的相关关系得到大幅度提升。

|
|
| 图 1. 能见度模型拟合效果(1 h平均) Fig 1. Relationship between measured and reconstructed vsibility for 1-hour average data | |
考虑到数据经更长时段平均后可降低波动性, 将各项数据经24 h平均后用于式(3)的拟合, 得到如下模型表达式:
|
(4) |
R2达到0.73(n=350), 拟合效果有明显改善(图 2)。拟合直线的斜率接近于1, 说明式(4)在机理上较好地反映了能见度与细粒子之间的关系。图 2中的虚线用来描述模型拟合的偏差范围, 上下边界表达式分别为 (单位: km):
上界: y=1.97x (即正相对误差为85%),
下界: y=0.64x (即负相对误差为39%)。

|
|
| 图 2. 能见度拟合模型(24 h平均) Fig 2. Relationship between measured and reconstructed vsibility for 24-hour average data | |
虚线包含的区域覆盖了95%的数据, 拟合的偏差较小, 说明本模型的拟合能力较强。
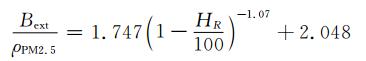
3 相对湿度对消光效率的影响分析表明, 经相对湿度影响修正后模型的拟合优度得到了极大提升, 说明在深圳市相对湿度对颗粒物消光影响显著。进一步了解相对湿度对单位质量PM2.5消光能力 (即消光效率) 的影响有助于完善统计相关模型形式。由式 (3) 可得消光效率与相对湿度的关系式:
|
(5) |
据此作消光效率随相对湿度变化的曲线 (图 3)。在低湿和中等湿度下, 消光效率随着HR增高而缓慢增长。HR从较为干燥状态增至80%, 相应的消光效率从5 m2/g增长到10 m2/g, 增加了2倍。当HR >85%时, 消光效率急剧增长, 且HR越高增长越快。本研究得到的消光效率随相对湿度的增长模式与前人的研究结果类似[10, 28], 较好地反映了深圳市相对湿度对消光效率的影响。

|
|
| 图 3. 消光效率随相对湿度增长曲线 Fig 3. The curve of extinction efficiency depending on relative humidity | |
4 结语
利用深圳市2007年全年逐时观测数据, 对比几种常见反映相对湿度对颗粒物吸湿增长的曲线形式, 最终筛选出深圳市大气消光系数与细粒子质量浓度以及相对湿度之间最优的多元回归模型 (R2=0.40, n=8024)。24 h平均后的数据用于模型, 拟合效果得到了极大改善 (R2=0.73, n=350), 且拟合偏差较小, 说明该模型较好地反映了深圳市大气能见度与细粒子浓度之间的相关情况。
另外, 通过探讨消光效率随相对湿度增长方式发现, 当在中等湿度及以下水平时, 消光效率增长缓慢; 当相对湿度超过85%时, 消光效率随相对湿度的增高而急剧增长。这种增长方式较好地反映了相对湿度对消光效率的影响。
| [1] | 黄健, 吴兑, 黄敏辉, 等. 1954—2004年珠江三角洲大气能见度变化趋势. 应用气象学报, 2008, 19, (1): 61–70. |
| [2] | 吴兑. 霾与雾的区别和灰霾天气预警建议. 广东气象, 2004, (4): 1–4. |
| [3] | 吴兑, 廖国莲, 邓雪娇, 等. 珠江三角洲霾天气的近地层输送条件研究. 应用气象学报, 2008, 19, (1): 1–9. |
| [4] | Baik N J, Kim Y P, Moon K C, Visibility study in Seoul, 1993. Atmos Environ, 1996, 30, (13): 2319–2328. DOI:10.1016/1352-2310(95)00443-2 |
| [5] | Chan Y C, Simpson R W, Mctainsh G H, et al. Source apportionment of visibility degradation problems in Brisbane (Australia) using the multiple linear regression techniques. Atmos Environ, 1999, 33, (19): 3237–3250. DOI:10.1016/S1352-2310(99)00091-6 |
| [6] | 宋宇, 唐孝炎, 方晨, 等. 北京市能见度下降与颗粒物污染的关系. 环境科学学报, 2003, 23, (4): 468–471. |
| [7] | 刘新民, 邵敏. 北京市夏季大气消光系数的来源分析. 环境科学学报, 2004, 24, (2): 185–189. |
| [8] | 束炯, 李丽, 张玮. 大气污染对城市能见度影响研究的理论与实践. 上海环境科学, 2003, 22, (11): 785–847. |
| [9] | Kao A S, Friedlander S K, Frequency distributions of PM10 chemical components and their sources. Environ Sci Technol, 1995, 29: 19–28. DOI:10.1021/es00001a003 |
| [10] | Watson J G, Visibility: Science and regulation. J Air Waste Manage, 2002, 52, (6): 628–713. DOI:10.1080/10473289.2002.10470813 |
| [11] | 罗慧, 李良序, 胡胜, 等. 公路交通事故与气象条件关系及其气象预警模型. 应用气象学报, 2007, 18, (3): 350–35. |
| [12] | 徐鹏炜, 谭湘萍, 蔡菊珍, 等. 杭州城市大气消光系数和能见度的影响因子研究. 环境污染与防治, 2005, 27, (6): 410–413. |
| [13] | Cohen A, Horizontal visibility and the measurement of atmospheric optical depth of lidar. Appl Optics, 1975, 14, (12): 2878–2882. DOI:10.1364/AO.14.002878 |
| [14] | 孙鸿良, 何曦. RP1400(a) 测尘仪出现负值的原因分析. 环境污染与防治, 2001, 23, (2): 92–93. |
| [15] | 牛文, 何凌燕, 胡敏, 等. 深圳冬、夏季大气细粒子及其二次组分的污染特征. 中国科学(B辑), 2006, 36, (02): 173–180. |
| [16] | He K, Yang F M, Ma Y L, Characteris tics of PM2.5 in Beijing, China. Atmos Environ, 2001, 35: 4959–4970. DOI:10.1016/S1352-2310(01)00301-6 |
| [17] | Ye B M, Ji X L, Yang H Z, Concentration and chemical composition of PM2.5 in Shanghai in one-year period. Atmos Environ, 2003, 37: 4223–4234. |
| [18] | 魏复盛, 滕恩江, 吴国平. 我国4个大城市空气PM2.5, PM10污染及其化学组成. 中国环境监测, 2001, 17, (7): 1–6. |
| [19] | White W H, Roberts P T, On the nature and origins of visibility-reducing aerosols in the los angeles air basin. Atmos Environ, 1977, 11, (9): 803–812. DOI:10.1016/0004-6981(77)90042-7 |
| [20] | Kotchenruther R A, Hobbs P V, Hegg D A, Humidification factors for atmospheric aerosol off the mid-Atlantic coast of United States. J Geophy Res, 1999, 104, (D2): 2239–2251. DOI:10.1029/98JD01751 |
| [21] | Neiburger M, Wurtele M G, On the nature and size of particles in haze, fog and stratus of the Los Angeles region. Chem Rev, 1949, 44: 321–335. DOI:10.1021/cr60138a005 |
| [22] | Kotchenruther R A, Hobbs P V, Humidification factors of aerosols from biomass burning in Brazil. J Geophy Res, 1998, 103, (D24): 32081–32089. DOI:10.1029/98JD00340 |
| [23] | Liu X, Cheng Y, Zhang Y, et al. Influences of relative humidity and particle chemical composition on aerosol scattering properties during the 2006 PRD campaign. Atmos Environ, 2008, 42: 1525–1536. DOI:10.1016/j.atmosenv.2007.10.077 |
| [24] | Sisler J F, Huffman D, Latimer D A. IMPROVE Reports (1993): Spatial and Temporal Patterns and the Chemical Composition of the Haze in the United States: An Analysis of Data from the IMPROVE Network. 1988-1991[EB/OL], 1993. [http://vista.cira.colostate.edu/improve/Publications/Reports/1993/1993.htm.] |
| [25] | Malm W C, Day D E, Estimates of aerosol species scattering characteristics as a function of relative humidity. Atmos Environ, 2001, 35: 2845–2860. DOI:10.1016/S1352-2310(01)00077-2 |
| [26] | Appel B R, Tokiwa Y, Hsu J, et al. Visibility as related to atmospheric aerosol constituents. Atmos Environ, 1985, 19, (9): 1525–1534. DOI:10.1016/0004-6981(85)90290-2 |
| [27] | Groblicki P J, Wolff G T, Countess R J, Visibility-reducing species in the Denver "Brown Cloud"-I. Relationships between extinction and chemical composition. Atmos Environ, 1981, 15, (12): 2473–2484. |
| [28] | Cass G R, On the relationship between sulfate in air quality and visibility with examples in Los Angeles. Atmos Environ, 1979, 13, (8): 1069–1084. DOI:10.1016/0004-6981(79)90031-3 |