 2020, Vol. 36


2. 岩石圈演化国家重点实验室, 中国科学院地质与地球物理研究所, 北京 100029
2. State Key Laboratatory of Lithoshperic Eovlution, Institute of Geology and Geophysics, Chinese Academy of Sciences, Beijing 100029, China
基于变质岩石内特定矿物组合估算变质温度和P-T-t轨迹是揭示造山带热演化过程的重要途径(Spear, 1995;魏春景等,2001;Wu et al., 2002;Liu et al., 2004;刘福来等,2006;吴春明等,2007;Wei et al., 2009),然而,在很多变质带中常缺乏可用于估算变质温度的合适矿物组合,碳质物拉曼光谱温度计可作为一个新的方法给予补充(Beyssac et al., 2002a;Rahl et al., 2005;Aoya et al., 2010)。碳质物广泛存在于变质沉积岩中,在成岩和变质过程中逐渐转变为石墨,即石墨化(Buseck and Beyssac, 2014),在石墨化过程中,碳质物的结晶度逐渐提高,是岩石变质程度(尤其是温度)的可靠指标。
对于碳质物结晶度与温度关系研究,早期的学者通过X射线衍射(XRD)技术进行观测(Itaya, 1981;Yui et al., 1996;Beyssac et al., 2002a;Rahl et al., 2005;Aoya et al., 2010;Lahfid et al., 2010;Kouketsu et al., 2014),随后通过镜质体反射率(French, 1964;Landis, 1971;Kisch, 1980;Itaya, 1981;Tagiri, 1981;Mori and Taguchi, 1988;George et al., 2001)以及利用高分辨率透射电子显微镜(Buseck and Huang, 1985;Jehlicka and Rouzaud, 1990;Beyssac et al., 2002b;Nakamura and Akai, 2013),这些研究结果表明碳质物结晶度与变质温度之间具有正相关性。近年来,高空间分辨率激光拉曼光谱定量分析技术已成为表征碳质物结晶度的有效工具(Beyssac et al., 2002a)。Beyssac et al.(2002a)利用该技术测量变质岩中碳质物的结晶度,并提出碳质物拉曼光谱温度计,由于方法简单实用,引起广泛关注(d’Alessio et al., 2003;Sato et al., 2006;Yamada et al., 2007;Robert et al., 2010;Tagami, 2012;Cooper et al., 2013;Yoshida et al., 2016;Laurent et al., 2018)。随后有研究者基于实验和天然样品的分析,对该温度计进行了修订和扩展,提出了不同版本的变质温度计算公式,拓宽了该方法的使用范围(Rahl et al., 2005;Aoya et al., 2010;Lahfid et al., 2010;Kouketsu et al., 2014)。作为新型温度计,其影响因素也被关注,在低温变质环境(温度<300℃),碳质物的结构不仅受温度影响,还受变质压力、变质持续时间、变形、催化物质和碳质物前体类型的影响(Landis, 1971;Diessel et al., 1978;Bonijoly et al., 1982;Wopenka and Pasteris, 1993;Wada et al., 1994;Bustin et al., 1995;Suchy et al., 1997;Buseck and Beyssac, 2014)。由于很难从天然岩石样品中评估每一种因素的影响(Lahfid et al., 2010),因此目前尚未建立统一的碳质物拉曼光谱温度计计算公式。尽管如此,激光拉曼光谱可以原位、准确、高效的获取碳质物结晶度相关参数进而估算变质峰期温度,解决了传统方法繁琐、费时等问题,大大提高了工作效率(Beyssac et al., 2002a)。相比基于特定矿物组合和矿物组成的温度计(魏春景等,2001;Wu et al., 2002;吴春明等,2007;Wei et al., 2009),拉曼光谱温度计在以下几方面极具优势:(1)碳质物广泛存在于变质沉积岩中,岩片及岩石薄片均可用于拉曼光谱分析(Beyssac et al., 2002a;Rahl et al., 2005;Aoya et al., 2010);(2)激光拉曼光谱可对岩石薄片中的碳质物进行原位无损的探测分析,可同时观测到碳质物与周围矿物间的结构、构造与组合关系,便于将构造与变质温度与事件相关联(Kouketsu et al., 2014);(3)激光拉曼光谱分析准确度高(分辨率为~1μm)、效率高(单点光谱获取时间~10s),因此激光拉曼可在短时间内获取大量、乃至海量光谱测量数据,以消除测量样品的异质性(Aoya et al., 2010);(4)变质过程中碳质物石墨化具有不可逆性,碳质物结构记录峰期变质,不会遭受后期退变质改造(Buseck and Beyssac, 2014),因此碳质物拉曼光谱变质温度计估算的温度为峰期变质温度(Beyssac et al., 2002a;Rahl et al., 2005;Aoya et al., 2010)。
1 碳质物拉曼光谱温度计原理与方法变质沉积岩中碳质物随变质温度增加而逐渐石墨化是碳质物拉曼温度计的理论基础(Beyssac et al., 2002a, 2004;Rantitsch et al., 2004)。沉积岩通常含有痕量的有序度低、结晶程度低的碳质物,但随变质程度的增加,碳质物逐渐转变为有序度高的结晶石墨(Grew, 1974;Pasteris and Wopenka, 1991;Wopenka and Pasteris, 1993;Yui et al., 1996)。通过激光拉曼光谱获取碳质物结晶程度相关量化参数,再根据结晶度与温度间的相关公式(Beyssac et al., 2002a;Rahl et al., 2005;Aoya et al., 2010;Lahfid et al., 2010;Kouketsu et al., 2014),可估算变质岩石变质温度(Beyssac et al., 2002a;Rahl et al., 2005),值得注意的是,由于石墨化过程的不可逆性(碳质物倾向于热力学稳定相(石墨)),即碳质物结构对退变质不敏感,因此利用该方法计算出的温度可以被解释为样品整个变质过程中达到的变质峰期温度(Landis, 1971;Pasteris and Wopenka, 1991;Wopenka and Pasteris, 1993;Wada et al., 1994;Beyssac et al., 2002a, b, 2004, 2007;Rahl et al., 2005;Negro et al., 2006;Angiboust et al., 2009;Gabalda et al., 2009;Lahfid et al., 2010)。
1.1 碳质物拉曼温度计原理拉曼光谱是一种散射光谱,当激光发出的入射光子与作为散射中心的样品分子相互作用时会产生弹性碰撞与非弹性碰撞,在非弹性碰撞过程中,入射光子与分子之间存在能量交换,导致入射光子方向与频率发生改变,这种散射称之为拉曼散射。拉曼散射依据样品分子原始能级状态又可进一步分为斯托克斯散射与反斯托克斯散射(图 1)。根据玻尔兹曼定律,在室温下,分子绝大多数处于振动能级基态,所以拉曼光谱记录的一般都是斯托克斯散射过程(Reed and Simon, 1979;贺福,2005;张延会等,2006)。

|
图 1 拉曼散射示意图 Fig. 1 Sketch diagram of Raman scattering |
在拉曼光谱中横坐标拉曼位移是斯托克斯和反斯托克斯散射光频率与入射光频率之差(△v),拉曼位移取决于分子振动能级的变化,它与入射光频率无关,不同的化学键或基态有不同的振动方式,决定了其能级间的能量变化,因此与之对应的拉曼位移也具特征(贺福,2005;张延会等,2006),这是拉曼光谱进行分子结构定性分析的理论依据。拉曼光谱的纵轴代表谱峰强度,谱峰的强度与产生谱峰特定物质的浓度有关(Tuinstra and Koenig, 1970;张延会等,2006)。
石墨为层状结构,共有六支色散曲线(图 2a)(Malard et al., 2009),分别为三个光学支(面内纵向光学支iLO、面内横向光学支iTO和面外横向光学支oTO)和三个声学支(面内纵向声学支iLA、面内横向声学支iTA和面外横向声学支oTA)。面内(i)和面外(o)分别为原子的振动方向平行或者垂直于石墨烯平面,纵向(L)和横向(T)即为原子的振动方向平行或者垂直于A-B碳碳键的方向(吴娟霞等,2014)。这些晶格振动产生的色散曲线表示出各种振动模式的频率与波矢散射的关系(图 2a)。

|
图 2 碳质物拉曼光谱产生原理 (a)单层石墨烯振动曲线(据吴娟霞等,2014修改);(b)石墨晶体D6h4空间群振动模式及振动频率(据贺福,2005);(c)碳质物典型拉曼光谱(据吴娟霞等,2014修改);(d)碳质物各个拉曼特征峰产生过程(据吴娟霞等,2014) Fig. 2 Formation principle of carbon material Raman spectroscopy (a) phonon dispersion relation in graphite (modified after Wu et al., 2014); (b) vibration mode and frequency of graphite group (after He, 2005);(c) example of Raman spectrum of carbon material (modified after Wu et al., 2014); (d) generate process of carbon material Raman characteristic peak (after Wu et al., 2014) |
石墨属于D6h4空间群,每个原胞中包含四个碳原子,六种振动模式(Tuinstra and Koenig, 1970)。图 2b给出了石墨空间群D6h4的6种振动模式及其振动频率(贺福,2005),在这些振动模式中,只有E2g满足拉曼选择定则,即具有拉曼活性(Tuinstra and Koenig, 1970;Malard et al., 2009),其余的为红外活性和非光活性。对于E2g拉曼活性振动又可分为E2g1(47cm-1)和E2g2(1582cm-1)。E2g1是相邻网平面之间的相互振动,因其强度低且易受入射光谱线影响而难以测量,故在晶格完整无杂质的石墨拉曼光谱中只存在G峰,对应于E2g2(1582cm-1)振动模式。对于石墨化程度较低的碳质物,除G峰外,还会出现一系列缺陷峰(图 2c),如下所述。
碳质物典型的拉曼光谱由一级序区(1100~1800cm-1)和二级序区(2500~3100cm-1)两部分组成(Tuinstra and Koenig, 1970;Nemanich and Solin, 1979)(图 2c)。在一阶序区,碳质物拉曼光谱特征峰包括D1(D)峰(1350cm-1)、G峰(1580cm-1)和D2(D’)峰(1620cm-1),结晶度低的碳质物中通常还有D3峰(1520cm-1)和D4峰(1245cm-1),其中,G峰代表石墨峰,D峰代表缺陷峰。二阶序区对应于倍频和散射组合,主要为S1峰(2700cm-1)和S2峰(2900cm-1)(Nemanich and Solin, 1979;Wopenka and Pasteris, 1993)。
图 2d展示了碳质物典型拉曼特征峰产生的过程,G峰是与布里渊区中心双重简并的iTO和iLO光学声子相互作用的结果(Tuinstra and Koenig, 1970)。Tuinstra and Koenig(1970)最初估计G峰的位置约为1575cm-1,后人的研究也表明G峰的位置及强度随入射波长的变化而变化(Wang et al., 1990;Matthews et al., 1999;Sato et al., 2006)。D1峰最初归因于碳质物小晶体或大晶体边缘的A1g振动模式(Tuinstra and Koenig, 1970),但进一步的研究发现D1峰是一个iTO声子与一个缺陷谷间散射的结果(Beny-Bassez and Rouzaud, 1985;Malard et al., 2009;吴娟霞等,2014)。D2峰则为谷内双共振过程,两次散射过程分别为与缺陷的谷内散射和与K点附近的iLO声子的非弹性谷内散射过程(吴娟霞等,2014),常出现在G峰段肩部,在结晶度低的碳质物中,常不能将二者分开,只在1600cm-1附近现一个宽带(Kouketsu et al.(2014)称其为Gl带)。D3峰推测来自无定形碳(Sadezky et al., 2005),Beny-Bassez and Rouzaud(1985)将该带归因于四面体碳等面外缺陷,认为这种缺陷在石墨化过程早期出现。D4峰由sp2-sp3键或多烯类结构的C-C和C=C伸缩振动产生。S1峰是与K点附近的iTO光学声子发生两次谷间非弹性散射产生的,S1峰拉曼位移约为D1峰的两倍,因此通常表示为2D峰,但S1峰的产生与缺陷无关,并非D1峰的倍频信号(吴娟霞等,2014)。在石墨化的最终阶段S1峰将会分裂成两部分,这种分裂被解释为碳质物二维结构朝向三维结构过渡的结果(Lespade et al., 1984)。至于S2峰,它的含义还不是很清楚,通常只出现在结晶度低的碳质物中,Tsu et al.(1978)将其归因于C-H键的存在,但是这种假设仍存在争议。
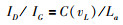
如上所述,产生D峰的缺陷种类很多,如结构缺陷、面内杂原子等。最初Tuinstra and Koenig(1970)根据D峰强度与晶体尺寸的关系,并给出著名的TK(Tuinstra Koenig)公式:
|
(i) |
该公式首次建立了碳质物石墨化程度与拉曼光谱的关系。式中ID/IG是D峰和G峰的强度比,La是纳米晶体的横向尺寸(平行于石墨烯平面)。考虑到D峰可由其他类型的缺陷所激活(如局部杂质),新近研究量化了ID对离子轰击在石墨上引起的缺陷密度的依赖性(Ferreira et al., 2010;Lucchese et al., 2010)。在这种情况下,TK关系变成了(ID/IG)∝(1/La2),其La2是石墨烯平面中缺陷的平均距离。已知随着石墨化程度(结晶度)的增加,La逐渐增大,因此可以通过ID/IG来量化表示碳质物的石墨化程度(结晶度)(Wopenka and Pasteris, 1993;Beyssac et al., 2002b)。
变质沉积岩中碳质物拉曼光谱表现出随变质等级系统变化(图 3),通常变质等级越高,拉曼光谱谱峰值的数量越少(Pasteris and Wopenka, 1991;Wopenka and Pasteris, 1993;Yui et al., 1996;Beyssac et al., 2002a),并且实验和天然样品观测表明,碳质物质的石墨化过程中温度是主要控制因素,而压力为次级影响因素(图 4a, b)(Landis, 1971;Wopenka and Pasteris, 1993;Wada et al., 1994;Beyssac et al., 2002a, b;Rahl et al., 2005;Aoya et al., 2010;Lahfid et al., 2010;Kouketsu et al., 2014)。对天然地质样品观测显示,随变质程度的增加,La(石墨结晶度参数)随之增加,即石墨化程度增加(图 4c)(Wopenka and Pasteris, 1993)。在此基础上Beyssac et al.(2002a)根据拉曼参数R2(R2=D1/(G+D1+D2)area)与变质温度之间的正相关性,拟合出碳质物拉曼参数与变质温度之间的关系方程,建立了碳质物温度公式(如图 4d)。

|
图 3 变质岩中碳质物拉曼光谱随温度增加演化图 数据来源: Beyssac et al., 2002b;Lahfid et al., 2010 Fig. 3 The evolution of Raman spectra of carbon material with increasing metamorphic temperature in metamorphic rock All the samples come from Beyssac et al., 2002b; Lahfid et al., 2010 |

|
图 4 碳质物石墨化程度与温度、压力之间的关系 (a)碳质物石墨化程度与变质温度之间的关系(据Wada et al., 1994);(b)温度和压力对碳质物石墨化程度的影响(据Landis, 1971);(c)变质等级与碳质物石墨化程度之间的关系(据Wopenka and Pasteris, 1993);(d)碳质物拉曼光谱参数(R2)与变质温度之间的关系(据Beyssac et al., 2002a) Fig. 4 The relationships between the degrees of graphitization of carbon material and temperatures/pressures (a)relationship between the degrees of graphitization and the metamorphic temperatures(after Wada et al., 1994); (b)effect of temperatures and pressures on the degrees of graphitization(after Landis, 1971); (c)the relationship between metamorphic grades and degrees of graphitization of carbon material(after Wopenka and Pasteris, 1993); (d)the relationship between the Raman parameter(R2) and the peak metamorphic temperature(after Beyssac et al., 2002a) |
Beyssac et al.(2002a)通过激光拉曼(514.5nm入射激光)分析了全球10个区域变质地区的54个样品,发现碳质物结晶度与变质峰期温度密切相关,而与变质压力无关。基于变质矿物组合获得的变质温度和R2参数之间的线性关系,构建了温度计算公式(公式1,表 1)。
|
|
表 1 变质岩中碳质物拉曼温度计公式 Table 1 Various formulas for carbon material Raman thermometers |
该温度计适用于区域变质岩,基于碳质物石墨化过程不可逆性(Landis, 1971;Pasteris and Wopenka, 1991;Wopenka and Pasteris, 1993;Wada et al., 1994;Buseck and Beyssac, 2014),Beyssac et al.(2002a)解释该温度代表变质峰期温度。
为了将碳质物拉曼温度计外延至更低的温度,Rahl et al.(2005)通过激光拉曼(532nm激光源)对来自华盛顿州奥林匹克山脉的11个经历变质的硅质碎屑岩样品进行分析,拉曼数据结果显示,R1(R1=D1/Gintensity)在低温变质过程中(100~350℃)仍然保持变化,从115℃的0.5增加到250℃的2.1,随后在更高的温度条件下减小,这些学者们结合Beyssac et al.(2002a)的数据,提出新的经验性温度估算方程,将碳质物拉曼温度计的应用范围扩展至100~700℃(公式2,表 1)。
Rahl et al.(2005)对该公式进行了方差和残差的检验,得出该公式在95%的置信度的情况下误差为±50℃。但其也强调该公式仅仅是对已有数据拟合得到的一个经验公式,还需要在实际的地质运用中进行修正和完善。
Lahfid et al.(2010)对格拉鲁斯阿尔卑斯山低级变质岩(钙质片岩、石英片岩)的研究发现,低级变质岩中的碳质物拉曼光谱与高级变质岩中碳质物拉曼光谱明显不同且更加复杂,最显著的区别是高等级变质岩碳质物拉曼光谱中不存在D3、D4峰。低级变质岩中碳质物拉曼光谱的复杂性也暗示Beyssac et al.(2002a)基于中级变质程度提出的温度计不能简单的扩展至低温环境。进而,Lahfid et al.(2010)通过比较各种参数(如R1、R2)描述碳质物拉曼光谱随变质等级增加演变的能力,提出了两个新的参数RA1(RA1=(D1+D4)/(D1+D2+D3+D4+G)area)和RA2(RA2=(D1+D4)/(D1+D2+D3+D4+G)area),用于定量化描述格拉鲁斯阿尔卑斯山低级变质岩(钙质片岩、石英片岩)在200~320℃范围内的碳质物拉曼光谱随温度演化(图 5),通过简单变换可得到应用于200~320℃范围内的温度计方程式(公式3、4,表 1)。该温度计误差为±25℃,然而该温度计仅由一个变质区域的样品构建,正如Lahfid et al.(2010)所阐述的,用于校准该温度计的样品变质温度在一个有限的范围内,因此,无法将该温度计外延到温度高于320℃的变质环境。

|
图 5 格拉鲁斯阿尔卑斯山地区低级变质岩内碳质物拉曼光谱参数随变质温度演化图(据Lahfid et al., 2010) (a)RA1随变质温度演化图;(b)RA2随变质温度演化图 Fig. 5 Evolution of carbon material Raman spectral parameters with metamorphic temperatures in low-grade metamorphic rocks in the Glarus Alps(after Lahfid et al., 2010) (a)evolution of the RA1 with temperature; (b)evolution of the RA2 with temperature |
近年来,Kouketsu et al.(2014)利用激光拉曼(532nm入射激光)对日本中央构造带内的19个变质沉积岩中碳质物进行分析,将获得拉曼光谱参数(R1、R2等)与样品已知的变质温度进行比较,发现变质温度与D1峰和D2峰的全峰半高宽(FWHMD1、FWHMD2)呈负相关,并利用二者之间的相关性,构建了适用于150~400℃温度范围的地质温度计,即半宽高(FWHMD1、FWHMD2)与变质温度的关系方程(公式5、6,表 1)。
Kouketsu et al.(2014)认为,在200~400℃的变质条件下,公式5比公式6更为准确,而在150~200℃的变质条件下,公式5更准确,公式5的误差为±30℃,而公式6的误差为±50℃(在FWHM柱状图不出现宽峰或者双峰的条件下)。当变质温度接近或者超过400℃时使用该公式需要谨慎,Kouketsu et al.(2014)提出了在此情况下使用该温度计的条件,当D1/G(强度)大于1.0时,公式5、6是适用的,当D1/G(强度)小于1.0时,使用公式5或6时应当与前人提出的温度计进行相互检验和验证。值得注意的是,前人提出的温度计均是以比率作为参数,这样做的好处是可以减少对实验设备的依赖性,但Kouketsu et al.(2014)通过比较不同实验室的测量结果,认为FWHM测定不受实验室变化的影响。此外由于该温度计使用的温度范围为150~400℃,贯穿了碳质物从无定形碳向结晶石墨转化的整个过程,因此在选择拉曼谱峰拟合方法时尤需严谨以便获得可靠的温度,拉曼谱峰分解方法可参考Kouketsu et al.(2014)提出的谱峰拟合程序。
Aoya et al.(2010)将温度计适用范围从区域变质岩扩展至接触变质岩。接触变质岩与区域变质岩最大的不同是岩石变形弱且加热时间长,这种属性导致接触变质岩中碳质物结晶程度高,表现为更低的R2值(Aoya et al., 2010),由于使用532nm激光比使用514.5nm激光能够获得相对更大的R2值(Wang et al., 1990;Matthews et al., 1999;Sato et al., 2006;Beyssac and Lazzeri, 2012),因此Aoya et al.(2010)使用532nm激光拉曼对来自日本Daimonji和Kasuga地区的领家变质带中的11个接触变质岩样品(原岩为泥质岩和砂岩)进行分析,并提出适用于接触变质作用过程的温度估算的公式(公式7,表 1)。
这些作者强调该温度计适用范围是340~655℃的接触变质岩,测试过程使用的入射激光波长为532nm。此外,Aoya et al.(2010)发现Beyssac et al.(2002a)所提出的温度计在温度小于330℃及大于550℃时估算存在明显偏差。因此利用Beyssac et al.(2002a)报道的数据对区域变质岩的温度计进行了进一步修正(入射激光514.5nm),如公式8(表 1)。
修正后的温度计算公式,适用温度范围为300~650℃(Aoya et al., 2010),Aoya et al.(2010)认为Beyssac et al.(2002a)提出的温度计不仅适用于区域变质岩,也适用于接触变质岩,只不过在接触变质岩温度估算中误差较大(±50℃),但该温度计(公式7,表 1)可通过增加测试点数量来降低温度估算误差(主张单个样品测量的数量应大于50个),误差可降至±30℃。
1.3 碳质物拉曼光谱温度计的影响因素碳质物拉曼光谱测试从样品制备到光谱处理过程中产生误差的原因可归结为三大类(表 2):(1)光谱的拟合引入的误差;(2)碳质物自身特性引入的误差;(3)拉曼光谱系统使用时的误差(Lünsdorf et al., 2014)。光谱拟合过程中的误差来自于不同的基线校正,用于峰匹配的不同数学函数以及不同的拉曼光谱模型。碳质物自身特性引入的误差主要来自碳质物结构的各向异性、样品的制备及样品的非均质性。拉曼光谱系统使用产生的误差主要与入射激光的波长及测量时间有关,下文将对这三类影响因素做进一步的阐释。
|
|
表 2 碳质物温度计的影响因素 Table 2 Affecting factors of the carbonaceous Raman spectroscopy thermometers |
从拉曼光谱中获取碳质物结晶度定量参数需要进行光谱拟合,光谱拟合过程中用于峰匹配的数学函数以及不同的拉曼光谱模型的选择受个人影响较大,建立一种可靠且重复的碳质物拉曼光谱拟合的方法是开发适用于各种变质温度的碳质物拉曼温度计需要克服的最大问题之一(Kouketsu et al., 2014)。目前,光谱拟合普遍使用Peakfiting和Fityk软件,通常不同的光谱拟合软件对拟合结果不会产生影响(Lünsdorf et al., 2014)。光谱拟合第一步是基线校正,这对任何拟合程序的质量和可重复性都至关重要,对于石墨很简单,因为基线是线性的,如果结构很混乱,基线会变得很复杂,通常伴随着荧光性组分的影响,荧光可能是由相邻的矿物质导致的,基线校准过程中必须明确规定做出的所有假设。关于光谱拟合,使用最多的函数是Voigt(洛伦兹和高斯函数的组合)和洛伦兹函数。对于高结晶度的石墨,使用Voigt函数的三波段拟合(G、D1和D2)将产生优异的结果(图 6;Beyssac et al., 2003, 2004);随着碳质物结晶度的降低,在拉曼光谱一阶序区出现D3峰,对于低结晶度碳质物光谱,使用五个Voigt函数将会增加系统的自由度并导致多种拟合方案。另一种方法是使用纯洛伦兹或高斯函数来降低系统的自由度,以此获得唯一且可重复的拟合方案(Sadezky et al., 2005;Lahfid et al., 2010)。Lünsdorf et al.(2014)认为对于低结晶度碳质物拉曼光谱只使用洛伦兹函数拟合将得到更好的结果,而随着碳质物结晶度的增加,拟合函数的选择不会影响拟合结果。由于洛伦兹函数拟合对低结晶样品和高结晶样品光谱拟合均表现良好,因此Lünsdorf et al.(2014)建议使用该函数拟合所有结晶度的样品。

|
图 6 碳质物拉曼光谱拟合实例(使用Voigt函数三波段拟合) Fig. 6 Example of peak-fitting procedures for Raman spectroscopy of carbon material(three-bands fitting by using Voigt function) |
碳质物自身固有的误差主要来源于样品的制备、样品的非均质性及碳质物结构的各向异性(Beyssac and Lazzeri, 2012;Lünsdorf et al., 2014)。Pasteris(1989)研究发现,除碳质物固有结构缺陷外,锯切或抛光可能产生新的结构缺陷,对薄片表面碳质物进行直接测试将会受新产生的结构缺陷影响。这些缺陷在拉曼光谱中无法区分,且随着碳质物的结晶度增加锯切或抛光产生的影响也增加,这种效应对于晶格完整的石墨最为显著(Beyssac et al., 2003)。Pasteris(1989)认为通过测量薄片内部的碳质物可避免这种误差,即将激光聚焦在透明/半透明相邻矿物颗粒下方的碳质物来实现。笔者的研究也从“反面”进一步证实了这种效应,如图 7所示,图中表层碳质物其实并未真正的暴露在薄片上表面,相反,内部的碳质物已经暴露在薄片的下表面,受抛光的影响产生缺陷峰。因此将激光聚焦在透明/半透明相邻矿物颗粒下方的碳质物时,也应注意透明颗粒下方的碳质物是否暴露在岩石薄片的下表面。

|
图 7 薄片表面碳质物与内部碳质物拉曼光谱对比 (a)青藏高原嘉黎韧性走滑剪切带内的糜棱岩化片岩单偏光显微照片;(b)碳质物反射光及透射光下的显微照片;(c)表面及内部碳质物拉曼光谱 Fig. 7 Comparison of Raman spectra of carbon material obtained at the surface of a thin section(triangle) and at inside within the thin section(circle) (a)photomicrograph under single polarized light for the mylonite schist from Jiali ductile strike-slip shear zone of the Tibet; (b)photomicrographs under reflected and transmitted light for carbon material from Fig. 7a; (c)Raman spectroscopy of carbon material obtained at the surface of a thin section and at inside within the thin section |
除了薄片制备过程会产生误差外,碳质物取向(结构各向异性)相对于入射激光的方向,对拉曼光谱也有影响,尤其是结晶程度高的石墨(Katagiri et al., 1988;Wang et al., 1989;Compagnini et al., 1997)。通常入射激光垂直于C轴比平行C轴产生的G峰更小,D1峰更大,即R2值在垂直于C轴的测量中较大(Aoya et al., 2010;Beyssac and Lazzeri, 2012)。Aoya et al.(2010)比较了入射激光平行和垂直于C轴的测量结果,以检验取向的影响,结果表明对于结晶度高的碳质物,平均R2比率不受取向的影响,但R2非零值,在垂直于C轴和平行于C轴方向上存在很大的差异,入射激光垂直于C轴会比平行于C轴产生更大的R2值,但只要测量的数量足够多(N≥25),即使是结晶度高的碳质物,R2的平均值也不受碳质物取向的影响。上述的讨论表明,结晶度高的碳质物R2取向效应更为显著,这是由于结晶度高的石墨具有较强的各向异性(Beyssac et al., 2002a)。
相比碳质物的非均质性,碳质物取向的影响可以忽略(Aoya et al., 2010)。天然碳质物结构和化学成分在微米尺度上通常是不均匀的(Planeix et al., 1994;Dreyer and Bielawski, 2011)。很多学者通过透射电镜(TEM)和X射线吸收近边光谱(XANES)在纳米尺度上对碳质物的非均质性进行了观测(Buseck and Huang, 1985;Beyssac et al., 2002b;Bernard et al., 2007, 2008;van Zuilen et al., 2012),结果表明碳质物结构非均质性非常强,结晶度高的石墨和结晶度低的无定型碳共存于同一块岩石中。如陨石中Fe-Ni颗粒中包含石墨片,而陨石基质中则存在低结晶度无定型碳(Piani et al., 2012),以及变质沉积岩中由有机物石墨化产生的碎屑石墨和无定型碳共存(Beyssac et al., 2004)。在这两种情况下,石墨和无定型碳不是同时形成的,但却经历相同的石墨化过程。因此,在拉曼研究过程中,对碳质物进行岩石学研究以描述其形态和与矿物的结构共生关系至关重要。Aoya et al.(2010)通过实验表明这种来自于碳质物非均质性的误差可以通过大量的测试数据(单个样品测量数N>50)来减小。
拉曼系统固有误差可能来自于拉曼光谱的获取时间及入射波长的大小。由于黑色的碳质物会吸收可见光范围内的光(激光),不同的拉曼光谱获取时间即不同的加热时间,碳质物受热会导致光氧化或局部燃烧,从而改变局部化学成分和结构(Beyssac and Lazzeri, 2012)。激光诱导的加热是G峰、D峰左移的原因(Everall et al., 1991;Kagi et al., 1994)。Tuinstra and Koenig(1970)测得G峰位置为1575cm-1可能是由于这种原因造成的(现在普遍接受的是1580cm-1)。对于从岩石中提取出的碳质物,激光加热效应尤为显著,解决方法是在提取出的碳质物下方垫块铜片并置于氩气环境中(Beyssac and Lazzeri, 2012)。对于薄片样品,激光加热引起的误差可以忽略(Aoya et al., 2010)。这是由于薄片中碳质物不会直接暴露在空气中,并且诱导产生的热量也可以通过上方或周围的矿物传导散去。
此外,入射激光的能量对碳质物拉曼光谱具有显著的影响,尤其是缺陷峰(D峰),通常入射激光能量的减小会使D峰向左偏移(Sato et al., 2006)。碳质物拉曼光谱常用的入射激光能量为2.33eV(532nm),地球科学领域常用的激光能量为2.41eV(514nm),但由于在低等级(低温)变质岩中,更高的激光能量能够减少荧光背景并获得较大的R1、R2比值,因此近年来所提出的温度计多使用2.33eV(532nm)的入射激光来获取拉曼图像(Aoya et al., 2010;Kouketsu et al., 2014)。
2 碳质物拉曼光谱温度计与传统温度计对比上述不同学者所提出的温度计已被应用于不同的变质岩区,特别是Beyssac et al.(2002a)提出的基于R2构建的温度计应用最为广泛。为评估碳质物拉曼温度计可靠性,本次研究对已发表的同一地区同一地体碳质物拉曼温度计所估算的温度与传统温度计计算的温度进行了对比,包括尼泊尔低喜马拉雅泥质片岩(Beyssac et al., 2004),尼泊尔DZAKAACHU地区的藏南拆离系中的糜棱岩化大理岩(Cottle et al., 2011),印度阿鲁纳恰尔地区喜马拉雅造山带中的长英质片岩、云母片岩、千枚岩(Mathew et al., 2013),龙门山片岩(Robert et al., 2010),西阿尔卑斯Oisans地块的灰岩、页岩及绿泥石片岩(Bellanger et al., 2015),新西兰奥塔哥片岩(Hu et al., 2015),西摩洛哥Jebilet地块绿片岩、角闪岩相变质的泥质岩(Delchini et al., 2016),日本西纪伊半岛泥质片岩(Yoshida et al., 2016),希腊基克拉泽斯蓝片岩和榴辉岩(Laurent et al., 2018)(表 3)。
|
|
表 3 碳质物温度计与传统温度计对比表 Table 3 Calculated results from carbon material geothermometers and conventional geothermometers |
对比结果如图 8所示,图中横坐标为碳质物拉曼温度计(基于Beyssac et al.(2002a)和Rahl et al.(2005)温度计公式)估算的峰期变质温度,纵坐标为传统温度计(相平衡模拟、矿物组合)获取的变质温度,虚线为y=x直线。结果显示碳质物拉曼温度计与传统温度计所获得的变质温度值均分布于y=x斜直线附近,总体上碳质物拉曼温度计与传统温度计估算的温度较为接近,二者之间的差别也在分析和校准误差范围内。拉曼温度计相对误差通常小于15℃,远小于传统温度计(±50℃)。但Robert et al.(2010)和Cottle et al.(2011)在龙门山、尼泊尔DZAKAA CHU地区的研究表明,碳质物拉曼温度计与传统温度计存在较大差异,二者结果相差约100℃,原因是Cottle et al.(2011)和Robert et al.(2010)用传统温度计估算的温度代表退变质温度,而碳质物拉曼温度计结果为峰期变质温度,且不受后期退变质的影响(Landis, 1971;Pasteris and Wopenka, 1991;Wopenka and Pasteris, 1993;Wada et al., 1994;Beyssac et al., 2002a, b, 2004, 2007;Rahl et al., 2005;Negro et al., 2006;Angiboust et al., 2009;Gabalda et al., 2009;Lahfid et al., 2010),因此,二者之间存在较大差异。

|
图 8 碳质物温度计与传统温度计估算结果对比 Fig. 8 Comparison of calculated results from the carbon material thermometer and traditional thermometers |
解析造山带形成过程的空间和时间热演化是造山带研究的核心。变质温度估算、热年代学和地质年代学已成为约束造山带热演化的关键信息。传统温度计对于特定矿物组合的要求限制了其在造山带中的应用,而每个造山带均会产生增生楔沉积物质,这些沉积单元中富含碳质物,为碳质物拉曼温度计的使用提供了基本的物质基础。碳质物拉曼光谱温度计一经提出便得到广泛使用,如在造山带热结构和热演化史方面(Beyssac et al., 2004;Robert et al., 2010;Cottle et al., 2011;Kellett and Grujic, 2012;Cooper et al., 2013;Mathew et al., 2013;Scharf et al., 2013;Bellanger et al., 2015;Boutoux et al., 2016;Delchini et al., 2016;Yoshida et al., 2016;Laurent et al., 2018;Molli et al., 2018)、成矿流体的古流体热异常(Clerc et al., 2015;Delchini et al., 2017)、以及强应变带剪切热过程等(Furuichi et al., 2015;Mori et al., 2015;Ito et al., 2017)。在实际运用的过程中,其有效性也得到了进一步的检验(Beyssac et al., 2004;Scharf et al., 2013;Delchini et al., 2016;Laurent et al., 2018)。
Beyssac et al.(2004)利用该温度计限定了低喜马拉雅热演化,研究表明低喜马拉雅(LH)经历了一次大规模的热变质作用,温度从顶部540℃逐渐降低到最深折返层内的330℃。Mathew et al.(2013)利用Beyssac et al.(2002a)和Rahl et al.(2005)提出的温度计估算了西阿鲁纳恰尔拉邦低喜马拉雅和西瓦里克热演化史,研究发现大喜马拉雅序列(GHS)在主中央逆冲区温度从700~800℃降至650~700℃,并在西瓦里克的中上新世序列中进一步降低至200℃,据此预测GHS倒置的变质梯度演化与渠道流模型紧密相关。在阿尔卑斯造山带,Bellanger et al.(2015)使用碳质物拉曼光谱温度计、绿泥石温度计结合白云母40Ar/39Ar原位测年对西阿尔卑斯Oisans地块的演化进行了温度和年龄的限制,提出了西阿尔卑斯外部结晶块(ECM)新的缩短模式。其后有学者结合锆石的(U-Th-Sm)/He与碳质物拉曼温度计数据,约束了西阿尔卑斯山ECM的热演化和折返过程(Boutoux et al., 2016)。Molli et al.(2018)将碳质物拉曼光谱温度计应用于亚平宁山脉,其搜集的数据修正了亚平宁山脉热结构及阿普亚内山核部变形与变质结构之间的关系,解释认为残存的古热结构及部分折返与地壳增厚有关,提出阿普亚内杂岩为冷的变质核杂岩。Laurent et al.(2018)利用石榴石平衡模型、P-T相图结合碳质物拉曼光谱测温数据恢复了希腊基克拉迪蓝片岩(CBU,Greece)峰期变质温度,表明该地区经历了多阶段的折返过程,并认为这种折返由板块回卷驱动制约。碳质物拉曼光谱温度计还被成功运用在洋壳深俯冲型低温-超高压变质杂岩带。通过碳质物拉曼光谱温度计和石英包裹体弹性压力计的联合应用,Bayet et al.(2018)对中亚造山带西端的西南天山低温-超高压变质杂岩带进行了区域大尺度的P-T绘图,发现前人所厘定的HP/UHP混杂岩的北部整体上经历了较为均一的低温超高压榴辉岩相峰期变质条件(2.5±0.2GPa,536±11℃)。此外,在对区域内前人工作进行了系统总结的前提下,Tan et al.(2019)基于激光微区40Ar/39Ar测年法、锆石U-Pb定年、相平衡P-T计算及碳质物拉曼光谱温度计等手段,开展了区域大尺度P-T-t-D绘图,指出前人所厘定的高压/超高压混杂带从北到南应划分为具有不同峰期变质P-T-t-D演化历史的四个次级构造单元,分别是:北部超高压单元(~2.75GPa,480~560℃,320±1Ma),中部蓝片岩/榴辉岩相基性单元(~2.1GPa,505℃,332±2Ma),中部低蓝片岩相超基性-基性单元(~1.45GPa,485℃,359±2Ma)及南部低蓝片岩-绿片岩相过渡带(>0.7~1.0GPa,470~520℃,ca. 280~310Ma),所揭示出的四期短暂的深部岩石折返事件暗示了俯冲地温梯度存在时空上的渐进变化(~12℃/km到6~7℃/km),这可能反映了俯冲带系统随着时间发生冷却。
许多矿床存在于富含碳质物的变质沉积物中。因此对碳质物结晶度的研究提供了估算岩石变质峰值温度的精确工具。地层温度通常由地层的埋藏剥蚀、岩浆侵入和流体循环控制。在热液矿床中,碳质物可以提供热事件及之后最高温的准确信息,因此,碳质物可以用于研究古温度并阐明流体流动引起的热异常(Clerc et al., 2015;Delchini et al., 2017)。为了检验碳质物拉曼光谱温度计在热液矿床环境中检测热异常的能力,以美国加利福尼亚州的弗朗西斯卡杂岩Lucia微地体为例进行了研究,表明碳质物拉曼光谱温度计是确定由热液流动引起的热异常的可靠工具(Lahfid et al., 2010)。碳质物拉曼温度计在北比利牛斯Arguenos-Moncaup地区估算的变质温度也与前人研究结果吻合(Clerc et al., 2015),碳质物拉曼光谱温度数据集清楚地表明了地幔折返和热异常之间的联系,并且证实了该地区变质作用与白垩纪地壳减薄之间的联系。此外,碳质物拉曼光谱温度计提供了一个方便快捷获取岩石古温度的方法,并且能够广泛用于矿产勘查(Delchini et al., 2017)。Delchini et al.(2017)将碳质物拉曼光谱温度计运用至矿产勘探,通过碳质物拉曼温度计解析了Jebilet地块矿床的热历史,表明该地区经历了构造、变质和热液事件,这些因素共同影响着矿床的形成,同时也检验了碳质物拉曼光谱温度计对于检测古热异常的有效性。
在大陆地壳发育长期活动的断层体系,如走滑断层,转换断层和俯冲边界。对主断层的剪切应力的估算是了解地壳强度和大地震的产生以及与运动相关剪切生热程度的重要前提。出露地表的断裂带记录了深部地壳的变形,是观测剪切生热和断裂强度的天然实验室。由于缺乏合适的矿物以及温度变化较小,基于传统岩相学的温度计不再适用(d’Alessio et al., 2003;Yamada et al., 2007;Tagami, 2012)。Ito et al.(2017)通过分析天然和实验合成的粘土岩中假熔岩的拉曼光谱,认为假熔岩中的碳质物拉曼光谱特征可以用于评估共震断层强度。比较碳质物质结晶动力学实验的结果与热模拟结果表明,碳质物拉曼光谱温度计非常适合估算主断层带的剪切生热(Mori et al., 2015),这些作者对日本中央构造带(MTL)泥质片岩分析发现在垂直于MTL断层面的150m附近存在约60℃的峰值温度上升(图 9a),这种与断层空间相关联热异常意味它是由剪切加热引起的(图 9b)。然而,近年来摩擦实验研究表明,镜质体反射率(R0)和碳质物拉曼光谱温度计均可以用于检测断层摩擦生热,但常规镜质体反射率(R0)和碳质物拉曼光谱温度计不能精准估算地震断层滑动期间的峰值温度,需要结合高位移速率下快速加热的反应动力学及碳质物原始微观结构和成分相关研究,建立适用于断层摩擦加热的碳质物拉曼光谱温度计(Furuichi et al., 2015)。

|
图 9 MTL地区热异常成因(据Mori et al., 2015修改) (a)垂直MTL断层的碳质物拉曼温度剖面;(b)MTL地区构造演化模型 Fig. 9 Causes of thermal anomalies in MTL areas(modified after Mori et al., 2015) (a)cross-sections across the MTL fault with carbon material Raman spectrum temperaturesand; (b)tectonic evolution model in MTL region |
本文综述了碳质物拉曼温度计的基本原理和影响因素,对比分析了碳质物拉曼温度计与传统温度计估算结果,并讨论了该方法在造山带热结构恢复、热演化、以及断层剪切生热等方面的研究实例。
该方法是基于碳质物石墨化程度(结晶度)与温度之间的关系构建的温度计,其计算公式是通过分析大量天然与实验样品统计归纳得到的经验性公式,估算的温度代表峰期变质温度,不受后期退变质的影响,可估算的温度范围为100~700℃(相对误差±15℃,绝对误差±30℃),与传统温度计相比更为便捷。
对于本文总结归纳的不同版本的碳质物拉曼光谱温度计,在使用的过程中我们需要根据研究区的地质条件和环境给予选择不同的温度计公式,就目前碳质物拉曼光谱温度计使用情况来看,普遍使用的是Beyssac et al.(2002a)提出的温度计及Rahl et al.(2005)提出的温度计,但需要特别注意的是,Beyssac et al.(2002a)和Rahl et al.(2005)提出的温度计适用于区域变质岩,当样品来自于接触变质带时,选择Aoya et al.(2010)提出的温度计估算温度可能会得到更加准确的结果。
碳质物拉曼光谱温度计相比传统温度计其最大的特点是记录最高温变质温度,不受后期退变质影响,因此结合传统温压计可以更好的描述岩石多期次变质历史。但同时也需注意,影响碳质物结晶度的因素不仅仅只有温度,在低温环境中,压力、变质作用持续时间、碳质物前体类型甚至是变形均会影响碳质物结晶度,但目前为止,尚未有人量化这些因素对碳质物拉曼光谱温度计的影响,这也是碳质物拉曼光谱温度计今后需要进一步完善的地方。
致谢 本研究成果还得到北京大学造山带与地壳演化教育部重点实验室SEM-EBSD实验室和TIMA实验室的资助;审稿专家及俞良军老师严谨细致审阅全文,提出了很多建设性的修改意见与建议,对论文质量的提高大有帮助;在此一并表示衷心感谢。
Angiboust S, Agard P, Jolivet L and Beyssac O. 2009. The Zermatt-Saas ophiolite:The largest (60km wide) and deepest (c. 70~80km) continuous slice of oceanic lithosphere detached from a subduction zone? Terra Nova, 21(3): 171-180 |
Aoya M, Kouketsu Y, Endo S, Shimizu H, Mizukami T, Nakamura D and Wallis S. 2010. Extending the applicability of the Raman carbonaceous-material geothermometer using data from contact metamorphic rocks. Journal of Metamorphic Geology, 28(9): 895-914 DOI:10.1111/j.1525-1314.2010.00896.x |
Banno S and Sakai C. 1989. Geology and metamorphic evolution of the Sanbagawa metamorphic belt, Japan. In: Daly JS, Cliff RA and Yardley BWD (eds.). Evolution of Metamorphic Belts, Special Publication. Geological Society, London, Special Publication, 43(1): 519-532
|
Bayet L, John T, Agard P, Gao J and Li JL. 2018. Massive sediment accretion at~80km depth along the subduction interface:Evidence from the southern Chinese Tianshan. Geology, 46(6): 495-498 DOI:10.1130/G40201.1 |
Bellanger M, Augier R, Bellahsen N, Jolivet L, Monié P, Baudin T and Beyssac O. 2015. Shortening of the European Dauphinois margin (Oisans Massif, Western Alps):New insights from RSCM maximum temperature estimates and 40Ar/39Ar in situ dating. Journal of Geodynamics, 83: 37-64 DOI:10.1016/j.jog.2014.09.004 |
Beny-Bassez C and Rouzaud JN. 1985. Characterization of carbonaceous materials by correlated electron and optical microscopy and Raman microspectroscopy. Scanning Electron Microscopy, 1: 119-132 |
Bernard S, Benzerara K, Beyssac O, Menguy N, Guyot F, Brown Jr GE and Goffe B. 2007. Exceptional preservation of fossil plant spores in high-pressure metamorphic rocks. Earth and Planetary Science Letters, 262(1-2): 257-272 DOI:10.1016/j.epsl.2007.07.041 |
Bernard S, Beyssac O and Benzerara K. 2008. Raman mapping using advanced line-scanning systems:Geological applications. Applied Spectroscopy, 62(11): 1180-1188 DOI:10.1366/000370208786401581 |
Beyssac O, Goffé B, Chopin C and Rouzaud JN. 2002a. Raman spectra of carbonaceous material in metasediments:A new geothermometer. Journal of Metamorphic Geology, 20(9): 859-871 DOI:10.1046/j.1525-1314.2002.00408.x |
Beyssac O, Rouzaud JN, Goffé B, Brunet F and Chopin C. 2002b. Graphitization in a high-pressure, low-temperature metamorphic gradient:A Raman microspectroscopy and HRTEM study. Contributions to Mineralogy and Petrology, 143(1): 19-31 DOI:10.1007/s00410-001-0324-7 |
Beyssac O, Goffé B, Petitet JP, Froigneux E, Moreau M and Rouzaud JN. 2003. On the characterization of disordered and heterogeneous carbonaceous materials by Raman spectroscopy. Spectrochimica Acta Part A:Molecular and Biomolecular Spectroscopy, 59(10): 2267-2276 DOI:10.1016/S1386-1425(03)00070-2 |
Beyssac O, Bollinger L, Avouac JP and Goffé B. 2004. Thermal metamorphism in the Lesser Himalaya of Nepal determined from Raman spectroscopy of carbonaceous material. Earth and Planetary Science Letters, 225(1-2): 233-241 DOI:10.1016/j.epsl.2004.05.023 |
Beyssac O, Simoes M, Avouac JP, Farley KA, Chen YG, Chan YC and Goffé B. 2007. Late Cenozoic metamorphic evolution and exhumation of Taiwan. Tectonics, 26(6): TC6001 DOI:10.1029/2006TC002064 |
Beyssac O and Lazzeri M. 2012. Application of Raman spectroscopy to the study of graphitic carbons in the Earth Sciences. EMU Notes in Mineralogy, 12: 415-454 |
Bonijoly M, Oberlin M and Oberlin A. 1982. A possible mechanism for natural graphite formation. International Journal of Coal Geology, 1(4): 283-312 DOI:10.1016/0166-5162(82)90018-0 |
Boutoux A, Bellahsen N, Nanni U, Pik R, Verlaguet A, Rolland Y and Lacombe O. 2016. Thermal and structural evolution of the external Western Alps:Insights from(U-Th-Sm)/He thermochronology and RSCM thermometry in the Aiguilles Rouges/Mont Blanc massifs. Tectonophysics, 683: 109-123 DOI:10.1016/j.tecto.2016.06.010 |
Buseck PR and Huang BJ. 1985. Conversion of carbonaceous material to graphite during metamorphism. Geochimica et Cosmochimica Acta, 49(10): 2003-2016 DOI:10.1016/0016-7037(85)90059-6 |
Buseck PR and Beyssac O. 2014. From organic matter to graphite:Graphitization. Elements, 10(6): 421-426 DOI:10.2113/gselements.10.6.421 |
Bustin RM, Rouzaud JN and Ross JV. 1995. Natural graphitization of anthracite:Experimental considerations. Carbon, 33(5): 679-691 DOI:10.1016/0008-6223(94)00155-S |
Clerc C, Lahfid A, Monié P, Lagabrielle Y, Chopin C, Poujol M, Boulvais P, Ringenbach JC, Masini E and de St Blanquat M. 2015. High-temperature metamorphism during extreme thinning of the continental crust:A reappraisal of the North Pyrenean passive paleomargin. Solid Earth, 6(2): 643-668 DOI:10.5194/se-6-643-2015 |
Compagnini G, Puglisi O and Foti G. 1997. Raman spectra of virgin and damaged graphite edge planes. Carbon, 35(12): 1793-1797 DOI:10.1016/S0008-6223(97)00141-3 |
Cooper FJ, Hodges KV and Adams BA. 2013. Metamorphic constraints on the character and displacement of the South Tibetan Fault System, central Bhutanese Himalaya. Lithosphere, 5(1): 67-81 DOI:10.1130/L221.1 |
Cottle JM, Waters DJ, Riley D, Beyssac O and Jessup MJ. 2011. Metamorphic history of the South Tibetan Detachment System, Mt. Everest region, revealed by RSCM thermometry and phase equilibria modelling. Journal of Metamorphic Geology, 29(5): 561-582 DOI:10.1111/j.1525-1314.2011.00930.x |
d'Alessio MA, Blythe AE and Bürgmann R. 2003. No frictional heat along the San Gabriel fault, California:Evidence from fission-track thermochronology. Geology, 31(6): 541-544 DOI:10.1130/0091-7613(2003)031<0541:NFHATS>2.0.CO;2 |
de Sigoyer J, Carrier A, Wu X, Billerot A, Robert A and Pubellier M. 2008. Long-term petrological evolution of the Wenchuan and Beichuan fault zones (Longmen Shan, Sichuan). American Geophysical Union, 89(53): T33A-T2037A |
Delchini S, Lahfid A, Plunder A and Michard A. 2016. Applicability of the RSCM geothermometry approach in a complex tectono-metamorphic context:The Jebilet massif case study (Variscan Belt, Morocco). Lithos, 256-257: 1-12 DOI:10.1016/j.lithos.2016.04.007 |
Delchini S, Lahfid A, Loiselet C and Baudin T. 2017. Contribution of the RSCM geothermometry to understand the thermal history of the Variscan Jebilet massif and its ore deposits. In: Mineral Prospectivity: Current Approaches and Future Innovations. France: French Geological Survey, 48-49
|
Diessel CFK, Brothers RN and Black PM. 1978. Coalification and graphitization in high-pressure schists in New Caledonia. Contributions to Mineralogy and Petrology, 68(1): 63-78 DOI:10.1007/BF00375447 |
Dreyer DR and Bielawski CW. 2011. Carbocatalysis:Heterogeneous carbons finding utility in synthetic chemistry. Chemical Science, 2(7): 1233-1240 DOI:10.1039/c1sc00035g |
Everall NJ, Lumsdon J and Christopher DJ. 1991. The effect of laser-induced heating upon the vibrational Raman spectra of graphites and carbon fibres. Carbon, 29(2): 133-137 DOI:10.1016/0008-6223(91)90064-P |
Ferreira EHM, Moutinho MVO, Stavale F, Lucchese MM, Capaz RB, Achete CA and Jorio A. 2010. Evolution of the Raman spectra from single-, few-, and many-layer graphene with increasing disorder. Physical Review B, 82(12): 125429 DOI:10.1103/PhysRevB.82.125429 |
French BM. 1964. Graphitization of organic material in a progressively metamorphosed precambrian iron formation. Science, 146(3646): 917-918 DOI:10.1126/science.146.3646.917 |
Furuichi H, Ujiie K, Kouketsu Y, Saito T, Tsutsumi A and Wallis S. 2015. Vitrinite reflectance and Raman spectra of carbonaceous material as indicators of frictional heating on faults:Constraints from friction experiments. Earth and Planetary Science Letters, 424: 191-200 DOI:10.1016/j.epsl.2015.05.037 |
Gabalda S, Beyssac O, Jolivet L, Agard P and Chopin C. 2009. Thermal structure of a fossil subduction wedge in the Western Alps. Terra Nova, 21(1): 28-34 DOI:10.1111/j.1365-3121.2008.00849.x |
George AD, Marshallsea SJ, Wyrwoll KH, Chen J and Lu YC. 2001. Miocene cooling in the northern Qilian Shan, northeastern margin of the Tibetan Plateau, revealed by apatite fission-track and vitrinite-reflectance analysis. Geology, 29(10): 939-942 DOI:10.1130/0091-7613(2001)029<0939:MCITNQ>2.0.CO;2 |
Goswami S, Bhowmik SK and Dasgupta S. 2009. Petrology of a non-classical Barrovian inverted metamorphic sequence from the western Arunachal Himalaya, India. Journal of Asian Earth Sciences, 36(4-5): 390-406 DOI:10.1016/j.jseaes.2009.07.006 |
Grew ES. 1974. Carbonaceous material in some metamorphic rocks of New England and other areas. The Journal of Geology, 82(1): 50-73 DOI:10.1086/627936 |
He F. 2005. Raman spectroscopy studies on structure of carbon fibres. Hi-Tech Fiber & Application, 30(6): 20-25 (in Chinese with English abstract) |
Hu SY, Evans K, Craw D, Rempel K, Bourdet J, Dick J and Grice K. 2015. Raman characterization of carbonaceous material in the Macraes orogenic gold deposit and metasedimentary host rocks, New Zealand. Ore Geology Reviews, 70: 80-95 DOI:10.1016/j.oregeorev.2015.03.021 |
Huang MH, Buick IS and Hou LW. 2003a. Tectonometamorphic evolution of the Eastern Tibet Plateau:Evidence from the Central Songpan-Garzê Orogenic Belt, western China. Journal of Petrology, 44(2): 255-278 DOI:10.1093/petrology/44.2.255 |
Huang MH, Maas R, Buick IS and Williams IS. 2003b. Crustal response to continental collisions between the Tibet, Indian, South China and North China blocks:Geochronological constraints from the Songpan-Garzê Orogenic Belt, western China. Journal of Metamorphic Geology, 21(3): 223-240 DOI:10.1046/j.1525-1314.2003.00438.x |
Itaya T. 1981. Carbonaceous material in pelitic schists of the Sanbagawa metamorphic belt in central Shikoku, Japan. Lithos, 14(3): 215-224 DOI:10.1016/0024-4937(81)90043-8 |
Ito K, Ujiie K and Kagi H. 2017. Detection of increased heating and estimation of coseismic shear stress from Raman spectra of carbonaceous material in pseudotachylytes. Geophysical Research Letters, 44(2): 1749-1757 |
Jehlicka J and Rouzaud JN. 1990. Organic geochemistry of Precambrian shales and schists (Bohemian massif, Central Europe). Organic Geochemistry, 16(4-6): 865-872 DOI:10.1016/0146-6380(90)90123-H |
Kagi H, Tsuchida I, Wakatsuki M, Takahashi K, Kamimura N, Iuchi K and Wada H. 1994. Proper understanding of down-shifted Raman spectra of natural graphite:Direct estimation of laser-induced rise in sample temperature. Geochimica et Cosmochimica Acta, 58(16): 3527-3530 DOI:10.1016/0016-7037(94)90104-X |
Katagiri G, Ishida H and Ishitani A. 1988. Raman spectra of graphite edge planes. Carbon, 26(4): 565-571 DOI:10.1016/0008-6223(88)90157-1 |
Kellett DA and Grujic D. 2012. New insight into the South Tibetan detachment system:Not a single progressive deformation. Tectonics, 31(2): TC2007 DOI:10.1029/2011TC002957 |
Kisch HJ. 1980. Incipient metamorphism of Cambro-Silurian clastic rocks from the Jåmtland Supergroup, Central Scandinavian Caledonides, Western Sweden:Illite crystallinity and 'vitrinite' reflectance. Journal of the Geological Society, 137(3): 271-288 DOI:10.1144/gsjgs.137.3.0271 |
Kohn MJ, Catlos EJ, Ryerson FJ and Harrison TM. 2001. Pressure-temperature-time path discontinuity in the Main Central Thrust Zone, central Nepal. Geology, 29(7): 571-574 DOI:10.1130/0091-7613(2001)029<0571:PTTPDI>2.0.CO;2 |
Kouketsu Y, Mizukami T, Mori H, Endo S, Aoya M, Hara H, Nakamura D and Wallis S. 2014. A new approach to develop the Raman carbonaceous material geothermometer for low-grade metamorphism using peak width. Island Arc, 23(1): 33-50 DOI:10.1111/iar.12057 |
Lahfid A, Beyssac O, Deville E, Negro F, Chopin C and Goffé B. 2010. Evolution of the Raman spectrum of carbonaceous material in low-grade metasediments of the Glarus Alps (Switzerland). Terra Nova, 22(5): 354-360 DOI:10.1111/j.1365-3121.2010.00956.x |
Landis CA. 1971. Graphitization of dispersed carbonaceous material in metamorphic rocks. Contributions to Mineralogy and Petrology, 30(1): 34-45 DOI:10.1007/BF00373366 |
Laurent V, Lanari P, Naïr I, Augier R, Lahfid A and Jolivet L. 2018. Exhumation of eclogite and blueschist (Cyclades, Greece):Pressure-temperature evolution determined by thermobarometry and garnet equilibrium modelling. Journal of Metamorphic Geology, 36(6): 769-798 DOI:10.1111/jmg.12309 |
Lespade P, Marchand A, Couzi M and Cruege F. 1984. Caracterisation de materiaux carbones par microspectrometrie Raman. Carbon, 22(4-5): 375-385 DOI:10.1016/0008-6223(84)90009-5 |
Liu FL, Xu ZQ, Liou JG and Song B. 2004. SHRIMP U-Pb ages of ultrahigh-pressure and retrograde metamorphism of gneisses, south-western Sulu terrane, eastern China. Journal of Metamorphic Geology, 22(4): 315-326 DOI:10.1111/j.1525-1314.2004.00516.x |
Liu FL, Xue HM, Xu ZQ, Liang FH and Gerdes A. 2006. SHRIMP U-Pb zircon dating from eclogite lens in marble, Shuanghe area, Dabie UHP terrane:Restriction on the prograde, UHP and retrograde metamorphic ages. Acta Petrologica Sinica, 22(7): 1761-1778 (in Chinese with English abstract) DOI:10.1111/j.1365-3091.2006.00796.x |
Lucchese MM, Stavale F, Ferreira EHM, Vilani C, Moutinho MVO, Capaz RB, Achete CA and Jorio A. 2010. Quantifying ion-induced defects and Raman relaxation length in graphene. Carbon, 48(5): 1592-1597 DOI:10.1016/j.carbon.2009.12.057 |
Lünsdorf NK, Dunkl I, Schmidt BC, Rantitsch G and von Eynatten H. 2014. Towards a higher comparability of geothermometric data obtained by Raman spectroscopy of carbonaceous material. Part I:Evaluation of biasing factors. Geostandards and Geoanalytical Research, 38(1): 73-94 DOI:10.1111/j.1751-908X.2013.12011.x |
Malard LM, Pimenta MA, Dresselhaus G and Dresselhaus MS. 2009. Raman spectroscopy in graphene. Physics Reports, 473(5-6): 51-87 DOI:10.1016/j.physrep.2009.02.003 |
Mathew G, De Sarkar S, Pande K, Dutta S, Ali S, Rai A and Netrawali S. 2013. Thermal metamorphism of the Arunachal Himalaya, India:Raman thermometry and thermochronological constraints on the tectono-thermal evolution. International Journal of Earth Sciences, 102(7): 1911-1936 DOI:10.1007/s00531-013-0904-6 |
Matthews MJ, Pimenta MA, Dresselhaus G, Dresselhaus MS and Endo M. 1999. Origin of dispersive effects of the Raman D band in carbon materials. Physical Review B, 59(10): R6585-R6588 DOI:10.1103/PhysRevB.59.R6585 |
Molli G, Brovarone AV, Beyssac O and Cinquini I. 2018. RSCM thermometry in the Alpi Apuane (NW Tuscany, Italy):New constraints for the metamorphic and tectonic history of the inner northern Apennines. Journal of Structural Geology, 113: 200-216 DOI:10.1016/j.jsg.2018.05.020 |
Mori H, Wallis S, Fujimoto K and Shigematsu N. 2015. Recognition of shear heating on a long-lived major fault using Raman carbonaceous material thermometry:Implications for strength and displacement history of the MTL, SW Japan. Island Arc, 24(4): 425-446 DOI:10.1111/iar.12129 |
Mori K and Taguchi K. 1988. Examination of the low-grade metamorphism in the Shimanto belt by vitrinite reflectance. Morden Geology, 12: 325-339 |
Mortimer N. 2000. Metamorphic discontinuities in orogenic belts:Example of the garnet-biotite-albite zone in the Otago Schist, New Zealand. International Journal of Earth Sciences, 89(2): 295-306 DOI:10.1007/s005310000086 |
Nakamura Y and Akai J. 2013. Microstructural evolution of carbonaceous material during graphitization in the Gyoja-yama contact aureole:HRTEM, XRD and Raman spectroscopic study. Journal of Mineralogical and Petrological Sciences, 108(3): 131-143 DOI:10.2465/jmps.120625 |
Negro F, Beyssac O, Goffé B, Saddiqi O and Bouybaouène ML. 2006. Thermal structure of the Alboran Domain in the Rif (northern Morocco) and the Western Betics (southern Spain):Constraints from Raman spectroscopy of carbonaceous material. Journal of Metamorphic Geology, 24(4): 309-327 DOI:10.1111/j.1525-1314.2006.00639.x |
Nemanich RJ and Solin SA. 1979. First- and second-order Raman scattering from finite-size crystals of graphite. Physical Review B, 20(2): 392-401 DOI:10.1103/PhysRevB.20.392 |
Pasteris JD. 1989. In situ analysis in geological thin-sections by laser Raman microprobe spectroscopy:A cautionary note. Applied Spectroscopy, 43(3): 567-570 DOI:10.1366/0003702894202878 |
Pasteris JD and Wopenka B. 1991. Raman spectra of graphite as indicators of degree of metamorphism. The Canadian Mineralogist, 29(1): 1-9 |
Piani L, Robert F, Beyssac O, Binet L, Bourot-Denise M, Derenne S, Le Guillou C, Marrocchi Y, Mostefaoui S, Rouzaud JN and Thomen A. 2012. Structure, composition, and location of organic matter in the enstatite chondrite Sahara 97096 (EH3). Meteoritics & Planetary Science, 47(1): 8-29 |
Planeix JM, Coustel N, Coq B, Brotons V, Kumbhar PS, Dutartre R, Geneste P, Bernier P and Ajayan PM. 1994. Application of carbon nanotubes as supports in heterogeneous catalysis. Journal of the American Chemical Society, 116(17): 7935-7936 DOI:10.1021/ja00096a076 |
Rahl JM, Anderson KM, Brandon MT and Fassoulas C. 2005. Raman spectroscopic carbonaceous material thermometry of low-grade metamorphic rocks:Calibration and application to tectonic exhumation in Crete, Greece. Earth and Planetary Science Letters, 240(2): 339-354 DOI:10.1016/j.epsl.2005.09.055 |
Rantitsch G, Grogger W, Teichert C, Ebner F, Hofer C, Maurer EM, Schaffer B and Toth M. 2004. Conversion of carbonaceous material to graphite within the Greywacke Zone of the Eastern Alps. International Journal of Earth Sciences, 93(6): 959-973 DOI:10.1007/s00531-004-0436-1 |
Reed M and Simon B. 1979. Methods of Modern Mathematical Physics. Ⅲ. Scattering Theory. New York: Academic Press, 1-463
|
Robert A, Pubellier M, de Sigoyer J, Vergne J, Lahfid A, Cattin R, Findling N and Zhu J. 2010. Structural and thermal characters of the Longmen Shan (Sichuan, China). Tectonophysics, 491(1-4): 165-173 DOI:10.1016/j.tecto.2010.03.018 |
Sadezky A, Muckenhuber H, Grothe H, Niessner R and Pöschl U. 2005. Raman microspectroscopy of soot and related carbonaceous materials:Spectral analysis and structural information. Carbon, 43(8): 1731-1742 DOI:10.1016/j.carbon.2005.02.018 |
Sato K, Saito R, Oyama Y, Jiang J, Cançado LG, Pimenta MA, Jorio A, Samsonidze GG, Dresselhaus G and Dresselhaus MS. 2006. D-band Raman intensity of graphitic materials as a function of laser energy and crystallite size. Chemical Physics Letters, 427(1-3): 117-121 DOI:10.1016/j.cplett.2006.05.107 |
Scharf A, Handy MR, Ziemann MA and Schmid SM. 2013. Peak-temperature patterns of polyphase metamorphism resulting from accretion, subduction and collision (eastern Tauern Window, European Alps):A study with Raman microspectroscopy on carbonaceous material (RSCM). Journal of Metamorphic Geology, 31(8): 863-880 DOI:10.1111/jmg.12048 |
Spear FS. 1995. Metamorphic Phase Equilibria and Pressure-Temperature-Time Paths. Washington: Mineralogical Society of America, 1-799
|
Suchy V, Frey M and Wolf M. 1997. Vitrinite reflectance and shear-induced graphitization in orogenic belts:A case study from the Kandersteg area, Helvetic Alps, Switzerland. International Journal of Coal Geology, 34(1-2): 1-20 DOI:10.1016/S0166-5162(97)00018-9 |
Tagami T. 2012. Thermochronological investigation of fault zones. Tectonophysics, 538-540: 67-85 DOI:10.1016/j.tecto.2012.01.032 |
Tagiri M. 1981. A measurement of the graphitizing-degree by the X-ray powder diffractometer. The Journal of the Japanese Association of Mineralogists, Petrologists and Economic Geologists, 76(11): 345-352 DOI:10.2465/ganko1941.76.345 |
Tan Z, Agard P, Monié P, Gao J, John T, Bayet L, Jiang T, Wang XS, Hong T, Wan B and Caron B. 2019. Architecture and P-T-deformation-time evolution of the Chinese SW-Tianshan HP/UHP complex:Implications for subduction dynamics. Earth-Science Reviews, 197: 102894 DOI:10.1016/j.earscirev.2019.102894 |
Tuinstra F and Koenig JL. 1970. Raman spectrum of graphite. The Journal of Chemical Physics, 53(3): 1126-1130 DOI:10.1063/1.1674108 |
Tsu R, González HJ and Hernández CI. 1978. Observation of splitting of the E2g mode and two-phonon spectrum in graphites. Solid State Communications, 27(5): 507-510 DOI:10.1016/0038-1098(78)90382-4 |
van Zuilen MA, Fliegel D, Wirth R, Lepland A, Qu YG, Schreiber A, Romashkin AE and Philippot P. 2012. Mineral-templated growth of natural graphite films. Geochimica et Cosmochimica Acta, 83: 252-262 DOI:10.1016/j.gca.2011.12.030 |
Wada H, Tomita T, Matsuura K, Tuchi K, Ito M and Morikiyo T. 1994. Graphitization of carbonaceous matter during metamorphism with references to carbonate and pelitic rocks of contact and regional metamorphisms, Japan. Contributions to Mineralogy and Petrology, 118(3): 217-228 DOI:10.1007/BF00306643 |
Wang A, Dhamenincourt P, Dubessy J, Guerard D, Landais P and Lelaurain M. 1989. Characterization of graphite alteration in an uranium deposit by micro-Raman spectroscopy, X-ray diffraction, transmission electron microscopy and scanning electron microscopy. Carbon, 27(2): 209-218 DOI:10.1016/0008-6223(89)90125-5 |
Wang Y, Alsmeyer DC and Mccreery RL. 1990. Raman spectroscopy of carbon materials:Structural basis of observed spectra. Chemistry of Materials, 2(5): 557-563 DOI:10.1021/cm00011a018 |
Wei CJ, Zhang CG, Zhang AL, Wu TH and Li JH. 2001. Metamorphic P-T conditions and geological significance of high pressure granulite from the Jianping complex, western Liaoning Province. Acta Petrologica Sinica, 17(2): 269-282 (in Chinese with English abstract) |
Wei CJ, Wang W, Clarke GL, Zhang LF and Song SG. 2009. Metamorphism of high/ultrahigh-pressure pelitic-felsic schist in the South Tianshan Orogen, NW China:Phase equilibria and P-T path. Journal of Petrology, 50(10): 1973-1991 DOI:10.1093/petrology/egp064 |
Wopenka B and Pasteris JD. 1993. Structural characterization of kerogens to granulite-facies graphite:Applicability of Raman microprobe spectroscopy. American Mineralogist, 78(5-6): 533-557 |
Wu CM, Pan YS, Wang KY and Zhang J. 2002. A report on a biotite-calcic hornblende geothermometer. Acta Geologica Sinica, 76(1): 126-131 |
Wu CM, Xiao LL and Ni SQ. 2007. Main geothermometers and geobarometers in metapelites. Earth Science Frontiers, 14(1): 144-150 (in Chinese with English abstract) |
Wu JX, Xu H and Zhang J. 2014. Raman spectroscopy of graphene. Acta Chimica Sinica, 72(3): 301-318 (in Chinese with English abstract) DOI:10.6023/A13090936 |
Yamada R, Matsuda T and Omura K. 2007. Apatite and zircon fission-track dating from the Hirabayashi-NIED borehole, Nojima Fault, Japan:Evidence for anomalous heating in fracture zones. Tectonophysics, 443(3-4): 153-160 DOI:10.1016/j.tecto.2007.01.014 |
Yoshida K, Aoyagi N, Kato R and Hirajima T. 2016. Thermal structure of the Kebara Formation and its proximal areas in the western Kii Peninsula, SW Japan:Application of the carbonaceous material Raman geothermometry. Journal of Mineralogical and Petrological Sciences, 111(6): 398-404 DOI:10.2465/jmps.160506 |
Yui TF, Huang E and Xu J. 1996. Raman spectrum of carbonaceous material:A possible metamorphic grade indicator for low-grade metamorphic rocks. Journal of Metamorphic Geology, 14(2): 115-124 DOI:10.1046/j.1525-1314.1996.05792.x |
Zhang YH, Wu LP and Sun ZR. 2006. Progress in the application of Raman spectroscopy. Education in Chemistry, (4): 32-35 (in Chinese) |
贺福. 2005. 用拉曼光谱研究碳纤维的结构. 高科技纤维与应用, 30(6): 20-25. DOI:10.3969/j.issn.1007-9815.2005.06.005 |
刘福来, 薛怀民, 许志琴, 梁风华, Gerdes A. 2006. 大别超高压变质带的进变质、超高压和退变质时代的准确限定:以双河大理岩中榴辉岩锆石SHRIMP U-Pb定年为例. 岩石学报, 22(7): 1761-1778. |
魏春景, 张翠光, 张阿利, 伍天洪, 李江海. 2001. 辽西建平杂岩高压麻粒岩相变质作用的P-T条件及其地质意义. 岩石学报, 17(2): 269-282. |
吴春明, 肖玲玲, 倪善芹. 2007. 泥质变质岩系主要的矿物温度计与压力计. 地学前缘, 14(1): 144-150. DOI:10.3321/j.issn:1005-2321.2007.01.014 |
吴娟霞, 徐华, 张锦. 2014. 拉曼光谱在石墨烯结构表征中的应用. 化学学报, 72(3): 301-318. |
张延会, 吴良平, 孙真荣. 2006. 拉曼光谱技术应用进展. 化学教学, (4): 32-35. DOI:10.3969/j.issn.1005-6629.2006.04.014 |