2. 甘肃省矿产资源储量评审中心, 兰州 730000;
3. 中国科学院地质与地球物理研究所, 北京 100029;
4. 中山大学地球科学与工程学院, 广州 510275
2. Gansu Assessment Center of Mineral Resources Reserves, Lanzhou 730000, China;
3. Institute of Geology and Geophysics, Chinese Academy of Sciences, Beijing 100029, China;
4. School of Earth Sciences and Engineering, Sun Yat-Sen University, Guangzhou 510275, China
大洋中脊玄武岩(MORB)作为玄武岩的一个主要分类,是玄武岩中研究最为成熟的一类玄武岩,也是玄武岩地球化学构造判别基本理论建立的主要基石。前人据玄武岩主量、微量、稀土元素富集程度的不同,将MORB主要分为N-MORB(正常型洋中脊玄武岩)和E-MORB(富集型洋中脊玄武岩)两种构造类型或N-MORB、T-MORB(过渡型洋中脊玄武岩)及E-MORB三种构造类型。不同学者采用分类标准不同,而不同分类标准所得到的结果也不同(Mahoney et al., 1994; Niu et al., 2002; Foulger and Jurdy, 2007; Arevalo Jr and McDonough, 2010; Perfit et al., 2012)。有些学者分别用Rb/Nd、K/Ti、(La/Sm)N或Nb/Y-Zr/Y的关系图来区分N-MORB和E-MORB,而所用区分标准的不同,其结果也不尽相同。本文选用PetDB数据库中Spreading-Center构造环境的基性火山岩数据对目前N-MORB和E-MORB的分类标准进行简单评述。
1 N-MORB与E-MORB的对比本次研究我们选用PetDB数据库下Spreading-Center构造环境下所有基性火山岩(包括玄武岩、辉绿岩、粗玄岩等,为避免热点对扩张中心成岩的影响,删去了苦橄岩)的地球化学数据对其进行构造环境判别。此次研究分别对前人提出的N-MORB与E-MORB的7种分类方案(表 1)进行评述,依据不同标准对扩张中心所有基性喷出岩进行了分类,并对二者分布位置及其微量元素元素相关关系进行了对比。
|
|
表 1 N-MORB和E-MORB分类方案 Table 1 The classification scheme of N-MORB and E-MORB |
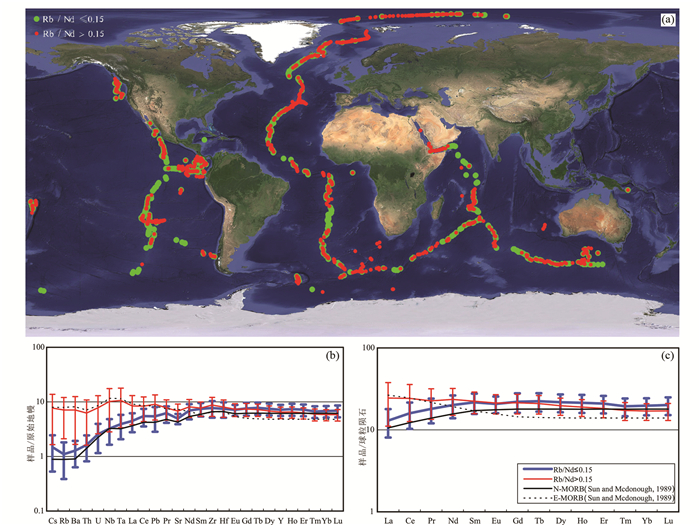
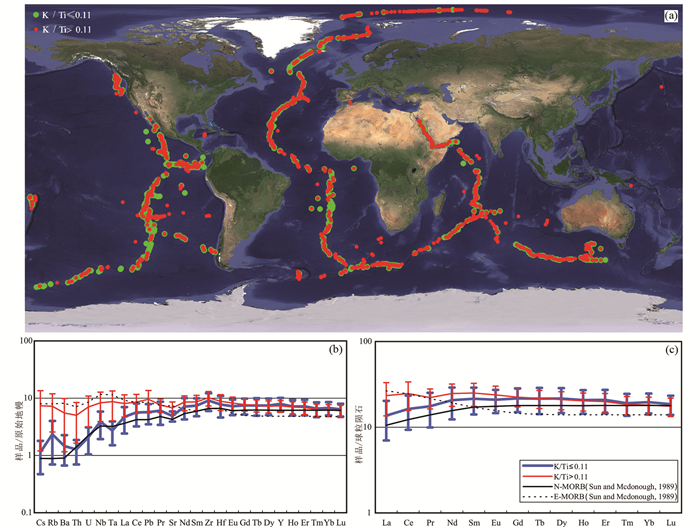
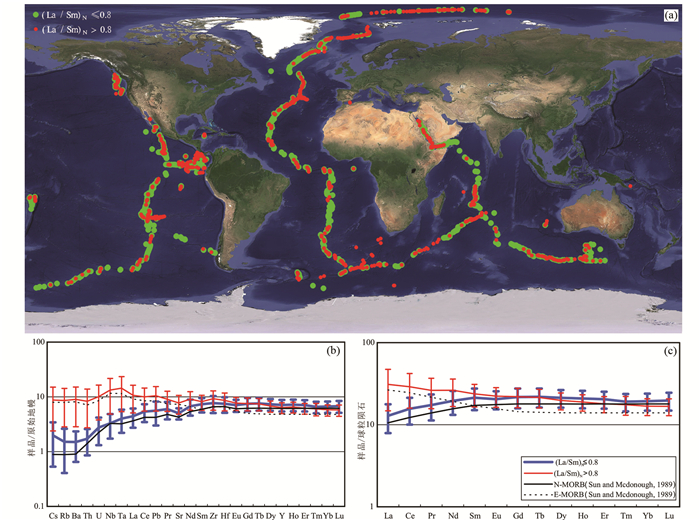
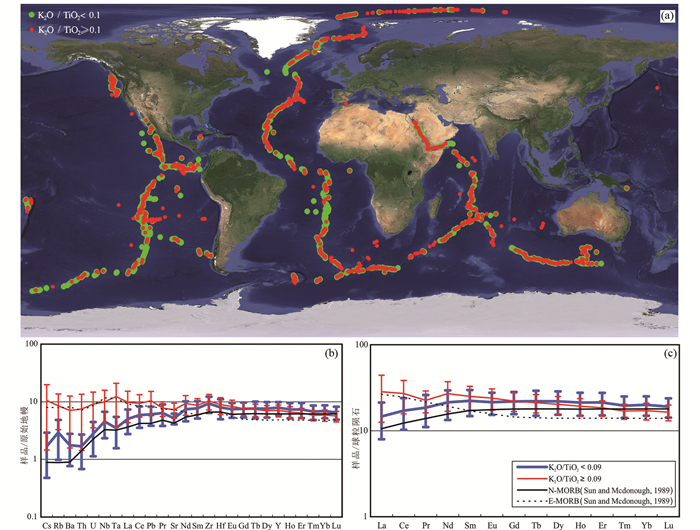
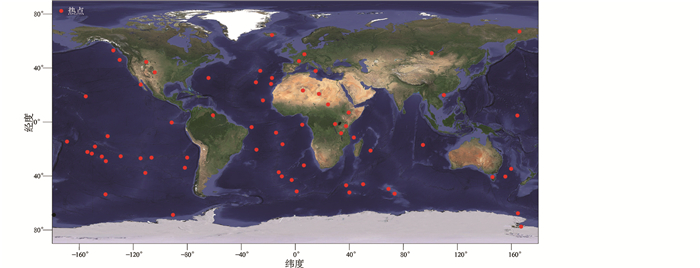
通常认为E-MORB相对于N-MORB,富集不相容元素和Nb、Ta、K2O、P2O5等、亏损重稀土元素(Schilling,1975; Sun et al., 1979; Langmuir et al., 1986; Batiza and Niu, 1992; Perfit et al., 1994; Lundstrom et al., 1999; Smith et al., 2001)。通过这些图件我们发现,不同分类方案样品分布位置均不同(图 1-图 6),但对不同分类的N-MORB与E-MORB求平均值做微量元素蛛网图和稀土元素配分图,其分布模式相近(图 1-图 6,,平均值见电子版附表 1)。因此,N-MORB和E-MORB没有一个标准的分类界限。并且将E-MORB的产出位置与热点位置进行比较,发现大多数E-MORB产出于远离热点的位置(图 7)。
|
图 1 第一类分类方案:Rb/Nd分类方案岩石样品分类图(a)、原始地幔标准化微量元素蛛网图(b)和球粒陨石标准化稀土元素配分图(c)(标准化值据Sun and McDonough, 1989) Fig. 1 The first classification scheme: Rb/Nd classification scheme MORB classification map (a), primitive mantle-normalized trace element spider diagrams (b) and chondrite-normalized REE patterns (c) (normalization values after Sun and McDonough, 1989) |
|
图 2 第二类分类方案:K/Ti分类方案岩石样品分类图(a)、原始地幔标准化微量元素蛛网图(b)和球粒陨石标准化稀土元素配分图(c) Fig. 2 The second classification scheme: K/Ti classification scheme MORB classification map (a), primitive mantle-normalized trace element spider diagrams (b) and chondrite-normalized REE patterns (c) |
|
图 3 第三类分类方案:(La/Sm)N(0.8)分类方案岩石样品分类图(a)、原始地幔标准化微量元素蛛网图(b)和球粒陨石标准化稀土元素配分图(c) Fig. 3 The third classification scheme:(La/Sm)N(0.8) classification scheme MORB classification map (a), primitive mantle-normalized trace element spider diagrams (b) and chondrite-normalized REE patterns (c) |
|
图 4 第四类分类方案:K2O/TiO2分类方案岩石样品分类图(a)、原始地幔标准化微量元素蛛网图(b)和球粒陨石标准化稀土元素配分图(c) Fig. 4 The fourth classification scheme: K2O/TiO2 classification scheme MORB classification map (a), primitive mantle-normalized trace element spider diagrams (b) and chondrite-normalized REE patterns (c) |

|
图 5 第五类分类方案:ΔNb=1.74+lg(Nb/Y)-1.92lg(Zr/Y)分类方案岩石样品分类图(a)、原始地幔标准化微量元素蛛网图(b)和球粒陨石标准化稀土元素配分图(c) Fig. 5 The fifth classification scheme: ΔNb=1.74+lg(Nb/Y) vs. 1.92lg(Zr/Y) classification scheme MORB classification map (a), primitive mantle-normalized trace element spider diagrams (b) and chondrite-normalized REE patterns (c) |

|
图 6 第七类分类方案:100K2O/TiO2分类方案岩石样品分类图(a)、原始地幔标准化微量元素蛛网图(b)和球粒陨石标准化稀土元素配分图(c)(据王金荣等,2017) Fig. 6 The seventh classification scheme: 100K2O/TiO2 classification scheme MORB classification map (a), primitive mantle-normalized trace element spider diagrams (b) and chondrite-normalized REE patterns (c) (after Wang et al., 2017) |
|
|
附表 1 全球不同分类N-MORB和E-MORB微量元素平均值表(×10-6) AppendixTable1 The average trace element compositions from the global N-MORB and E-MORB in different classifications (×10 -6) |
|
图 7 全球热点分布图 Fig. 7 The distribution of global hotspots |
我们将任意两种分类的N-MORB与E-MORB投在同一个图上,做85%置信椭圆发现,N-MORB的置信椭圆与E-MORB的置信椭圆均有较多重叠,两个N-MORB或两个E-MORB的置信椭圆中,Rb/Nd-K/Ti、La/Sm-Nb/Y、La/Sm-Zr/Y交叠率较大(图 8),对此我们将做进一步讨论。

|
图 8 两种分类的N-MORB与E-MORB散点图 Fig. 8 Two classification scheme N-MORB and E-MORB scatter diagram |
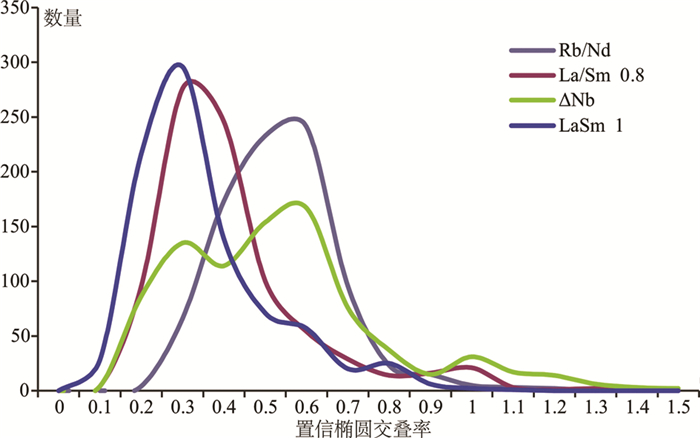
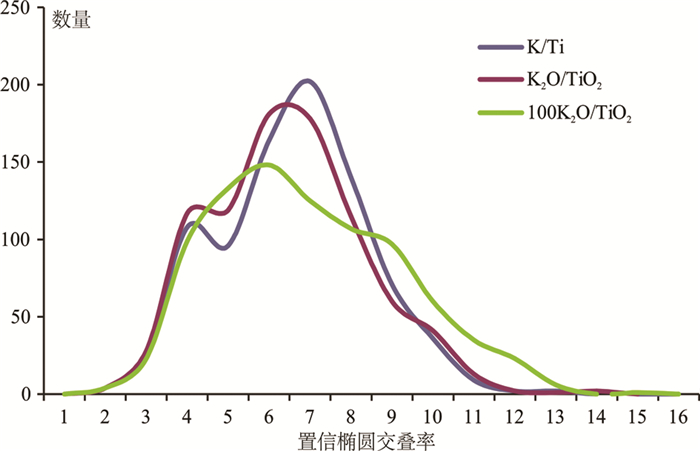
对于多种N-MORB与E-MORB的分类方案,我们对其进行了简单的评价。我们选择Ba、Cs、Hf、Nb、Sr、Ta、Zr、Y、La、Sm、Gd、Yb这13种元素(共3911个数据;见附表 1),分别对每种分类方法两两元素做对数比值,对各个分类的两种玄武岩进行投图并做85%置信度的置信椭圆,计算两个椭圆的交叠率(共得到861对)(交叠率介绍见刘欣雨等,2017),我们得出以下结果(由于以上七种分类方案中,三种用主量元素K和Ti进行分类,其余四种采用微量元素进行分类,我们将主量元素的三类和微量元素的四类分开进行讨论):
(1) 微量元素分类方案讨论
我们做了861个交叠率的频率直方图发现以(La/Sm)N=1分类方案得出的交叠率最小,且峰窄而高,因此认为该种分类方案在这四种以微量元素为判别标准的方案中最好(图 9)。
|
图 9 微量元素分类方案频率直方图 Fig. 9 Frequency histogram of trace elements classification scheme |
(2) 主量元素分类方案讨论以主量元素为判别标志的分类方案与以微量元素中Rb/Nd比值为判别标志的分类相近,区分效果较差(这可能是造成Rb/Nd-K/Ti两个同一类型置信椭圆交叠率大的原因)(图 10)。
|
图 10 主量元素分类方案频率直方图 Fig. 10 Frequency histogram of major elements classification scheme |
我们将(La/Sm)N < 1和(La/Sm)N≥1的所有数据,选取La、Ce、Pr、Nd、Sm、Eu、Gd、Tb、Dy、Ho、Er、Tm、Yb、Lu、Ba、Cs、Hf、K、Nb、Pb、Rb、Sc、Sr、Ta、Th、Ti、Tl、U、V、Y、Zr这31个元素进行两两元素配对,做对数比值投图,并计算85%置信度的置信椭圆交叠率,共得出36856个元素对组合的置信椭圆交叠率,将这些交叠率进行了统计,得出如下结论:
(1) 交叠率无负值;
(2) 交叠率分布于0~2之间,主要集中于0~0.8之间。
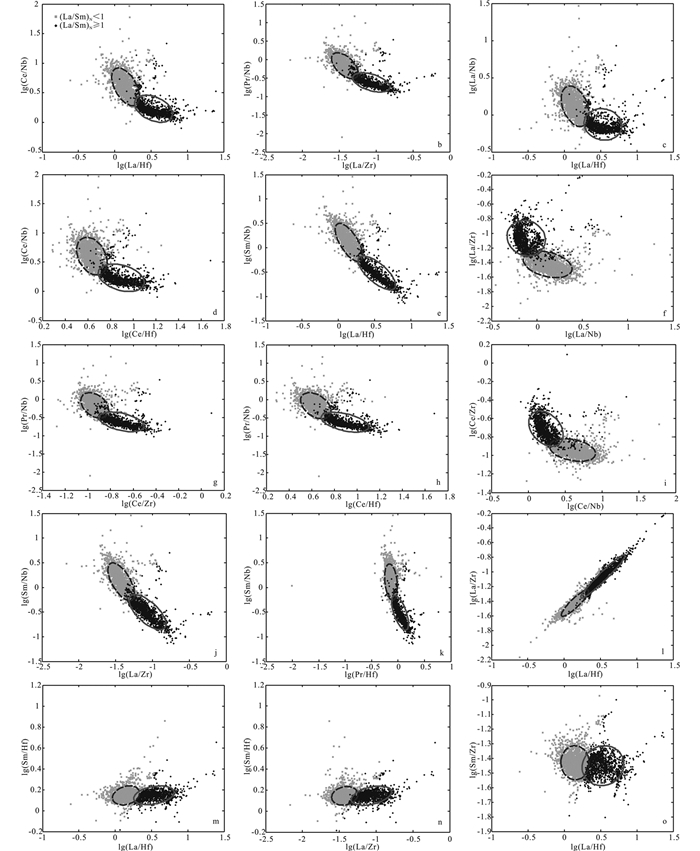
我们得出使用大离子亲石元素La、Ce、Pr、Sm和高场强元素Nb、Zr、Hf、Y之间的比值关系进行判别的效果最好。因此应考虑用以上元素之间的相关关系共同判定N-MORB与E-MORB。
我们用以上得出的8种元素,进行投图判定,发现以La为分子或以La/Hf、La/Zr元素比值作为区分标志可以得出更好的结果(图 11)。
|
图 11 以(La/Sm)N=1区分的N-MORB与E-MORB区分度较好的散点图 Fig. 11 The high dipartite degree scatter diagram of N-MORB and E-MORB distinguished by(La/Sm)N=1 |
MORB最主要的地球化学性质是什么?早先的研究大多认为,MORB中以N-MORB为主,三大洋中尤以大西洋为典型(Pearce et al., 1984)。本次研究发现,三大洋仍然以LREE亏损的MORB为主,但是,LREE富集的MORB不可忽视。本次研究表明,以LREE亏损为标志的N-MORB与早先界定的N-MORB(见各种判别图的标志)也存在巨大的差异,说明人们对N-MORB的认识与实际情况还存在不小的距离。
对E-MORB的成因已经争论很长时间了,它可能反映了源区组成及其混合程度、熔融和/或结晶分异程度以及蚀变作用的不同等(Arevalo Jr and McDonough, 2010;安屹等,2017;王金荣等,2017)。流行的观点认为,E-MORB不是独立的组分,而是富集的地幔柱与亏损的地幔组分不同程度混合的产物。但是,大量具E-MORB特征的熔岩出现在远离地幔柱的洋中脊、或慢速扩张的洋中脊以及弧后盆地构造背景。说明E-MORB与地幔柱无关,是洋脊自身的特点(Schilling,1973)。
E-MORB的成因倍受关注(Zindler and Hart, 1986;Sims and Hart, 2006)。Hofmann and Hémond (2006)指出,E-MORB通常被认为是一种非典型的富集不相容元素的MORB,不同于正常的、亏损的、“典型”的N-MORB。关于E-MORB的成因,最早发现它与热点有关,基于这一点,很多学者认为E-MORB是热点-洋中脊相互作用的结果(Sun et al., 1975;Schilling et al., 1983;Bougault et al., 1988)。后来发现,在远离热点的洋脊处E-MORB也广泛分布,有些地方甚至与N-MORB结伴而生(Kay et al., 1970;Zindler et al., 1984;Langmuir et al., 1986;Cousens et al., 1995;Niu and Hékinian,1997;Niu et al., 1999)。对此,可能的成因解释有:地幔潜能温度和部分熔融程度的不同(McKenzie and Bickle, 1988;Langmuir et al., 1992)、地幔区域性的组成差异(Le Roux et al., 2002;Meyzen et al., 2003)、水及其他流体的参与(Asimow and Langmuir, 2003)、源区的富集(Hanson and Langmuir, 1978;Donnelly et al., 2004)等。其中,源区富集、地幔不同尺度的强烈不均一性两种原因是被大多数学者所接受的解释(Zindler et al., 1984;Langmuir et al., 1986;Allan et al., 1989;Prinzhofer et al., 1989;Reynolds et al., 1992;Mahoney et al., 1994;Perfit et al., 1994;Lundstrom et al., 1999;Niu et al., 1999;Reynolds and Langmuir, 2000;Sims et al., 2002)。
2.2 N-MORB与E-MORB的区分标志王金荣等(2017)计算了以(La/Sm)N=1区分的N-MORB与E-MORB的元素地球化学含量的平均值,并与Sun and McDonough(1989)的标准N-MORB与E-MORB对比,发现二者的分布模式十分接近,但其在计算主量元素的时候没有进行校正。安屹等(2017)以同样的条件区分了N-MORB与E-MORB,但在计算主量元素的时候将Mg#校正至72,较正后分段计算了主量元素的平均值,发现E-MORB比N-MORB除了具有更高的K2O和TiO2之外,其它元素含量均较接近。
对于N-MORB与E-MORB的区分,总结前人研究成果,总共有7种分类方案,其中三种分类标准与主量元素K、Ti有关,其余四种与微量元素La、Sm、Rb、Nd、Nb、Zr、Y有关,通过上文的分析,我们得出以微量元素为标准的区分效果较以主量元素为标准的区分效果更好,并且是以(La/Sm)N=1为区分标志区分效果最好。无论何种分类方式,E-MORB中的不相容元素总体较N-MORB富集,在微量元素蛛网图中,E-MORB中Nd元素比前人认为的更为富集(Sun and McDonough, 1989)。La作为稀土元素的第一个元素,分配系数最大,其相对富集程度为N-MORB和E-MORB最典型的区分特征。我们进行了计算,发现以La为分子或以La/Hf、La/Zr元素比值作为区分标志可以得出更好的结果,并且Zr相比Hf更不相容,因此使用La/Hf的结果优于La/Zr。因此建议考虑应用以上元素之间的相关关系共同判定N-MORB与E-MORB。受地幔不均一性的影响,只用个别元素之间的相互关系去区分N-MORB与E-MORB可能会对一些样品存在误判,采用多维度的判别方式可以得到更好的区分效果,效果好的区分标志对研究二者的成因有着重要的意义。
3 结论(1) 以(La/Sm)N=1为区分标志区分N-MORB与E-MORB区分效果最好。
(2) 以原有的区分标志,加上以La/Hf、La/Zr元素比值关系可以得出更好的区分结果。
Allan JF, Batiza R, Perfit MR, Fornari DJ and Sack RO. 1989. Petrology of lavas from the lamont seamount chain and adjacent East Pacific Rise, 10°N. Journal of Petrology, 30(5): 1245-1298. DOI:10.1093/petrology/30.5.1245 |
An Y, Yang J, Chen WF, Wang JR, Zhang Q, Pan ZJ and Jiao ST. 2017. The revelation of big data:Differences between N-MORB, E-MORB and OIB and their possible causes. Chinese Journal of Geology, 52(3): 727-742. |
Arevalo Jr R and McDonough WF. 2010. Chemical variations and regional diversity observed in MORB. Chemical Geology, 271(1-2): 70-85. DOI:10.1016/j.chemgeo.2009.12.013 |
Asimow PD and Langmuir CH. 2003. The importance of water to oceanic mantle melting regimes. Nature, 421(6925): 815-820. DOI:10.1038/nature01429 |
Batiza R and Niu YL. 1992. Petrology and magma chamber processes at the East Pacific Rise~9°30'N. Journal of Geophysical Research:Solid Earth, 97(B5): 6779-6797. DOI:10.1029/92JB00172 |
Bougault H, Dmitriev L, Schilling JG, Sobolev A, Joron JL and Needham HD. 1988. Mantle heterogeneity from trace elements:MAR triple junction near 14°N. Earth and Planetary Science Letters, 88(1-2): 27-36. DOI:10.1016/0012-821X(88)90043-X |
Cousens BL, Allan JF, Leybourne MI, Chase RL and Van Wagoner N. 1995. Mixing of magmas from enriched and depleted mantle sources in the Northeast Pacific:West Valley segment, Juan de Fuca Ridge. Contributions to Mineralogy and Petrology, 120(3-4): 337-357. DOI:10.1007/BF00306512 |
Davis AS, Clague DA, Cousens BL, Keaten R and Paduan JB. 2008. Geochemistry of basalt from the North Gorda segment of the Gorda Ridge:Evolution toward ultraslow spreading ridge lavas due to decreasing magma supply. Geochemistry, Geophysics, Geosystems, 9(4): Q04004. |
Donnelly KE, Goldstein SL, Langmuir CH and Spiegelman M. 2004. Origin of enriched ocean ridge basalts and implications for mantle dynamics. Earth and Planetary Science Letters, 226(3-4): 347-366. DOI:10.1016/j.epsl.2004.07.019 |
Foulger GR and Jurdy DM. 2007. Plates, Plumes, and Planetary Processes. New York: Geological Society of America.
|
Guivel C, Lagabrielle Y, Bourgois J, Martin H, Arnaud N, Fourcade S, Cotten J and Maury RC. 2003. Very shallow melting of oceanic crust during spreading ridge subduction:Origin of near-trench Quaternary volcanism at the Chile Triple Junction. Journal of Geophysical Research:Solid Earth, 108(B7): 2345. |
Hanson GN and Langmuir CH. 1978. Modelling of major elements in mantle-melt systems using trace element approaches. Geochimica et Cosmochimica Acta, 42(6): 725-741. DOI:10.1016/0016-7037(78)90090-X |
Hofmann AW and Hémond C. 2006. The origin of E-MORB. Geochimica et Cosmochimica Acta, 70(18): A257. |
Kay R, Hubbard NJ and Gast PW. 1970. Chemical characteristics and origin of oceanic ridge volcanic rocks. Journal of Geophysical Research:Atmospheres, 75(8): 1585-1613. DOI:10.1029/JB075i008p01585 |
Langmuir CH, Bender JF and Batiza R. 1986. Petrological and tectonic segmentation of the East Pacific Rise, 5°30'~14°30'N. Nature, 322(6078): 422-429. DOI:10.1038/322422a0 |
Langmuir CH, Klein EM and Plank T. 1992. Petrological systematics of mid-ocean ridge basalts:Constraints on melt generation beneath ocean ridges. Washington, DC: AGU.
|
Le Roux PJ, Le Roex AP, Schilling JG, Shimizu N, Perkins WW and Pearce NJ. 2002. Mantle heterogeneity beneath the southern Mid-Atlantic Ridge:Trace element evidence for contamination of ambient asthenospheric mantle. Earth, Planetary Science Letters, 203(1): 479-498. DOI:10.1016/S0012-821X(02)00832-4 |
Liu XY, Zhang Q and Zhang CL. 2017. A discussion on the tectonic setting of global Cenozoic andesite. Chinese Journal of Geology, 52(3): 649-667. |
Lundstrom CC, Sampson DE, Perfit MR, Gill J and Williams Q. 1999. Insights into mid-ocean ridge basalt petrogenesis:U-series disequilibria from the Siqueiros Transform, Lamont Seamounts, and East Pacific Rise. Journal of Geophysical Research:Solid Earth, 104(B6): 13035-13048. DOI:10.1029/1999JB900081 |
Mahoney JJ, Sinton JM, Kurz MD, Macdougall JD, Spencer KJ and Lugmair GW. 1994. Isotope and trace element characteristics of a super-fast spreading ridge:East Pacific Rise, 13~23°S. Earth and Planetary Science Letters, 121(1-2): 173-193. DOI:10.1016/0012-821X(94)90039-6 |
McKenzie D and Bickle MJ. 1988. The volume and composition of melt generated by extension of the lithosphere. Journal of Petrology, 29(3): 625-679. DOI:10.1093/petrology/29.3.625 |
Meyzen CM, Toplis MJ, Humler E, Ludden JN and Mével C. 2003. A discontinuity in mantle composition beneath the Southwest Indian Ridge. Nature, 421(6924): 731-733. DOI:10.1038/nature01424 |
Niu YL and Hékinian R. 1997. Spreading-rate dependence of the extent of mantle melting beneath ocean ridges. Nature, 385(6614): 326-329. DOI:10.1038/385326a0 |
Niu YL, Collerson KD, Batiza R, Wendt JI and Regelous M. 1999. Origin of enriched-type mid-ocean ridge basalt at ridges far from mantle plumes:The East Pacific Rise at 11°20'N. Journal of Geophysical Research:Solid Earth, 104(B4): 7067-7087. DOI:10.1029/1998JB900037 |
Niu YL, Regelous M, Wendt IJ, Batiza R and O'Haraa MJ. 2002. Geochemistry of near-EPR seamounts:Importance of source vs. process and the origin of enriched mantle component. Earth and Planetary Science Letters, 199(3-4): 327-345. |
Pearce JA, Lippard SJ and Roberts S. 1984. Characteristics and tectonic significance of supra-subduction zone ophiolites. In: Kokelaar BP and Howells MF (eds. ). Marginal Basin Geology: Volcanic and Associated Sedimentary and Tectonic Processes in Modern and Ancient arginal Basins. Geological Society, London, Special Publications, 16: 77-94
|
Perfit MR, Fornari DJ, Smith MC, Bender JF, Langmuir CH and Haymon RM. 1994. Small-scale spatial and temporal variations in mid-ocean ridge crest magmatic processes. Geology, 22(4): 375. DOI:10.1130/0091-7613(1994)022<0375:SSSATV>2.3.CO;2 |
Perfit MR, Wanless VD, Ridley WI, Klein KM, Smith MC, Goss AR, Hinds JS, Kutza SW and Fornari DJ. 2012. Lava geochemistry as a probe into crustal formation at the East Pacific Rise. Oceanography, 25(1): 89-93. DOI:10.5670/oceanog |
Prinzhofer A, Lewin E and Allègre CJ. 1989. Stochastic melting of the marble cake mantle:evidence from local study of the East Pacific Rise at 12°50'N. Earth and Planetary Science Letters, 92(2): 189-206. DOI:10.1016/0012-821X(89)90046-0 |
Reynolds JR, Langmuir CH, Bender JF, Kastens KA and Ryan WBF. 1992. Spatial and temporal variability in the geochemistry of basalts from the East Pacific Rise. Nature, 359(6395): 493-499. DOI:10.1038/359493a0 |
Reynolds JR and Langmuir CH. 2000. Identification and implications of off-axis lava flows around the East Pacific Rise. Geochemistry, Geophysics, Geosystems, 1(6): 1019. |
Schilling JG. 1973. Iceland mantle plume:Geochemical study of reykjanes ridge. Nature, 242(5400): 565-571. DOI:10.1038/242565a0 |
Schilling JG. 1975. Rare-Earth variations across 'normal segments' of the Reykjanes Ridge, 60°~53°N, Mid-Atlantic Ridge, 29°S, and East Pacific Rise, 2°~19°S, and evidence on the composition of the underlying low-velocity layer. Journal of Geophysical Research: Atmospheres: 1459-1473.
|
Schilling JG, Zajac M, Evans R, Johnston T, White W, Devine JD and Kingsley R. 1983. Petrologic and geochemical variations along the Mid-Atlantic ridge from 29 Degrees N to 73 Degrees N. American Journal of Science, 283(6): 510-586. DOI:10.2475/ajs.283.6.510 |
Sims KWW, Goldstein SJ, Blichert-Toft J, Perfit MR, Kelemen P, Fornari DJ, Michael P, Murrell MT, Hart SR, DrPaolo DJ, Layne G, Ball L, Jull M and Bender J. 2002. Chemical and isotopic constraints on the generation and transport of magma beneath the East Pacific Rise. Geochimica et Cosmochimica Acta, 66(19): 3481-3504. DOI:10.1016/S0016-7037(02)00909-2 |
Sims KWW and Hart SR. 2006. Comparison of Th, Sr, Nd and Pb isotopes in oceanic basalts:Implications for mantle heterogeneity and magma genesis. Earth and Planetary Science Letters, 245(3-4): 743-761. DOI:10.1016/j.epsl.2006.02.030 |
Smith MC, Perfit MR, Fornari DJ, Ridley WI, Edwards MH, Kurras GJ and Von Damm KL. 2001. Magmatic processes and segmentation at a fast spreading mid-ocean ridge:Detailed investigation of an axial discontinuity on the East Pacific Rise crest at 9°37'N. Geochemistry, Geophysics, Geosystems, 2(10): 1040. |
Sun SS, Tatsumoto M and Schilling JG. 1975. Mantle plume mixing along the reykjanes ridge axis:Lead isotopic evidence. Science, 190(4210): 143-147. DOI:10.1126/science.190.4210.143 |
Sun SS, Nesbitt RW and Sharaskin AY. 1979. Geochemical characteristics of mid-ocean ridge basalts. Earth, Planetary Science Letters, 44(1): 119-138. DOI:10.1016/0012-821X(79)90013-X |
Sun SS and McDonough WF. 1989. Chemical and isotopic systematics of oceanic basalts:implications for mantle composition and processes. In:Saunders AD and Norry J (eds.). Magmatism in the Ocean Basins. Geological Society, London, Special Publications, 42(1): 313-345. DOI:10.1144/GSL.SP.1989.042.01.19 |
Wang JR, Chen WF, Zhang Q, Jiao ST, Yang J, Pan ZJ and Wang SH. 2017. Preliminary research on data mining of N-MORB and E-MORB:Discussion on method of the basalt discrimination diagrams and the character of MORB's mantle source. Acta Petrologica Sinica, 33(3): 993-1005. |
Zindler A, Staudigel H and Batiza R. 1984. Isotope, trace element geochemistry of young Pacific seamounts:implications for the scale of upper mantle heterogeneity. Earth and Planetary Science Letters, 70(2): 175-195. DOI:10.1016/0012-821X(84)90004-9 |
Zindler A and Hart SR. 1986. Chemical geodynamics. Annual Review of Earth and Planetary Sciences, 14(1): 493-571. DOI:10.1146/annurev.ea.14.050186.002425 |
安屹, 杨婧, 陈万峰, 王金荣, 张旗, 潘振杰, 焦守涛. 2017. N-MORB、E-MORB和OIB的区别及其可能的原因:大数据的启示. 地质科学, 52(3): 727-742. DOI:10.12017/dzkx.2017.046 |
刘欣雨, 张旗, 张成立. 2017. 全球新生代安山岩构造环境有关问题探讨. 地质科学, 52(3): 649-667. DOI:10.12017/dzkx.2017.042 |
王金荣, 陈万峰, 张旗, 焦守涛, 杨婧, 潘振杰, 王淑华. 2017. N-MORB和E-MORB数据挖掘—玄武岩判别图及洋中脊源区地幔性质的讨论. 岩石学报, 33(3): 993-1005. |
 2018, Vol. 34


