 2018, Vol. 34


2. 中国科学院地球科学研究院, 北京 100029;
3. 中国科学院大学, 北京 100049;
4. 同济大学海洋与地球科学学院, 海洋地质国家重点实验室, 上海 200092
2. Institutions of Earth Science, Chinese Academy of Sciences, Beijing 100029, China;
3. University of Chinese Academy of Sciences, Beijing 100049, China;
4. State Key Laboratory of Marine Geology, School of Ocean and Earth Science, Tongji University, Shanghai 200092, China
岩浆底侵(magmatic underplating)作为一种非构造作用,在大陆地壳的形成、增生和演化过程中起着重要作用(Cox, 1993; Fyfe, 1992; Rudnick, 1990; Gao et al., 1998)。一般认为,底侵作用是地幔部分熔融产生的基性岩浆侵入到地壳底部冷却就位的过程(Fountain, 1989; Thybo and Artemieva, 2013)。数值模拟方法是研究地壳底侵及其热-流变学效应的重要手段。例如,Furlong and Fountain (1986)探讨了岩浆的潜温-侵位深度和底侵厚度之间的关系,以及底侵在不同岩石组成和温度条件下的地震波速范围。Liu and Furlong (1994)利用二维模型研究了底侵对于岩石圈热结构和流变强度的影响。王岳军等(2002)利用数值模拟探究了湖南印支期过铝质花岗岩的形成与地壳底侵之间的关系。Wangen (2011)利用数值和解析方法分析了底侵作用的热影响,并给出了估算地表热流达到最大值与对应时间的计算公式。
在涉及岩浆活动的地球动力学模型中,地幔熔融函数对于模拟结果的可靠性至关重要。地幔熔融函数给出了地幔在不同温度、压力、含水量、组分等情况下的熔融百分数,它直接影响温度分布、底侵厚度等(Gerya and Burg, 2007)。底侵作用广泛出现在各种构造背景中(Thybo and Artemieva, 2013)。不同的构造环境,如地幔柱(Wallace, 1998)、俯冲带之上的地幔楔、洋岛玄武岩和洋中脊玄武岩源区等,地幔的含水量不同(Hirschmann, 2006),而幔源岩浆含水量会显著影响岩浆的熔融行为(Katz et al., 2003; Lee and Chin, 2014)。McKenzie and Bickle (1988)把幔源岩浆从深部上升到地壳的过程看成是等熵上升过程,并根据地球化学数据给出了石榴子石橄榄岩在不同温压条件下的熔融百分数。Iwamori et al. (1995)利用一维模型描述了幔源岩浆在稳态等熵上升过程中的熔融百分数。Katz et al. (2003)综合考虑了不同温度、压力、含水量和组分对地幔熔融百分数的影响。然而,已有的关于地壳底侵的数值模型很少综合考虑幔源岩浆含水量、侵入岩浆规模和温度对岩石圈流变性的影响,尤其是岩浆底侵引起地壳垂向生长过程中的热-流变学效应,仍有待深入探讨。
为此,本文采用考虑地幔含水量的、更加逼近实际情况的地幔熔融函数(Katz et al., 2003),基于二维热传导数值模型,模拟不同规模岩浆底侵的热-流变学效应,定量测试幔源岩浆潜温和含水量对底侵厚度的影响。最后,基于现有的岩石地球化学分析和地球物理探测结果提供的约束,将上述模型应用于峨眉山大火成岩省(Emeishan Large Igneous Province, 简称ELIP),探讨ELIP地壳底侵的地表热流随时间演化,以及岩浆初始熔融深度、潜温等。
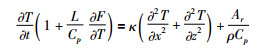
1 方法 1.1 控制方程 1.1.1 热传导方程幔源岩浆侵入地壳底部,一方面它自身逐渐冷却、结晶,另一方面它与围岩会发生热交换(Marsh, 1982)。这些物理过程,可以利用带有相变潜热项的热传导方程来近似描述(Gerya and Burg, 2007; Liu and Chase, 1991; Liu and Furlong, 1994):
|
(1) |
方程(1)中

|
图 1 岩浆底侵的模型设计 左侧显示了模型范围、分层设计以及幔源岩浆上升至莫霍面附近形成的侵入体形状.右侧显示了2D模型中央(0km处)纵剖面所对应的固相线(Ts)、液相线(Tl)以及初始温度分布(T) Fig. 1 Model setup for modeling magmatic underplating The left side shows the initial configuration of the model, where the red hexagon indicates magmatic underplating at the base of the crust. The right side shows typical temperature profiles. The blue, red and green lines indicate the mantle solidus (Ts), mantle liquidus (Tl) and initial temperature profile (T) beneath the center of the model (x=0km), respectively |
|
|
表 1 参数对应符号、取值和单位 Table 1 Notations, values and units of the parameters used in this study |
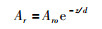
假设放射性生热随着深度增加而呈指数式减小(Turcotte and Schubert, 2002),即:
|
(2) |
其中,Aro为地表放射性生热率(表 2),d为放射性元素分布的特征深度(表 1)。
|
|
表 2 模型的物性参数 Table 2 Parameters of the earth model used in this study |
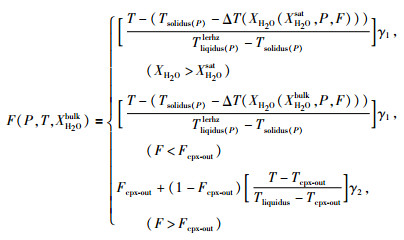
水对地幔的熔融程度影响很大(Hirth and Kohlstedt, 1996)。对于地幔的熔融,采用Katz et al. (2003)提出的含水地幔模型,该模型基于大量实验数据获得,已被广泛应用于地幔熔融的计算中(Hirschmann, 2006; Kelley et al., 2006)。根据单斜辉石是否完全熔融以及含水是否饱和,地幔熔融百分数分为三段(Katz et al., 2003):
|
(3) |
其中,XH2O为熔融物质中水的重量百分比,XH2Obulk为总的水的重量百分比,XH2Osat为饱和时水的重量百分比,Tsolidus(P)为地幔固相线温度,Tliqidus(P)lerhz为二辉橄榄岩液相线温度,ΔT为由含水引起的温度变化,Fcpx-out为单斜辉石完全熔融时的熔融百分数,Tcpx-out为单斜辉石完全熔融时的温度,γ1和γ2为熔融函数指数(见表 1)。
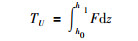
底侵厚度(TU)可由熔融百分数在深度上的积分得到:
|
(4) |
其中,h0为岩浆侵入体的底界面深度;h1为岩浆侵入体的顶界面深度。
在模拟中,我们假设岩石密度随温度和压力变化(Gerya, 2010):

|
(5) |
其中,ρ0对应温度为T0(298K),压力为P0(0.1MPa)条件下的岩石密度,α为热膨胀系数,β为压缩系数(表 1)。
当地幔发生部分熔融时,其密度由固体部分和熔融部分的密度加权平均计算得到(Chen and Gerya, 2016):

|
(6) |
其中,ρsolid为部分熔融体中的固相密度,ρmolten为液相密度。
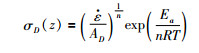
1.1.3 流变本构关系为了定量评价岩浆底侵的热-流变效应,我们采用静态流变本构关系(应变速率为常数)来计算岩石圈强度。岩石的韧性强度(σD)与温度之间存在密切的关系,由下式给出(Brace and Kohlstedt, 1980; Kirby, 1983):
|
(7) |
其中,σD是韧性变形引起的偏应力,即韧性强度,
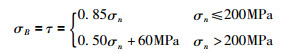
脆性强度与温度无关,可由以下经验公式确定(Byerlee, 1978):
|
(8) |
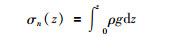
其中,τ为剪应力,σn为正应力,σB为脆性强度。假设裂隙和滑动可以发生在任意方向,σn可视为上覆岩层压力,其随深度增加而线性增加(Liu and Furlong, 1993):
|
(9) |
岩石最终的屈服强度取决于脆性强度和韧性强度二者间的最小值(Burov, 2011; Karato, 2010):

|
(10) |
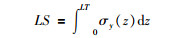
将屈服强度沿岩石圈深度方向积分,即可得到岩石圈的总体强度LS(Burov, 2011):
|
(11) |
其中σy是屈服强度,LT是岩石圈厚度。
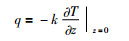
1.1.4 地表热流地表热流可由下式计算得到:
|
(12) |
其中q为热流,T为温度,k为热导率(表 2)。
1.2 模型设计二维热传导模型的深度范围设定为从岩石圈底部到地表,模型宽度设定为600km(图 1)。岩石圈厚度设定为110km,并根据Hacker et al. (2011)的地壳模型,将地壳分成上、下两部分,其中上地壳厚度14km,下地壳厚度26km。为了简单起见,假设岩石圈初始温度分布是线性的(Gerya and Burg, 2007),其中地表温度为0℃,岩石圈底部温度为1350℃。地表和岩石圈底部边界均设定为等温边界,模型左、右边界设定为绝热边界。计算过程中,用温度扰动来表征岩浆的底侵(初始温度扰动在深度上的分布尺度,定义为初始侵入厚度),且将底侵形状简单地设为中心位于莫霍面的六边形。具体的模型参数详见表 1。
2 模拟结果我们利用有限差分法对二维热传导方程(1)进行求解(网格大小为1km×1km),计算底侵引起的岩石圈热-流变学响应;通过改变幔源岩浆的潜温和含水量,定量测试它们对底侵厚度形成的影响。
2.1 底侵引起的岩石圈热-流变学响应图 2显示了不同厚度幔源岩浆底侵引起的温度扰动随时间的演化。其中,图 2a-d所示对应初始侵入厚度为5km,图 2e-h对应初始侵入厚度为20km(给定参考模型的底侵层中心深度为40km,假设地幔和侵入岩浆不含水、初始侵入温度为1300℃,其它模型参数与图 1所示相同)。由图 2a-d可知,在初始侵入厚度为5km的情况下,经历1Myr侵入体中心温度扰动仅维持在300℃左右;经历10Myr侵入体中心的温度扰动小于100℃;经历50Myr,热扰动已基本耗散殆尽。由图 2e-h可知,在初始侵入厚度达到20km的情况下,经历1Myr后,除侵入体边缘的温度有所下降外,侵入体中心区域的温度仍旧维持与初始时刻一致;经历10Myr后,高温逐渐向围岩扩展耗散,中心的温度扰动降至400℃左右;经历50Myr后,中心仍可维持130℃左右的温度扰动;经历150Myr后,参考模型的温度扰动不再明显,与背景温度场接近。总体上,侵入厚度越大,温度扰动时间持续越长,这表明幔源岩浆侵入厚度是控制温度扰动持续时间的关键因素。

|
图 2 幔源岩浆底侵引起的温度扰动(温度场减去背景温度场)随时间的演化 考虑横向对称性,这里只显示正半轴部分. (a-d) 5km层厚的幔源岩浆底侵引起的温度扰动;(e-h) 20km层厚的幔源岩浆底侵引起的温度扰动. (a-h)右侧为温度扰动曲线,不同颜色曲线所对应的剖面位置(A、B、C),标记在左侧2D温度扰动分布图上.其中,A、B、C对应的横坐标位置,分别为0km(底侵中心)、75km(底侵过渡部位)、100km(底侵边缘).除侵入体厚度不同外,其它模型参数同图 1所示 Fig. 2 The temporal evolution of the temperature perturbation resulted from magmatic intrusion Considering bilateral symmetry of the model, only the right half is shown here. (a-d) show the evolution of the thermal perturbation caused by a 5km-thick magmatic underplating, while (e-h) show the cases for a 20km-thick magmatic underplating. The curves at each snapshot show the temperature perturbation profiles at different locations along the model, where A (red) indicates the profile situated at the center of the magmatic intrusion (i.e., x=0km), B (green) indicates the profile at the transition zone of the magmatic intrusion (x=75km), and C (blue) indicates the profile at the edge of the magmatic intrusion (x=100km). The gray curve shows the temperature perturbation at the model center at the onset of magmatic underplating. The other parameters are identical to those in Fig. 1 except for initial thickness of magmatic underplating |
图 3显示了初始侵入厚度为20km,分别经历5Myr、50Myr、250Myr后位于模型中央(横坐标0km)处的屈服应力包络随深度的变化情况。在岩浆未侵入的初始时刻(即正常地壳,岩浆底侵尚未发生),下地壳底部(对应深度25~40km)屈服应力呈现低值(如图 3a中蓝线所示)。经历5Myr后,侵入岩浆的高温迅速扩散到上覆地壳和下伏地幔,造成大于20km深度部分的屈服应力的显著减小(图 3a中红线所示)。经历50Myr后,由于底侵引起的温度扰动不再明显(图 2g),底侵层的上半部分(对应深度30~40km),由于持续冷却而引起该部分屈服应力逐渐恢复(图 3b)。经历250Myr后,原始地壳部分的屈服应力已恢复到初始状态,但整个底侵层(30~50km)呈现高值(图 3c),表明岩浆冷却后岩石强度增强,且底侵部位最终表现为脆性。

|
图 3 模型中央(横坐标0km位置处)屈服应力包络的深度分布随时间演化 其中,由左至右,红色实线分别代表幔源岩浆侵入后5Myr、50Myr、250Myr模型中央岩石圈屈服应力随深度的变化情况.初始侵入厚度为20km,初始侵入温度为1300℃,UC代表上地壳,LC代表下地壳,MI代表底侵层,LM代表岩石圈地幔 Fig. 3 Temporal evolution of the yield stress envelope (YSE) at the center of the model (x=0km) The blue dashed and red solid curves indicate YSE before and after magmatic intrusion, respectively. (a) 5Myr since magmatic intrusion; (b) 50Myr since magmatic intrusion; and (c) 250Myr since magmatic intrusion. The initial thickness of magmatic intrusion is 20km, and its initial temperature is 1300℃. UC, upper crust; LC, lower crust; MI, magmatic intrusion; LM, lithospheric mantle |
图 4显示了初始侵入厚度为20km,分别经历0.1Myr、6.5Myr、50Myr、150Myr、250Myr后,横向上不同位置岩石圈总体强度的随时间演化。在岩浆未侵入的初始时刻,岩石圈强度在横向上保持一致。经历0.1Myr后,底侵层所在的地段(横坐标-100~100km)的岩石圈强度迅速降低(初始值的45%左右,图 4中蓝线所示),并在6.5Myr左右达到最低值(初始值的15%左右,图 4中红线所示)。之后,底侵层所在地段的岩石圈强度逐渐恢复;大约经历150Myr,底侵所在地段的岩石圈强度已恢复到初始值(图 4中黑线所示)。经历250Myr后,底侵引起的温度扰动已完全消失,底侵所在地段的岩石圈强度较正常岩石圈强度高出10%左右(图 4中黄线所示)。

|
图 4 横向上不同位置岩石圈总体强度随时间的演化 考虑横向对称性,这里只显示正半轴部分;初始侵入厚度为20km,初始侵入温度为1300℃ Fig. 4 Temporal evolution of the lithospheric bulk strength Considering bilateral symmetry of the model, only the right half is shown here. The initial thickness of magmatic intrusion is 20km, and its initial temperature is 1300℃ |
我们对幔源岩浆初始侵入温度、含水量和初始侵入厚度进行系统测试,以定量地探讨这些参数对底侵厚度的影响。温度测试范围为1200~1700℃,含水量测试范围为0~0.3%,初始侵入厚度测试范围为20~50km。其中某两个参数在测试范围内变化时,第三个参数的取值固定(含水量为0,温度为1300℃,初始侵入厚度为20km,初始侵入横向尺度为200km)。
图 5a给出了幔源岩浆含水量-初始侵入温度对底侵厚度的影响。由图 5a可见,底侵厚度的分隔线斜率较小,表明温度对底侵厚度的影响比含水量的影响要大得多,单一地增加侵入岩浆的含水量并不能显著增加底侵厚度。例如,侵入岩浆温度低于1450℃,即使地幔含水量增加到0.3%(已经是非常高的值),也不能使底侵厚度超过10km。图 5b给出了幔源岩浆含水量-初始侵入厚度对底侵厚度的影响。由图 5b可见,在温度一定的条件下,侵入岩浆的含水量对底侵厚度的形成也具有重要影响。例如,在含水量小于0.05%的情况下,即使岩浆初始侵入厚度达到50km,也很难形成厚度超过10km的地壳底侵。图 5c给出了幔源岩浆侵入温度-初始侵入厚度对底侵厚度的影响。由图 5c可见,底侵厚度的分隔线斜率很大,结合图 5a,进一步指示了岩浆的初始侵入温度对底侵厚度形成的重要影响。

|
图 5 幔源岩浆的温度、含水量和初始侵入厚度对底侵厚度的影响 (a)岩浆侵入温度-含水量对底侵厚度的影响;(b)含水量-初始侵入厚度对底侵厚度的影响;(c)岩浆侵入温度-初始侵入厚度对底侵厚度的影响.每一个符号均对应一个测试模型.不同符号、不同颜色区域分别对应薄底侵(底侵厚度 < 10km)、中等底侵(底侵厚度10~15km)和厚底侵(底侵厚度>15km) Fig. 5 Influences of magmatic temperature, water content and initial thickness of magmatic intrusion on the crustal underplating thickness (a) influences of magmatic temperature and water content on underplating thickness; (b) influences of magmatic water content and initial intrusion thickness on underplating thickness; (c) influences of magmatic temperature and initial thickness of magmatic intrusion on underplating thickness. Each symbol represents a testing model. The blue triangles, red circles and green crosses indicate thin (< 10km), intermediate (10~15km) and thick (>15km) crustal underplating, respectively |
在我国西南滇-川-黔地区,即扬子克拉通西缘,地表出露大面积二叠纪玄武岩,被地质学界命名为峨眉山大火成岩省(ELIP),它是我国境内第一个获得国际学术界广泛认可的大火成岩省,也是全球研究程度较高的大陆溢流玄武岩省之一(陈赟等, 2017)。地球化学家根据沉积地层学揭示的下伏茅口灰岩的剥蚀程度,将峨眉山大火成岩省分为内带、中带和外带(图 6a),并提出了内带下方“地幔柱头熔融”成因模型(Xu et al., 2004)。综合地球物理剖面探测揭示出ELIP内带地壳的底部存在一个横向尺度长达约180km、厚达15~20km的高密度、高波速、高波速比的异常体,推测为二叠纪古地幔柱作用形成的岩浆底侵层(Chen et al., 2015; 徐涛等, 2015; Deng et al., 2015; 陈赟等, 2017; 郭希等, 2017; 如图 6b)。此外,徐义刚和钟孙霖(2001)通过分异熔融反演模型(McKenzie and O’nions, 1991)进行了稀土元素反演计算,确定ELIP岩浆潜温高达1550℃左右。Dixon et al. (2002)的研究结果表明,地幔柱源区岩浆的含水量在0.03%~0.1%之间。上述研究为ELIP底侵层的位置、规模,以及物性特征等提供了定量约束。在图 1所示模型的基础上,构建新的数值模型(初始侵入体温度设为1550℃、含水量设为0.05%,侵入体形状不变,但侵入体主体部分的横向尺度扩大至200km,过渡部分的横向尺度仍设为50km,侵入体厚度和模型的其他参数保持不变),来探讨ELIP地壳底侵产生的地表热流响应以及幔源岩浆潜温、初始熔融深度等。

|
图 6 综合地球物理深部探测揭示的峨眉山大火成岩省(ELIP)岩浆底侵的位置和规模 (a)综合地球物理探测剖面位置(据Chen et al., 2015修改).右上角插图显示了探测剖面的大地构造位置;绿色所示为二叠纪峨眉山玄武岩的地表出露情况;橙色虚线所示为内带-中带-外带的分区界线(He et al., 2003);(b)剖面下方的地壳结构.地壳分为上地壳(约20km),下地壳(约20~50km)两层;内带下地壳底部,存在底侵层,横向尺度约180km,厚度约15~20km,Vp约为7.0~7.2km/s(徐涛等, 2015),Vs约为3.8~4.2km/s(郭希等, 2017),密度约为3.14g/cm3(Deng et al., 2016) Fig. 6 Comprehensive geophysical investigation revealing details of crustal underplating beneath the ELIP (modified after Chen et al., 2015) (a) digital elevation map of the ELIP region showing the location of the comprehensive geophysical profiles and the distribution of the Permian basalt and its zonation. The inset at the upper right corner shows the locations of the geophysical profiles on a regional scale. The zonation of the Permian basalt is derived from He et al. (2003); (b) crustal structure beneath the profiles. The crust is composed of an upper portion (~20km thick) and a lower portion (20~50km thick). A crustal underplating layer is inferred from comprehensive geophysical investigation. It has a width of ~180km and thicknesses of 15~20km, and is characterized by high Vp (7.0~7.2km/s, Xu et al., 2015), high Vs (3.8~4.2km/s, Guo et al., 2017) and high density (~3.14g/cm3, Deng et al., 2016) |
图 7给出了模拟得到的ELIP地表热流随时间的演化。结果显示,幔源岩浆侵入地壳底部15Myr后,底侵层正上方(A-B段)的地表热流出现峰值,达到约115mW/m2(图 7a);然后进入热流急剧耗散阶段,经历50Myr后热流耗散梯度逐渐减小;经历100~150Myr后,底侵层上方和边缘部位的热流趋于一致,接近正常大地热流值40mW/m2左右(图 7b)。在横向上,岩浆底侵除对所在部位的大地热流有较大影响外,对其他部位基本没有影响。值得提及的是,由于本文仅仅考虑的是“底侵(underplating)”的热效应,而没有考虑“内侵(intraplating)”(底侵之后岩浆继续分异、迁移上升直至喷出地表之前的物理-化学过程)对上地壳组分和结构改造而导致的地壳生热率的变化(Furlong and Chapman, 2013; Chen et al., 2015; 陈赟等, 2017),因此上述讨论仅适用于高温岩浆以热传导机制为主导的多数阶段,对于岩浆的喷出和溢流,以及底侵岩浆冷却后的地表热流演化不再具有参考意义。

|
图 7 模型预测的ELIP地表热流随时间的演化 (a)地表热流分布随时间的演化;(b)不同部位的地表热流随时间的演化. A, B, C分别对应x=0km(底侵层中央),x=100km(底侵层主体右边缘),x=150km(底侵层过渡部位右边缘) Fig. 7 Temporal evolution of the model-predicted surface heat fl (a) heat flow evolution along the right-side surface of the model; (b) surface heat flow evolution at typical localities, including locations at the center (A, x=0), the right edge of the main body (B, x=150km) and the right edge of the transition zone (C, x=150km) of the magmatic intrusion |
朱传庆等(2010)利用石油钻井的镜质体反射率资料,采用古热流恢复方法,研究了四川盆地(见图 6a,绝大部分位于ELIP外带)的热流史,结果显示:四川盆地在259Ma左右出现热流峰值(多数钻井的最高古热流在60~80mW/m2之间,少数超过了100mW/m2),且在时间上与ELIP的峰期年龄(Zhong et al., 2014)具有较好的一致性。何丽娟等(2011)模拟研究了地幔柱活动对岩石圈热状态的影响,结果显示:地幔柱活动对上方的岩石圈热状态具有很大的影响,中心地区热流可达到100mW/m2,持续60~80Myr后逐渐消除;但影响范围主要集中于地幔柱头上方(内带),对四川盆地所处的外带及更远地区影响甚微。蒙伟娟等(2015)模拟研究了地幔柱与岩石圈相互作用的过程,研究结果显示:地幔柱与岩石圈相互作用的方式呈现阶段性,经历0.26Myr后,地幔柱对岩石圈由纵向作用转变为横向作用,岩石圈发生剪切伸展变形,当剪切伸展变形达到一定程度,中带和外带的岩石圈底部会出现拆沉作用。从本文的研究结果来看,如果与ELIP形成有关的大规模岩浆作用仅局限于内带的话,则它的影响范围不会波及到四川盆地所在的外带。综合考虑四川盆地热流峰值时间与ELIP峰期年龄吻合,且四川盆地位于ELIP的外带,据此推测,四川盆地259Ma对应的高热流可能与地幔柱与岩石圈相互作用形成的区域横向剪切伸展,以及峨眉山玄武岩短时巨量喷发所形成的大面积溢流有关。
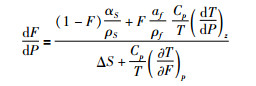
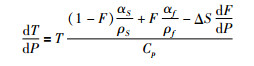
3.2 产生ELIP地壳底侵的幔源岩浆属性为了进一步约束侵入岩浆的熔融深度,假设高温幔源岩浆从深部以足够快的速率上升,忽略上升过程中它与围岩的热量交换,即近似视为等熵上升的过程。此时,对于岩浆中的固相(残留固体)和熔融相(熔体)组成的两相系统,F-T-P有如下关系(Katz et al., 2003):
|
(13) |
|
(14) |
其中ΔS是熵增,αS、ρS分别是固体热膨胀系数和密度,αf、ρf分别是液体热膨胀系数和密度(见表 1)。
将上式(13, 14)由指定的压力(对应深度h0)和温度沿深度方向向上同时积分,即可得到岩浆上升过程对应的温度、熔融百分数随深度的变化。当幔源岩浆的温度尚未达到固相线时,其温度变化沿着绝热线上升,潜温保持不变;当其温度超过固相线时,产生部分熔融。最终形成的底侵厚度,可按公式(4)计算得到,此时,式中h0为幔源岩浆初始熔融深度;而h1为岩浆开始堆积的深度,对地壳底侵而言,假设熔体100%在地壳底部形成堆积,则h1对应莫霍面深度(Furlong and Fountain, 1986)。
图 8显示了含水量分别为0.03%(图 8a, b)和0.05%(图 8c, d)情况下,不同潜温(1300~1570℃)的幔源岩浆的初始熔融深度和最终在地壳底部形成的底侵厚度。由图 8可知,温度会明显地影响岩浆的初始熔融深度,初始熔融深度越大,最终形成的底侵厚度也越大。反过来,可通过底侵厚度大致约束一定含水量条件下的岩浆潜温和初始熔融深度。总体而言,如果底侵厚度超过15km,在幔源岩浆含水量为0.03%~0.05%的情况下,则意味着岩浆的潜温超过1500℃,初始熔融深度超过200km。

|
图 8 幔源岩浆含水量、潜温与地壳底侵厚度的关系 (a)含水量为0.03%情况下,幔源岩浆上升过程中的温度变化(不同颜色曲线对应不同潜温,具体温度见相应颜色数字所示);(b)含水量为0.03%情况下,不同的初始熔融深度对应形成的底侵厚度(不同颜色曲线对应不同的初始熔融深度,具体深度见相应颜色数字所示);(c)、(d)含义与(a)、(b)相同,但对应含水量为0.05% Fig. 8 Relations of magmatic water content and potential temperature with crustal underplating thickness (a) computed temperature-depth paths for varying magmatic potential temperature. In this case, magmatic water content is set to 0.03%; (b) model-predicted thickness of crustal underplating as a function of depth for different magmatic potential temperatures; (c) the same as (a) but with a water content of 0.05%; (d) the same as (b) but with a water content of 0.05% |
幔源岩浆底侵是壳幔相互作用的基本形式之一,在板缘和板内的各种构造环境下均可以发生,是地壳实现垂向生长的重要途径。诸如ELIP这样的大火成岩省,大面积出露于地表的溢流玄武岩,是地下深部曾经发生大规模岩浆作用的最直观表达,而底侵和内侵则是大规模岩浆喷出和溢流之前在地壳内部必经的物理-化学过程。单纯从物理学的角度来看,幔源岩浆的底侵和喷出过程,实质是二相流问题。利用数值方法模拟岩浆在固相岩石圈内部的固-液相互作用及迁移过程,在理论和方法上都具有挑战性,目前仍然处于探索阶段(Takei and Katz, 2013; Katz and Takei, 2013)。因此,关于地幔柱与岩石圈之间相互作用的数值模拟研究,尽管多数也包括了具体的地壳模型设计,但主要是将岩石圈作为整体来考察和研究的(何丽娟等, 2011; 蒙伟娟等, 2015),而较少考虑到幔源岩浆在地壳内部引起的热-流变学效应。
本文在建立地壳分层模型的基础上,利用有限差分法对二维热传导方程进行求解,计算幔源岩浆侵入地壳底部引起的岩石圈热-流变学响应;并通过引入考虑幔源岩浆含水量的地幔熔融函数,定量地测试岩浆温度和含水量对熔融程度和底侵厚度的影响。但本文模型没有包括质量守恒方程和动量守恒方程,不能给出应力-应变场和速度场的随时间变化,即未能给出形成地壳底侵的动力学过程(Gerya, 2010)。
本文的数值模拟结果表明:
(1) 幔源岩浆底侵引起的热-流变学响应主要局限于底侵层所在部位的横向尺度范围内,其扰动幅度和持续时间均与初始侵入厚度有关。假设幔源岩浆初始侵入温度为1300℃,参考地壳厚度为40km,初始侵入厚度为20km的地壳底侵,经历1Myr侵入体中心的温度扰动仍可维持在800℃左右;经历10Myr侵入体中心的温度扰动可维持在400℃左右;经历50Myr侵入体中心温度扰动仍可维持在130℃左右;热扰动完全耗尽,需长达约150Myr。对应地,初始侵入厚度为5km的地壳底侵,经历1Myr侵入体中心温度扰动仅维持在300℃左右;经历10Myr侵入体中心的温度扰动小于100℃;经历50Myr,热扰动已基本耗散殆尽。
(2) 伴随着底侵层的热演化,底侵部位的岩石圈屈服应力随深度分布和总体强度也随之变化。由于底侵层的热效应,会导致岩石圈的弱化和强化,即早期地壳底部和岩石圈地幔顶部屈服应力降低、岩石圈总体强度减小;随着热耗散,围岩的屈服应力、岩石圈总体强度逐渐恢复;热扰动完全消耗后,底侵所在深度的屈服应力增大,岩石圈的总体强度也要高于其他部位。仍以初始侵入厚度20km为例,经历6.5Myr左右,底侵层所在地段的岩石圈强度弱化至最低值(初始强度的15%左右);之后,底侵层所在地段的岩石圈强度逐渐恢复;经历150Myr左右,岩石圈强度已恢复到初始值;经历250Myr后,底侵层所在地段的岩石圈强度得到强化,高出初始值10%左右。因此,幔源岩浆的底侵不仅能够导致地壳的垂向生长,而且能够最终改变岩石圈的流变学性质。一般大陆地壳发震深度主要局限于地壳上部(Watts and Burov, 2003)。Wu and Zhang (2012)的研究结果显示,ELIP内带的发震层厚度较其它区带要厚,基本覆盖了整个地壳深度,其形成原因很可能与幔源岩浆形成的底侵对地壳流变学性质的改造有关。
(3) 侵入岩浆温度、含水量是地壳底侵厚度的重要影响因素。温度对地壳底侵厚度的影响比含水量的影响要大得多,单一地增加侵入岩浆的含水量并不能显著增加底侵厚度。
(4) 以现有的岩石地球化学分析、深部地球物理探测结果为约束,探讨了ELIP内带幔源岩浆底侵对应的地表热流随时间的演化和岩浆潜温、初始熔融深度。假设ELIP幔源岩浆的初始侵入温度为1550℃、含水量为0.05%、初始侵入厚度为20km、横向尺度为200km,在不考虑内侵和喷出的情况下,经历15Myr后地表热流达到最高值(约115mW/m2),需经历上百个百万年,热扰动才能耗散殆尽。不同温度和不同含水量的幔源岩浆在上升过程中的初始熔融深度和熔融程度不同,并会影响到最终形成的底侵厚度。总体而言,如果最终形成的底侵厚度超过15km,在幔源岩浆含水量为0.03%~0.05%的情况下,则意味着岩浆的潜温超过1500℃,岩浆的初始熔融深度超过200km。
致谢 感谢李娟和徐涛研究员对本文提出了宝贵建议,感谢英国牛津大学Richard Katz教授在计算F-P曲线等方面提供了指导和帮助。感谢两位匿名评审专家提供了宝贵的修改意见。
Bittner D and Schmeling H. 1995. Numerical modelling of melting processes and induced diapirism in the lower crust. Geophysical Journal International, 123: 59-70. DOI:10.1111/gji.1995.123.issue-1 |
Brace WF and Kohlstedt DL. 1980. Limits on lithospheric stress imposed by laboratory experiments. Journal of Geophysical Research, 85(B11): 6248-6252. DOI:10.1029/JB085iB11p06248 |
Burov EB. 2011. Rheology and strength of the lithosphere. Marine and Petroleum Geology, 28: 1402-1443. DOI:10.1016/j.marpetgeo.2011.05.008 |
Byerlee J. 1978. Friction of rocks. Pure and Applied Geophysics, 116: 615-626. DOI:10.1007/BF00876528 |
Chen L and Gerya TV. 2016. The role of lateral lithospheric strength heterogeneities in orogenic plateau growth:Insights from 3-D thermos-mechanical modeling. Journal of Geophysical Research:Solid Earth, 121: 3118-3138. DOI:10.1002/jgrb.v121.4 |
Chen Y, Xu YG, Xu T, Si SK, Liang XF, Tian XB, Deng YF, Chen L, Wang P, Xu YH, Lan HQ, Xiao FH, Li W, Zhang X, Yuan XH, Badal J and Teng JW. 2015. Magmatic underplating and crustal growth in the Emeishan Large Igneous Province, SW China, revealed by a passive seismic experiment. Earth and Planetary Science Letters, 432: 103-114. DOI:10.1016/j.epsl.2015.09.048 |
Chen Y, Wang ZH, Guo X, Deng YF, Xu T, Liang XF, Tian XB, Wu J, Chen L, Zhang X, Tang GB and Xu YG. 2017. Geophysical signature of the ancient mantle plume activities:A case study of the Emeishan large igneous province. Bulletin of Mineralogy, Petrology and Geochemistry, 36(3): 394-403. |
Clauser C and Huenges E. 1995. Thermal conductivity of rocks and minerals. In: Ahrens TJ (ed. ). Rock Physics & Phase Relations: A Handbook of Physical Constants. American Geophysical Union, 105-126
|
Cox KG. 1993. Continental magmatic underplating. Philosophical Transactions of the Royal Society A:Mathematical, Physical and Engineering Sciences, 342: 155-166. DOI:10.1098/rsta.1993.0011 |
Deng YF, Chen Y, Wang P, Essa KS, Xu T, Liang XF and Badal J. 2016. Magmatic underplating beneath the Emeishan large igneous province (South China) revealed by the COMGRA-ELIP experiment. Tectonophysics, 672-673: 16-23. DOI:10.1016/j.tecto.2016.01.039 |
Dixon JE, Leist L, Langmuir C and Schilling JG. 2002. Recycled dehydrated lithosphere observed in plume-influenced mid-ocean-ridge basalt. Nature, 420: 385-389. DOI:10.1038/nature01215 |
Fountain DM. 1989. Growth and modification of lower continental crust in extended terrains: The role of extension and magmatic underplating. In: Mereu RF et al. (ed. ). Properties and Processes of Earth's Lower Crust. American Geophysical Union Monograph Series, 51: 287-299
|
Furlong KP and Fountain DM. 1986. Continental crustal underplating:Thermal considerations and seismic-petrologic consequences. Journal of Geophysical Research:Solid Earth, 91: 8285-8294. DOI:10.1029/JB091iB08p08285 |
Furlong KP and Chapman DS. 2013. Heat flow, heat generation, and the thermal state of the lithosphere. Annual Review of Earth and Planetary Sciences, 41: 385-410. DOI:10.1146/annurev.earth.031208.100051 |
Fyfe WS. 1992. Magma underplating of continental crust. Journal of Volcanology and Geothermal Research, 50: 33-40. DOI:10.1016/0377-0273(92)90035-C |
Gao S, Zhang BR, Jin ZM, Kern H, Luo TC and Zhao ZD. 1998. How mafic is the lower continental crust?. Earth and Planetary Science Letters, 161: 101-117. DOI:10.1016/S0012-821X(98)00140-X |
Gerya TV and Burg JP. 2007. Intrusion of ultramafic magmatic bodies into the continental crust:Numerical simulation. Physics of the Earth and Planetary Interiors, 160: 124-142. DOI:10.1016/j.pepi.2006.10.004 |
Gerya TV. 2010. Introduction to Numerical Geodynamic Modelling. Cambridge University Press.
|
Guo X, Chen Y, Li SD, Deng YF, Xu T, Li W and Tan P. 2017. Crustal shear-wave velocity structure and its geodynamic implications beneath the Emeishan large igneous province. Chinese Journal of Geophysics, 60(9): 3338-3351. |
Hacker BR, Kelemen PB and Behn MD. 2011. Differentiation of the continental crust by relamination. Earth and Planetary Science Letters, 307: 501-516. DOI:10.1016/j.epsl.2011.05.024 |
He B, Xu YG, Chung SL, Xiao L and Wang YM. 2003. Sedimentary evidence for a rapid, kilometer-scale crustal doming prior to the eruption of the Emeishan flood basalts. Earth and Planetary Science Letters, 213: 391-405. DOI:10.1016/S0012-821X(03)00323-6 |
He LJ, Xu HH and Wang JY. 2011. Thermal evolution and dynamic mechanism of the Sichuan Basin during the Early Permian-Middle Triassic. Science China (Earth Sciences), 54(12): 1948-1954. DOI:10.1007/s11430-011-4240-z |
Hess PC. 1989. Origin of Igneous Rocks. Harvard University Press.
|
Hirschmann MM. 2006. Water, melting, and the deep Earth H2O cycle. Annual Review of Earth and Planetary Science, 34: 629-653. DOI:10.1146/annurev.earth.34.031405.125211 |
Hirth G and Kohlstedt DL. 1996. Water in the oceanic upper mantle:Implications for rheology, melt extraction and the evolution of the lithosphere. Earth and Planetary Science Letters, 144: 93-108. DOI:10.1016/0012-821X(96)00154-9 |
Iwamori H, McKenzie D and Takahashi E. 1995. Melt generation by isentropic mantle upwelling. Earth and Planetary Science Letters, 134: 253-266. DOI:10.1016/0012-821X(95)00122-S |
Karato SI. 2010. Rheology of the Earth's mantle:A historical review. Gondwana Research, 18: 17-45. DOI:10.1016/j.gr.2010.03.004 |
Katz RF, Spiegelman M and Langmuir CH. 2003. A new parameterization of hydrous mantle melting. Geochemistry, Geophysics, Geosystems, 4(9): 1-19. |
Katz RF and Takei Y. 2013. Consequences of viscous anisotropy in a deforming, two-phase aggregate. Part 2. Numerical solutions of the full equations. Journal of Fluid Mechanics, 734: 456-485. DOI:10.1017/jfm.2013.483 |
Kelley KA, Plank T, Grove TL and Erik H. 2006. Mantle melting as a function of water content beneath back-arc basins. Journal of Geophysical Research:Solid Earth, 111(B9): 1-21. |
Kirby SH. 1983. Rheology of the lithosphere. Reviews of Geophysics and Space Physics, 21(6): 1458-1487. DOI:10.1029/RG021i006p01458 |
Lee CA and Chin EJ. 2014. Calculating melting temperatures and pressures of peridotite protoliths:Implications for the origin of cratonic mantle. Earth and Planetary Science Letters, 403: 273-286. DOI:10.1016/j.epsl.2014.06.048 |
Liu M and Chase CG. 1991. Evolution of Hawaiian basalts:A hotspot melting model. Earth and Planetary Science Letters, 104: 151-165. DOI:10.1016/0012-821X(91)90201-R |
Liu M and Furlong KP. 1992. Cenozoic volcanism in the California Coast Ranges:Numerical solutions. Journal of Geophysical Research:Solid Earth, 97: 4941-4951. DOI:10.1029/92JB00193 |
Liu M and Furlong KP. 1993. Crustal shortening and Eocene extension in the southeastern Canadian Cordillera:Some thermal and rheological considerations. Tectonics, 12: 776-786. DOI:10.1029/93TC00131 |
Liu M and Furlong KP. 1994. Intrusion and underplating of mafic magmas:thermal-rheological effects and implications for Tertiary tectonomagmatism in the North American Cordillera. Tectonophysics, 237: 175-187. DOI:10.1016/0040-1951(94)90253-4 |
Marsh BD. 1982. On the mechanics of igneous diapirism, stoping, and zone melting. American Journal of Science, 282(6): 808-855. DOI:10.2475/ajs.282.6.808 |
McKenzie D and Bickle MJ. 1988. The volume and composition of melt generated by extension of the lithosphere. Journal of Petrology, 29: 625-679. DOI:10.1093/petrology/29.3.625 |
McKenzie D and O'nions RK. 1991. Partial melt distributions from inversion of rare earth element concentrations. Journal of Petrology, 32: 1021-1091. DOI:10.1093/petrology/32.5.1021 |
Meng WJ, Chen ZA and Bai WM. 2015. Numerical simulation on process of the plume-lithosphere interaction. Chinese Journal of Geophysics, 58(2): 495-503. |
Ranalli G. 1995. Rheology of the Earth. Chapman & Hall
|
Rudnick R. 1990. Growing from below. Nature, 347: 711-712. DOI:10.1038/347711a0 |
Schmidt MW and Poli S. 1998. Experimentally based water budgets for dehydrating slabs and consequences for arc magma generation. Earth and Planetary Science Letters, 163: 361-379. DOI:10.1016/S0012-821X(98)00142-3 |
Takei Y and Katz RF. 2013. Consequences of viscous anisotropy in a deforming, two-phase aggregate. Part 1. Governing equations and linearized analysis. Journal of Fluid Mechanics, 734: 424-455. DOI:10.1017/jfm.2013.482 |
Thybo H and Artemieva IM. 2013. Moho and magmatic underplating in continental lithosphere. Tectonophysics, 609: 605-619. DOI:10.1016/j.tecto.2013.05.032 |
Turcotte DL and Schubert G. 2002. Geodynamics. Cambridge University Press.
|
Wallace PJ. 1998. Water and partial melting in mantle plumes:Inferences from the dissolved H2O concentrations of Hawaiian basaltic magmas. Geophysical Research Letters, 25: 3639-3642. DOI:10.1029/98GL02805 |
Wang YJ, Zhang YH, Fan WM, Xi XW, Guo F and Lin G. 2002. Numerical modelling for generation of Indo-Sinian peraluminous granitoids Hunan Province:Basaltic underplating versus tectonic thickening. Science in China (Series D), 45: 1042-1056. DOI:10.1007/BF02911241 |
Wangen M, Mjelde R and Faleide JI. 2011. Modelling thermal transients from magmatic underplating:An example from the Vøring margin (NE Atlantic). Computer and Geosciences, 15: 771-788. DOI:10.1007/s10596-011-9248-0 |
Watts AB and Burov EB. 2003. Lithospheric strength and its relationship to the elastic and seismogenic layer thickness. Earth and Planetary Science Letters, 213: 113-131. DOI:10.1016/S0012-821X(03)00289-9 |
Wu J and Zhang ZJ. 2012. Spatial distribution of seismic layer, crustal thickness, and Vp/Vs ratio in the Permian Emeishan Mantle Plume region. Gondwana Research, 22: 127-139. DOI:10.1016/j.gr.2011.10.007 |
Xu T, Zhang ZJ, Liu BF, Chen Y, Zhang MH, Tian XB, Xu YG and Teng JW. 2015. Crustal velocity structure in the Emeishan large igneous province and evidence of the Permian mantle plume activity. Science China (Earth Sciences), 58(7): 1133-1147. DOI:10.1007/s11430-015-5094-6 |
Xu YG and Chung SL. 2001. The Emeishan large igneous province:Evidence form mantle plume activity and melting conditions. Geochimica, 30(1): 1-9. |
Xu YG, He B, Chung SL and Frey FA. 2004. Geologic, geochemical, and geophysical consequences of plume involvement in the Emeishan flood-basalt province. Geology, 32: 917-920. DOI:10.1130/G20602.1 |
Zhong YT, He B, Mundil R and Xu YG. 2014. CA-TIMS zircon U-Pb dating of felsic ignimbrite from the Binchuan section:Implications for the termination age of Emeishan large igneous province. Lithos, 204: 14-19. DOI:10.1016/j.lithos.2014.03.005 |
Zhu CQ, Xu M, Yuan YS, Zhao YQ, Chan JN, He GZ, Tian YT and Hu SB. 2010. Palaeogeothermal response and record of the effusing of Emeishan basalts in the Sichuan basin. Chinese Science Bulletin, 55(1): 949-956. |
陈赟, 王振华, 郭希, 邓阳凡, 徐涛, 梁晓峰, 田小波, 吴晶, 陈林, 张晰, 唐国彬, 徐义刚. 2017. 古地幔柱作用"遗迹"的深部地球物理探测——以峨眉山大火成岩省为例. 矿物岩石地球化学通报, 36(3): 394-403. |
郭希, 陈赟, 李士东, 邓阳凡, 徐涛, 李玮, 谭萍. 2017. 峨眉山大火成岩省地壳横波速度结构特征及其动力学意义. 地球物理学报, 60(9): 3338-3351. DOI:10.6038/cjg20170906 |
何丽娟, 许鹤华, 汪集旸. 2011. 早二叠世-中三叠世四川盆地热演化及其动力学机制. 中国科学(地球科学), 41: 1884-1891. |
蒙伟娟, 陈祖安, 白武明. 2015. 地幔柱与岩石圈相互作用过程的数值模拟. 地球物理学报, 58(2): 495-503. DOI:10.6038/cjg20150213 |
王岳军, Zhang YH, 范蔚茗, 等. 2002. 湖南印支期过铝质花岗岩的形成:岩浆底侵与地壳加厚热效应的数值模拟. 中国科学(D辑), 32: 491-499. |
徐涛, 张忠杰, 刘宝峰, 陈赟, 张明辉, 田小波, 徐义刚, 滕吉文. 2015. 峨眉山大火成岩省地壳速度结构与古地幔柱活动遗迹:来自丽江-清镇宽角地震资料的约束. 中国科学(地球科学), 45(5): 561-576. |
徐义刚, 钟孙霖. 2001. 峨眉山大火成岩省:地幔柱活动的证据及其熔融条件. 地球化学, 30(1): 1-9. |
朱传庆, 徐明, 袁玉松, 赵永庆, 单竞男, 何国志, 田云涛, 胡圣标. 2010. 峨眉山玄武岩喷发在四川盆地的地热学响应. 科学通报, 55: 474-482. |