 2016, Vol. 32


2. 山东大学空间科学研究院, 山东省光学天文与日地空间环境重点实验室, 威海 264209
2. Shandong Provincial Key Laboratory of Optical Astronomy & Solar-Terrestrial Environment, Institute of Space Sciences, Shandong University, Weihai 264209, China
月球漩涡是月球表面明亮、蜿蜒状的地质特征,具有与明亮斑纹交错分布的暗带,一般无明显的地形起伏(El-Baz,1972),通常与月球表面的磁异常相关联(Hood et al., 1979; Hood and Williams, 1989; Richmond et al., 2005)。月球漩涡成因一直是月球科学中的谜团(Blewett et al., 2011),目前主要有彗星撞击、太阳风偏转、月尘搬运三种假说。 根据彗星撞击成因,彗星撞击移除月壤中的极细颗粒,破坏原有的月壤结构,导致漩涡具有独特、经过改造的表层月壤,形成其明亮斑纹;撞击熔融和汽化产物沉积在明亮斑纹周围,形成暗带;同时彗星撞击会形成尘埃等离子体,产生极强的瞬变磁场(Schultz and Srnka, 1980; Sayal and Schultz, 2015)。根据太阳风偏转模型,与磁异常相关的异常空间风化作用减弱了太阳风离子对月球表面的轰击(Hood and Schubert, 1980; Hood and Williams, 1989),因而形成明亮斑纹;暗带区域受太阳风轰击较强,因而较暗。在月尘搬运模型中,太阳风与磁异常相互作用产生电场异常,由静电抬升的月壤细颗粒在该电场异常作用下水平迁移(Garrick-Bethell et al., 2011),最终形成月球漩涡。上述各假说中,月壤极细颗粒的移除和月壤结构的破坏均可影响其光度行为,如明亮斑纹具有较强的前向散射(Schutz and Srnka, 1980),在相比率图像中呈现较低的相陡度(Kaydash et al., 2009)。因此,精细研究漩涡各部分物质的光度行为,建立光度模型参数,对分析形成漩涡的地质作用及成因(如空间风化和彗星撞击)具有重要意义。
位于月球风暴洋西部月海中的Reiner Gamma建造(7.5°N,301.5°E)是月球表面典型的漩涡特征(图 1),绵延数百公里,在紫外、可见和近红外谱段均呈现完整的环状明亮斑纹并伴有暗带(Kramer et al., 2011; Blewett et al., 2011; Denevi et al., 2014),相对其他漩涡具有较强的磁异常(Blewett et al., 2011)。为精细研究该典型漩涡的物质特性及类型分布,我们使用最新的Lunar Reconnaissance Orbiter Camera(LROC)Wide Angle Camera(WAC)数据,选取该地区月海(MR1、MR2)、明亮斑纹(BR1、BR2、BR3)和暗带(DL1、DL2)共7块研究区域,分别建立光度模型,分析其光度行为和物质分类。
 | 图 1 Reiner Gamma地区LROC WAC 643 nm影像图及7块研究区域Fig. 1 LROC WAC 643nm image for Reiner Gamma region and the 7 study areas |
LROC WAC是搭载于Lunar Reconnaissance Orbiter(LRO)上的一台紫外-可见多光谱相机,它包括321~689nm之间7个谱段,运行于50km极地圆轨道时紫外(321nm和360nm)和可见(415、566、604、643和689nm)谱段空间分辨率分别为~380m/pixel和75m/pixel(Denevi et al., 2014)。本研究采用LROC WAC 643nm谱段图像,选择2010年2月至2011年10月间LRO运行于50km极地圆轨道时覆盖Reiner Gamma地区(6.7~8.0°N,300.0~302.5°E)的39轨数据,以保证较高的空间分辨率和数据一致性。
LROC WAC数据处理使用ISIS软件(Anderson et al., 2004),EDR(Experiment Data Record)原始数据经辐射定标转换为辐亮度因子(RADF),并提取每一像素对应的太阳光照几何(入射角i、出射角e和太阳相角g)和经纬度。经统计,覆盖Reiner Gamma地区的LROC WAC数据太阳相角随经度的变化及分布如图 2所示。受LROC观测条件和覆盖次数限制,特定相角数据仅分布于零散的经度范围内;对小太阳相角数据(< 6°,图 2虚线左侧)经纬度的统计结果表明(图 3所示),这些数据仅位于4个特定经度区间内,而它们的纬度呈连续分布,但高纬度地区数据点较少。
 | 图 2 Reiner Gamma地区LROC WAC数据太阳相角随经度的变化及分布Fig. 2 Solar phase angle variation and distribution with longitude for LROC WAC data covering Reiner Gamma region |
 | 图 3 Reiner Gamma地区LROC WAC小太阳相角( < 6°)数据随经纬度的分布和7块研究区域覆盖范围Fig. 3 Longitude and latitude distribution of LROC WAC data at small solar phase angles ( < 6°) covering Reiner Gamma region and the 7 study areas |
本研究分析Reiner Gamma地区物质的光度行为采用Hapke模型(Hapke,2012a),建模需特定光照几何(如小太阳相角)的观测数据,从而限定了研究区域的选择。如图 1所示,研究对象主要为Reiner Gamma地区的明亮斑纹、暗带和月海三类地质单元,为研究这些单元物质的光度行为,在求解Hapke模型Opposition Effect参数时,需小太阳相角数据(Hapke,2012a)。上述讨论中已提到,小太阳相角数据经纬度分布的区间有限,因此我们选取图 1和图 3中方框所示的7块研究区域,它们既代表三类地质单元中反射率均一的区域,又包含建模所需的特定光照几何数据。7块研究区域的经纬度位置和太阳相角范围见表 1。
| 表 1 7块研究区域位置和太阳相角 Table 1 Locations and solar phase angles for the 7 study areas |
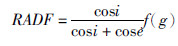
首先分析Reiner Gamma漩涡地区整体的光度行为和物质分类。月球光度行为近似满足Lommel-Seeliger定律,辐亮度因子(RADF)随入射角i、出射角e和太阳相角g的变化为(Hapke,2012a):
 | 图 4 Reiner Gamma地区LROC WAC数据太阳相角与辐亮度因子二维直方图Fig. 4 Solar phase angle vs. RADF 2D histogram of LROC WAC data covering Reiner Gamma region |
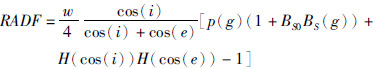
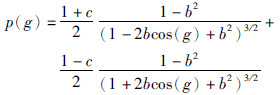
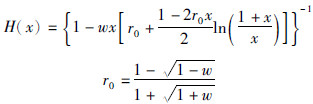
细致分析Reiner Gamma漩涡各地质单元的光度行为需要反演其光度模型参数。光度模型描述 了月球表面反射率随太阳光照几何(入射角i、出射角e和太阳相角g)的变化,行星科学中较为常用的是Hapke模型(Hapke,2012a),其参数反映了月壤的粒径、疏松度、粗糙度等物理特性。由于Reiner Gamma地区缺少接近零太阳相角数据(表 1),难以求解与Opposition Effect相关的参数(Hapke,2012a),我们采用简化的Hapke模型(Sato et al., 2014):

| 表 2 Hapke模型各参数物理意义和限定的数值范围 Table 2 Hapke model parameters and their ranges |
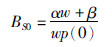
利用7块研究区域的LROC WAC数据(RADF、入射角i、出射角e和太阳相角g),采用最小二乘法分别拟合上述简化的Hapke模型参数。由于缺少接近零太阳相角数据(表 1),SHOE幅度BS0由参数w、c和b确定(Hapke,2012a):
| 表 3 7块研究区域的Hapke模型参数值 Table 3 Hapke model parameter values for the 7 study areas |
Reiner Gamma漩涡地区存在明亮斑纹(BR1、BR2、BR3)、暗带(DL1和DL2)、月海(MR1和MR2)三类地质单元(图 1)。LROC WAC紫外谱段观测发现,明亮斑纹的321/414nm反射率比值与暗带、周边月海以及撞击坑溅射物相比均较低,但与新鲜暴露、受空间风化作用较轻的高钛月海玄武岩样品(75035,207)的谱形相似(Denevi et al., 2014);Clementine可见-近红外观测同样证实明亮斑纹的成熟度较低(Blewett et al., 2011);暗带与周边月海具有相似的可见-近红外-中红外光谱特征(Garrick-Bethell et al., 2011; Glotch et al., 2015),并且二者的成熟度也较为接近(Glotch et al., 2015)。根据最近Moon Mineralogy Mapper(M3)的光谱观测(图 5),我们发现Reiner Gamma漩涡的明亮斑纹、暗带和周边月海光谱在波长1μm和2μm处的吸收中心峰位非常接近(图 5b),表明它们所覆盖物质的矿物组分类似;而根据图 5a,明亮斑纹比暗带和周边月海反射率更高,且具有更强的吸收特征,表明其受空间风化作用较弱,月壤成熟度较低;暗带和周边月海的光谱特性较为接近。
 | 图 5 7块研究区域的M3反射率光谱(a)和去除连续统后的光谱(b)Fig. 5 M3 reflectance spectra (a) and continuum-removed spectra (b) for the 7 study areas |
除光谱特性外,漩涡地区各地质单元的光度行为也可作为物质分类的重要依据,例如月壤的相函数可反映月壤粒径和结构特性(Hapke,2012b),因而用于区分不同物质单元。如图 6所示,明亮斑纹、暗带与周边月海的相函数参数值(b和c,见表 2和表 3)明显不同,三者的相函数曲线在大太阳相角(>90°)时趋向一致。明亮斑纹BR3的c参数值接近于1,在所有研究区域中光度行为最为异常,且与其他两处明亮斑纹(BR1和BR2)偏离较大,它位于Reiner Gamma漩涡磁场水平分量最强的区域(Hemingway and Garrick-Bethell, 2012),因此光度异常与磁异常可能存在关联。如图 6和图 7所示,暗带的亮度与周边月海相近,但二者相函数参数存在明显差异,其光度行为介于明亮斑纹与月海之间,表明它们所覆盖月壤的物理特性(如粒径、微结构)不同。暗带与周边月海光谱的光谱特征相似,说明二者物质成分接近,暗带物质可能来自周边月海;而二者不同的光度行为,揭示暗带可能来自周边月海月壤搬运沉积(Sayal and Schultz, 2015),形成了独特的月壤物理结构。
 | 图 6 7块研究区域的Henyey-Greenstein相函数参数散点图和相函数曲线Fig. 6 Henyey-Greenstein phase function parameters and phase curves for the 7 study areas |
 | 图 7 7块研究区域的辐亮度因子(RADF)与相函数参数c散点图Fig. 7 RADF vs. c scatter plot for the 7 study areas |
本文利用LROC WAC在多太阳光照几何下的观测数据,选取月球Reiner Gamma漩涡地区明亮斑纹、暗带和周边月海三类主要地质单元共7块研究区域,分别建立Hapke光度模型,分析其光度行为,并结合M3光谱数据对漩涡物质进行分类。结果表明,该漩涡地区的明亮斑纹与暗带和周边月海的亮度、光谱和光度特性完全不同,其异常光度行为可能与漩涡的强水平方向磁场存在关联。暗带与周边月海的亮度和光谱特性相近,说明它们的物质成分类似,但二者可以通过光度模型的相函数参数区分,其光度行为介于周边月海和明亮斑纹之间,表明暗带与周边月海的月壤结构存在差异,可能为月海物质经过搬运后形成的沉积产物。为了解漩涡成因,未来还需进一步开展Reiner Gamma及其他典型漩涡地区的物质特性研究,如利用更高空间分辨率的LROC NAC数据,通过暗带区域的小撞击坑溅射物,分析漩涡次表层物质的光度行为。
致谢 感谢编辑和两位审稿人对本文的细致审阅和给予的宝贵修改意见。| [1] | Anderson JA, Sides SC, Soltesz DL, Sucharski TL and Becker KJ. 2004. Modernization of the integrated software for imagers and spectrometers. In: Proceedings of the 35th Lunar and Planetary Science Conference. Houston, TX: Lunar and Planetary Institute, 35: 2039 |
| [2] | Blewett DT, Coman EI, Hawke BR, Gillis-Davis JJ, Purucker ME and Hughes CG. 2011. Lunar swirls: Examining crustal magnetic anomalies and space weathering trends. Journal of Geophysical Research: Planets, 116(E2), doi: 10.1029/2010JE003656 |
| [3] | Denevi BW, Robinson MS, Boyd AK, Sato H, Hapke BW and Hawke BR. 2014. Characterization of space weathering from Lunar Reconnaissance Orbiter Camera ultraviolet observations of the Moon. Journal of Geophysical Research: Planets, 119(5): 976-997 |
| [4] | El-Baz F. 1972. The Alhazen to Abul Wáfa swirl belt: An extensive field of light-colored, sinuous markings. Apollo 16: Preliminary Science Report, NASA SP-315: 29-93 |
| [5] | Garrick-Bethell I, Head JW and Pieters CM. 2011. Spectral properties, magnetic fields, and dust transport at lunar swirls. Icarus, 212(2): 480-492 |
| [6] | Glotch TD, Bandfield JL, Lucey PG, Hayne PO, Greenhagen BT, Arnold JA, Ghent RR and Paige DA. 2015. Formation of lunar swirls by magnetic field standoff of the solar wind. Nature Communications, 6(6189), doi: 10.1038/ncomms7189 |
| [7] | Hapke B. 2012a. Theory of Reflectance and Emittance Spectroscopy. 2nd Edition. New York: Cambridge University Press, 1-513 |
| [8] | Hapke B. 2012b. Bidirectional reflectance spectroscopy 7: The single particle phase function hockey stick relation. Icarus, 221(2): 1079-1083 |
| [9] | Hemingway D and Garrick-Bethell I. 2012. Magnetic field direction and lunar swirl morphology: Insights from Airy and Reiner Gamma. Journal of Geophysical Research: Planets, 117(E10), doi: 10.1029/2012JE004165 |
| [10] | Hood LL, Coleman PJ and Wilhelms DE. 1979. A study on lunar nearside magnetic anomalies. In: Merrill RB (ed.). Proceedings of the 10th Lunar and Planetary Science Conference. Houston, TX: Lunar and Planetary Institute, 10: 561-563 |
| [11] | Hood LL and Schubert G. 1980. Lunar magnetic anomalies and surface optical properties. Science, 208(4439): 49-51 |
| [12] | Hood LL and Williams CR. 1989. The lunar swirls: Distribution and possible origins. In: Proceedings of the 19th Lunar and Planetary Science Conference. Houston, TX: Lunar and Planetary Institute, 19: 99-113 |
| [13] | Kaydash V, Kreslavsky M, Shkuratov Y, Gerasimenko S, Pinet P, Josser JL, Beauvivre S and Foing B. 2009. Photometric anomalies of the lunar surface studied with SMART-1 AMIE data. Icarus, 202(2): 393-413 |
| [14] | Kramer GY, Besse S, Dhingra D, Nettles J, Klima R, Garrick-Bethell I, Clark RG, Combe JP, Head JW, Taylor LA, Pieters CM, Boardman J and McCord TB. 2011. M3 spectral analysis of lunar swirls and the link between optical maturation and surface hydroxyl formation at magnetic anomalies. Journal of Geophysical Research: Planets, 116(E9), doi: 10.1029/2010JE003729 |
| [15] | Richmond NC, Hood LL, Mitchell DL, Lin RP, Acuña MH and Binder AB. 2005. Correlations between magnetic anomalies and surface geology antipodal to lunar impact basins. Journal of Geophysical Research: Planets, 110(E5), doi: 10.1029/2005JE002405 |
| [16] | Sato H, Robinson MS, Hapke B, Denevi BW and Boyd AK. 2014. Resolved Hapke parameter maps of the Moon. Journal of Geophysical Research: Planets, 119(8): 1775-1805 |
| [17] | Sayal MB and Schultz PH. 2015. Cometary impact effects at the Moon: Implications for lunar swirl formation. Icarus, 257: 194-206 |
| [18] | Schultz PH and Srnka LJ. 1980. Cometary collisions on the Moon and Mercury. Nature, 284(5751): 22-26 |