2. 中国科学院地理科学与资源研究所, 生态系统网络观测与模拟重点实验室, 100101, 北京;
3. 中国科学院大学, 100049, 北京;
4. 水利部鄱阳湖水资源水生态研究中心, 330029, 南昌
中国水土保持科学  2020, Vol. 18 2020, Vol. 18  Issue (2): 36-42. DOI: 10.16843/j.sswc.2020.02.005 Issue (2): 36-42. DOI: 10.16843/j.sswc.2020.02.005 |
水土流失是一个受地表覆被配置调控的地表过程。最优配置模式的遴选需要评估大量的待选模式。比较产流产沙是评价植被配置水土保持功能的主要途径,但经济和时间成本限制备选覆被配置的数量。景观格局分析为覆被配置模式的比较提供了一个途径。斑块-廊道-基底景观范式下的格局指数被引入到植被配置格局与水土流失的关系研究中[1]。由于水土流失是沿地形梯度进行的方向性水土分配过程[2],这类指数缺乏明确的水土流失过程意义[2]。针对水土流失过程开发的景观格局指数是最佳的选择[3-5]。通过覆被格局与水土流失的相互作用研究,发展具有过程意义的覆被格局指数[6-7],如方向性渗透指数、多向渗透指数[5]、覆盖度加权方向性渗透指数[8]、水流路径距离加权方向性渗透指数[3]等,但多在干旱区半干旱区提出和验证[3, 5, 8-9]。南方红壤丘陵区是我国水土流失热点区[10]。区内气候湿润,土壤抗蚀性高,调整植被配置是应对水土流失的重要途径之一[11-12]。虽在坡面到流域尺度开展了大量实验研究[12-14],但在刻画植被配置模式的水土保持效果时这些新型指数的适用性尚未得到检验。笔者试图在小区尺度用DLI和FDLI评价覆被配置的水土保持功能,并检验指数的适用性。
1 研究区概况实验小区位于江西水土保持生态科技园内,地处博阳河西岸,地理位置为E 115°42′38″—115°43′06″,N 29°16′37″—29°17′40″,属北亚热带湿润季风气候,年降雨量865.6~1807.7mm,年平均降雨量1350.9mm,季节分配不均,有明显的干、湿季。多年平均气温16.7℃,多年日照时间1650~2100h,多年年平均无霜期249d。为第四纪红土覆盖。
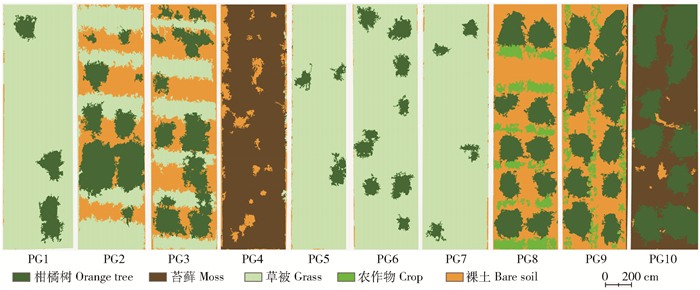
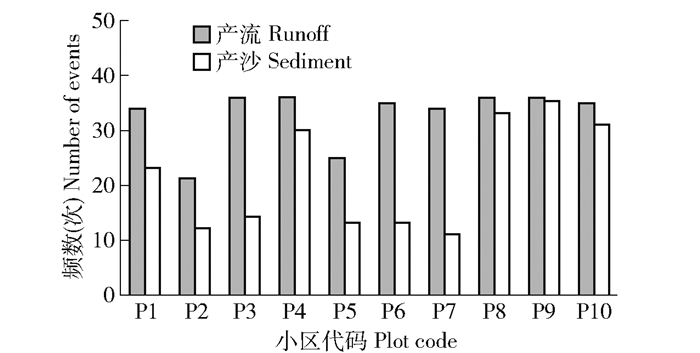
2 材料与方法 2.1 实验布设和数据采集笔者设10个20m×5m试验小区(表 1和图 1),坡度均为12°。小区四周设围埂,下沿修筑集水槽-径流池系统收集径流及泥沙。径流池为按50年一遇的暴雨设计,为串联的1m×1.2m×0.8m方柱形钢筋混泥土构筑池(A、B、C池)。A池在0.75m处、B池在0.55m处设五分“V”形三角分流堰。径流池内壁贴搪瓷水尺,率定后读数测地表径流量。采用两套虹吸式自记雨量计观测降雨量。径流量按次降雨观测, 观测时段为2017年1—11月。每次降雨后,将池中的水充分搅拌均匀,分3层取混合样,从样中取1L水样,烘干称量求含沙量,乘以径流量算产沙量。期间共观测到134次降雨,小区产流和产沙频数如图 2。基于无人机航拍,利用Agisoft软件获得DEM和正射影像,用ArcGIS对影像分类获得覆被图(图 1)。
| 表 1 小区覆被配置 Tab. 1 Land cover deployment of experiment plots |

|
图 1 试验小区覆被图 Fig. 1 Land cover on experiment plots |

|
图 2 各径流小区产流、产沙次数 Fig. 2 Number of rainfall events with runoff generation and sediment production |
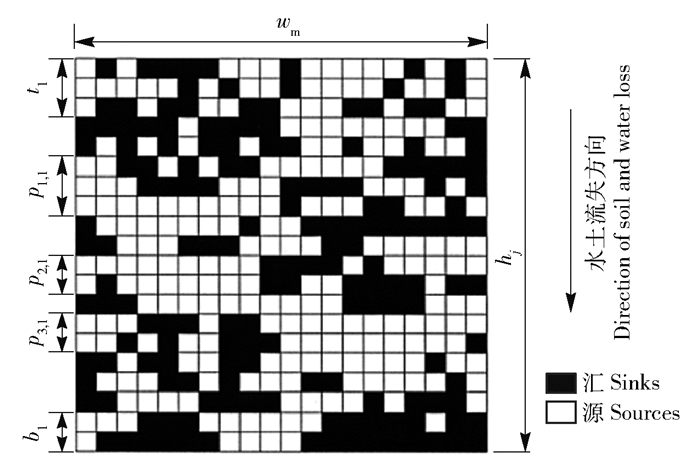
采用方向性渗透指数(directional leakiness index, DLI)[5]和改进的水流路径距离加权方向性渗透指数(flow-length-weighted directional leakiness index, FDLI)[3]刻画覆被配置,将覆被划分为留滞水沙的汇和产生径流、泥沙的源[5],以源、汇间的欧氏距离构建参数(图 3、式(1)和式(2))。它们能很好地表征干旱半干旱区覆被格局留滞水沙的能力[3, 5, 9]。
| $ \begin{matrix} {{L}_{\text{obs}}}=\sum\limits_{j}{\left[ \left( {{h}_{\text{s}}}/{{h}_{j}} \right)\left( \sum\limits_{i}^{n}{p_{i, j}^{2}} \right)+ \right.} \\ \left. \left. \left( {{h}_{\text{s}}}/{{h}_{j}} \right)-1 \right)\left( {{\left( {{t}_{j}}+{{b}_{j}} \right)}^{2}} \right)+\left( t_{j}^{2}+b_{j}^{2} \right) \right]\left( \frac{{{w}_{\text{s}}}}{{{w}_{\text{m}}}} \right)(d); \\ \end{matrix} $ | (1) |
| $ D_{\mathrm{L}}=1-\left[\left(L_{\max }-L_{\mathrm{ols}}\right) /\left(L_{\max }-L_{\min }\right)\right]^{k}。$ | (2) |

|
图 3 DLI的参数示意图,改自参考文献[5] Fig. 3 Illustration of the parameters for directional leakiness index (DLI), modified from reference [5] |
式中:Lobs为渗透度观测值;DLI为方向性渗透指数,值越大水土流失风险越高,值越小水土流失风险越小;pi, j为第j列第i个斑块间距;tj为第j列最上部植被斑块距小区顶端的距离;bj是第j列最下部植被斑块距出口的距离;d为栅格大小;Lmax是最大渗透度,即没有任何阻碍斑块时的Lobs;Lmin是最小渗透度,即完全为阻碍斑块时的Lobs;hs、hj、ws、wm为使不同大小的小区可比而设定的标准小区长度、小区第j列长度、标准小区宽度和小区宽度;k为植被覆盖度与土壤侵蚀之间关系的拟合次数,设置为5[5]。DLI基于栅格覆被数据计算。
距离目的地越近,径流、泥沙到达的可能性越高。DLI没有考虑这个影响,通过增加距离权重ω弥补见式(3)。式(3)中F为到出口的水流路径距离。以ω对每个栅格加权后计算参数hj、tj、bj、pi, j,进而得到水流路径距离加权的方向性渗透指数(FDLI)。对水、土的流失,地表覆被的功能不同。根据产流和产沙过程中的功能再分类覆被类型(表 2)后计算指数。
| $ \omega=1 / F^{2}。$ | (3) |
| 表 2 针对水土流失过程的覆被功能类型划分 Tab. 2 Classification of land cover according to functions in soil and water loss |
对产流和产沙,小区覆被格局指数值大小顺序不同(图 4)。对产流(图 4(a)),DLI和FDLI指数值大小排序为PG4>PG10>PG9>PG8>PG2>PG3>PG6>PG1>PG5>PG7。覆被类型为苔藓和裸土覆盖的PG4具有最高的DLI和FDLI值;其后次为PG10、PG9。对产沙(图 4(b)),DLI和FDLI大小排序为PG9>PG8>PG2>PG3>PG10>PG4>PG6>PG1>PG5>PG7。同为柑橘树覆盖较高的覆被配置,沿等高线带状草被间作(如PG2和PG3)的DLI和FDLI值显著低于无带状草被的模式(PG8~10)。

|
图 4 针对产流(a)和产沙(b)划分“源”“汇”后计算的格局指数 Fig. 4 Pattern indices based on source and sink classification for runoff generation (a) and sediment production (b) |
按产流量排序为PG4>PG10>PG9>PG8>PG1>PG3>PG6>PG7>PG2>PG5,产沙量排序为PG9>PG10>PG8>PG4>2>PG3>PG1>PG6>PG7>PG5。苔藓和裸土覆盖的PG4产流最大,其次为PG10(图 5)。同为柑橘树覆盖度较高的小区,PG2、PG3的产流量远低于PG8~10。草被覆盖度较高的小区(PG1、PG5~7)产流量较低。尽管PG2、PG3中裸土、农作物等高产流覆被类型面积较大,但产流量并不高,表明草被、农作物和柑橘等高带状套作可有效减少径流。因此,描述格局时需要考虑覆被类型对产流和产沙的“源”“汇”功能差异。

|
图 5 不同覆被配置径流深(a)和产沙模数(b) Fig. 5 Runoff depth (a) and sediment yield (b) in the experiment plots |
格局指数大多有特定的环境背景,使用时需检验区域适用性[15]。利用径流小区产流产沙量,检验前述指数的适用性。DLI和FDLI与产流产沙呈显著的对数关系(图 6),都能反映覆被配置格局的产流产沙差别,对产沙的指示效果优于产流。

|
图 6 径流深、产沙模数与植被配置格局指数之间的回归关系 Fig. 6 Regression between land cover pattern indices and runoff generation and sediment yield |
覆被配置影响产流和产沙对降雨的响应。通过降雨量与产流、产沙量之间的线性和指数回归方程的回归系数(R2)与格局指数做分析,反映覆被配置对降雨与产流产沙之间关系的影响。较高的R2表明降雨对产流、产沙与降雨的关系更符合特定的回归方程,较低的R2则表明这种关系受到较大的影响。随着DLI和FDLI的增大,产沙产流对降雨存在线性和指数响应的可能性降低(图 7和图 8)。DLI和FDLI较低时,产流产沙对降雨量的响应符合线性或指数关系。当DLI、FDLI较大时,产流产沙对降雨的响应难以用线性或者指数方程预测,水土保持功能低的配置响应降雨的不确定性更大。

|
图 7 覆被配置对降雨-产沙(a, b)和降雨-产流(c, d)线性回归的影响 Fig. 7 Effects of land cover pattern on rainfall-sediment (a, b)and rainfall-runoff (c, d) linear regression |

|
图 8 覆被配置对降雨-产沙(a、b)和降雨-产流(c、d)指数回归的影响 Fig. 8 Effects of land cover pattern on rainfall-sediment (a, b) and rainfall-runoff (c, d) exponential regression |
1) 降雨-产流和降雨-产沙线性回归系数随方向性渗透指数而变,表明覆被配置格局的差别影响产流、产沙对降雨的响应;随着方向性渗透指数的增大,产沙和产流对降雨存在线性和指数响应模式的可能性逐渐降低。这意味着地表覆被格局具有较强水土保持能力的时,产流产沙对降雨量的响应符合线性或指数关系,当覆被格局水土保持功能较低时,产流产沙对降雨的响应不确定性增大,难以用线性或者指数关系来预测。
2) DLI与产沙和产流呈显著的指数关系,而FDLI与产流产沙则呈显著的对数关系。整体而言都能反映红壤小区覆被格局带来的产流产沙效应差别;但FDLI的效果优于DLI,二者对产流的指示效果优于产沙,适用于红壤小区和坡面尺度。
| [1] |
OUYANG Wei, SKIDMORE A K, HAO Fanghua, et al. Soil erosion dynamics response to landscape pattern[J]. Science of the Total Environment, 2010, 408: 1358. DOI:10.1016/j.scitotenv.2009.10.062 |
| [2] |
刘宇, 吕一河, 傅伯杰. 景观格局-土壤侵蚀研究中景观指数的意义解释及局限性[J]. 生态学报, 2011, 31(1): 267. LIU Yu, LÜ Yihe, FU Bojie. Implication and limitation of landscape metrics in delineating relationship between landscape pattern and soil erosion[J]. Acta Ecologica Sinica, 2011, 31(1): 267. |
| [3] |
LIU Yu, FU Bojie, LÜ Yihe, et al. Linking vegetation cover patterns to hydrological responses using two process-based pattern indices at the plot scale[J]. Science China:Earth Sciences, 2013, 56(11): 1888. DOI:10.1007/s11430-013-4626-1 |
| [4] |
HECKMANN T, CAVALLI M, CERDAN O, et al. Indices of sediment connectivity:opportunities, challenges and limitations[J]. Earth-science Reviews, 2018, 187: 77. DOI:10.1016/j.earscirev.2018.08.004 |
| [5] |
LUDWIG J A, EAGER R W, BASTIN G N, et al. A leakiness index for assessing landscape function using remote sensing[J]. Landscape Ecology, 2002, 17(2): 157. DOI:10.1023/A:1016579010499 |
| [6] |
FU Bojie, ZHAO Wenwu, CHEN Liding, et al. A multiscale soil loss evaluation index[J]. Chinese Science Bulletin, 2006, 51(4): 448. DOI:10.1007/s11434-006-0448-2 |
| [7] |
IMESON A C, PRINSEN H A M. Vegetation patterns as biological indicators for identifying runoff and sediment source and sink areas for semi-arid landscapes in Spain[J]. Agriculture, Ecosystems & Environment, 2004, 104(2): 333. |
| [8] |
LUDWIG J A, EAGER R W, LIEDLOFF A C, et al. A new landscape leakiness index based on remotely sensed ground-cover data[J]. Ecological Indicators, 2006, 6(2): 327. DOI:10.1016/j.ecolind.2005.03.010 |
| [9] |
BAUTISTA S, MAYOR Á G, BOURAKHOUADAR J, et al. Plant spatial pattern predicts hillslope runoff and erosion in a semiarid Mediterranean landscape[J]. Ecosystems, 2007, 10(6): 987. DOI:10.1007/s10021-007-9074-3 |
| [10] |
赵其国, 黄国勤, 马艳芹. 中国南方红壤生态系统面临的问题及对策[J]. 生态学报, 2013, 33: 7615. ZHAO Qiguo, HUANG Guoqin, MA Yanqin. The problems in red soil ecosystem in southern of China and its countermeasures[J]. Acta Ecologica Sinica, 2013, 33(24): 7615. |
| [11] |
王学强, 蔡强国, 和继军. 红壤丘陵区水保措施在不同坡度坡耕地上优化配置的探讨[J]. 资源科学, 2007, 29(6): 68. WANG Xueqiang, CAI Qiangguo, HE Jijun. Water and soil conservation measures for different slope land in Red-Earth Hilly Region[J]. Resources Science, 2007, 29(6): 68. DOI:10.3321/j.issn:1007-7588.2007.06.010 |
| [12] |
袁久芹, 梁音, 曹龙熹, 等. 红壤坡耕地不同植物篱配置模式减流减沙效益对比[J]. 土壤, 2015, 47(2): 400. YUAN Jiuqin, LIANG Yin, CAO Longxi, et al. Comparison of benefits of runoff and sediment reduction of different hedgerow configuration modes in Red-soil Hilly Area[J]. Soils, 2015, 47(2): 400. |
| [13] |
李忠佩, 张桃林, 杨艳生, 等. 红壤丘陵区水土流失过程及综合治理技术[J]. 水土保持通报, 2001, 21(2): 12. LI Zhongpei, ZHANG Taolin, YANG Yansheng, et al. Process and comprehensively harnessing techniques of soil and water loss in Hilly Red Soil Regions[J]. Bulletin of Soil and Water Conservation, 2001, 21(2): 12. DOI:10.3969/j.issn.1000-288X.2001.02.004 |
| [14] |
MAYOR Á G, BAUTISTA S, SMALL E E, et al. Measurement of the connectivity of runoff source areas as determined by vegetation pattern and topography:A tool for assessing potential water and soil losses in drylands[J]. Water Resources Research, 2008, 44(10). |
| [15] |
CORRY R C, NASSAUER J I. Limitations of using landscape pattern indices to evaluate the ecological consequences of alternative plans and designs[J]. Landscape and Urban Planning, 2005, 72(4): 265. DOI:10.1016/j.landurbplan.2004.04.003 |