无人机遥感数据处理模型的计算精度分析——以引黄入冀补淀工程水土保持监测为例
阎世煜
1
,
王秀茹
1
,
王霄
2,
韩晓亮
1
1. 北京林业大学水土保持学院, 100083, 北京;
2. 河北省保定市一中577班, 071000, 河北保定
收稿日期:2018-11-05; 修回日期:2018-12-03
项目名称:水利部公益性行业科研专项"东北灌区节水灌溉生态效益评估"(201401001)
通信作者简介:王秀茹(1957-), 女, 博士, 教授。主要研究方向:水土保持与荒漠化防治, 流域管理。E-mail:
wang-xr@163.com
摘要:无人机遥感技术为生产建设项目水土保持监测提供了新的技术手段,特别是在计算弃土场面积和弃土量等方面极大地提高了监测效率和精度,但不同的无人机遥感数据处理模型的计算精度存在差异。本研究旨在对各数据处理模型的精度进行对比。作者以引黄入冀补淀工程为依托,选取5个典型弃土场,构建6组无人机遥感数据处理模型:Pho-Glo、Pho-Loc、Pho-Con、Pix-Glo、Pix-Loc、Pix-Con,对每个弃土场的面积、弃土量进行计算,对比分析不同模型计算结果的精度。结果表明:计算面积精度最高的模型为Pix-Con,误差为1.23%,精度最低的模型为Pho-Glo,误差为5.57%;计算弃土量精度最高的模型为Pix-Con,误差为2.97%,精度最低的模型为Pho-Loc,误差为10.28%。建议在生产建设项目中推广使用Pix-Con无人机遥感数据处理模型。
关键词:引黄入冀补淀工程 水土保持监测方法 无人机遥感技术 无人机遥感数据处理模型
Accuracy analysis of model processing UAV remote sensing data: A case study of soil and water conservation monitoring for the Yellow River-to-Baiyangdian Water Transfer Project
1. School of Soil and Water Conservation, Beijing Forestry University, 100083, Beijing, China;
2. Class 577, No.1 Middle School, Baoding City, 071000, Baoding, Hebei, China
生产建设项目水土保持监测是准确及时地反映项目区内水土流失状况的一项工作,对水土流失综合治理以及科学合理地布设水土保持措施具有重要意义[1-2]。弃土场面积和弃土量的监测是生产建设项目水土保持监测工作中的重要内容[3]。传统方法基于全站仪或其他测量仪器进行面积测算,误差约为5%[4];使用等高线法进行弃土量的计算,误差约为6%[5]。无人机遥感技术为弃土场监测提供了新的技术手段[6];但目前市场上有诸多无人机遥感数据处理软件,基于这些软件可以构建不同的无人机遥感数据处理模型,其计算精度存在差异,并且建模和使用成本差别较大,因此有必要对模型的精度和实用性进行比较分析,进而为推荐适宜在生产建设项目中推广使用的模型提供理论依据。
1 研究区概况
引黄入冀补淀工程的主输水线路总长482km,自河南省濮阳市渠村引黄闸引水,途经河南省濮阳市、河北省邯郸市、邢台市、衡水市、沧州市、保定市最终进入白洋淀[7]。本研究选取河南省濮阳市内的5个平地弃土场为研究对象,弃土场的位置及输水线路如图 1所示。
研究区位于华北平原,黄河下游北岸,地貌类型为平原,气候属暖温带大陆性季风气候,年平均气温13.4℃,年均降水量626mm。研究区内土壤成土母质主要是黄河冲积物,土壤可蚀性较高,属于河南省水土流失重点预防区,土壤侵蚀类型主要是水力侵蚀,容许土壤流失量为200t/(km2·a),土壤侵蚀强度属微度。
2 材料与方法
2.1 获取无人机遥感数据
本研究选取了渠首段1号弃土场,河南一标段2号、3号、4号弃土场,河南二标段2号弃土场为研究对象,并依次编号为1、2、3、4和5弃土场,它们位置相近、自然条件基本相同,并且在弃土前均为平地。无人机为大疆精灵4,搭载FC330镜头,符合《无人机航摄系统技术要求》中的相关规定。
依据航空摄影技术规范:航向重叠度不低于53%,一般应为60%~65%;旁向重叠度不低于13%,一般要求为30%~35%。本研究中设置航高为100m,航向重叠度为80%,旁向重叠度为40%,采用“Z”字型航线,拍摄正摄影像,得到分辨率为5472×3078的无人机遥感数据。
如图 2所示,采用光盘作为标记,在每个弃土场布设控制点和检查点。
使用差分式GPS采集地面控制点和检查点的经纬度及高程数据,控制点精度符合《低空数字航空摄影测量外业规范》中的相关规定。航图获取情况见表 1。
表 1(Tab. 1)

表 1 航图获取情况
Tab. 1 Acquisition of aeronautical chart
标段
Bid |
名称
Name |
位置
Location |
航片数
Number of aerial films |
控制点数量
Number of control points |
检查点数量
Number of checkpoints |
渠首段
Canal head |
1号渠村弃土场
Qucun disposal ground |
E115°01′21″
N35°23′19″ |
59 |
7 |
3 |
|
2号南湖弃土场
Nanhu disposal ground |
E114°59′44″
N35°23′32″ |
87 |
7 |
3 |
河南一标段
The first bid of Henan |
3号甘称湾弃土场
Ganchengwan disposal ground |
E114°59′38″
N35°24′35″ |
125 |
8 |
3 |
|
4号甘吕邱弃土场
Ganlüqiu disposal ground |
E115°00′23″
N35°25′45″ |
95 |
7 |
3 |
河南二标段
The second bid of Henan |
5号凌平弃土场
Lingping disposal ground |
E114°56′10″
N35°38′10″ |
42 |
6 |
3 |
|
表 1 航图获取情况
Tab. 1 Acquisition of aeronautical chart
|
2.2 构建数据处理模型
2.2.1 理论基础
本研究在试用和筛选多种相关软件后,采用PhotoScan和Pix4D对无人机遥感数据进行初步处理,得到弃土场的DOM和DSM影像,采用Global Mapper、LocaSpaceViewer和Context Capture对DOM和DSM影像进行提取信息,得到弃土场的面积和弃土量[8]。软件特点详见表 2。
表 2(Tab. 2)
表 2 软件特点对比
Tab. 2 Comparison of the software characteristics
| 软件Software |
优点Advantages |
缺点Shortcomings |
| PhotoScan |
三维建模效果好, 操作方便, 价格较低
Fine 3D modeling effect, easy to operate, and lower price |
确定地物位置准确度较低
The accuracy of determining the location the feature is low |
| Pix4D |
专门针对无人机的软件;可通过多张航图确定地物位置、精度高
Dedicated to UVA, and the determination of a position with high accuracy through multiple charts |
操作不便;价格较高;建模效果差
Inconvenient operation, high price, and poor 3D modeling |
| Global Mapper |
功能多, 操作方便, 兼容性好
More functions, easy to operate, and fine compatibility |
价格较高、不能对三维模型进行测量
High price and cannot measure for 3D model |
| LocaSpace Viewer |
国产软件、操作方便;可以基于DSM影像和三维模型进行测量;可免费获取
Domestic software, easy to operate, can be measured based on DSM images and 3D models, and free access |
精度较低、提取信息较慢
Low accuracy and slow extraction of information |
| Context Capture |
应用最广泛;可以基于DSM影像和三维模型进行测量;精度高
Most widely used, can be measured based on DSM images and 3D models, and high accuracy |
价格昂贵、操作不便、对硬件要求高
Expensive, inconvenient, and high hardware requirements |
|
表 2 软件特点对比
Tab. 2 Comparison of the software characteristics
|
2.2.2 模型构建
基于以上理论基础,构建出Pho-Glo、Pho-Loc、Pho-Con、Pix-Glo、Pix-Loc和Pix-Con 6组数据处理模型[9]。构建过程如图 3所示。
2.2.3 数据处理
将无人机航拍获取的原始影像代入模型,在影像中找到控制点,输入GPS记录的控制点实际经纬度及高程[10],即可进行初步处理,得到弃土场的DOM和DSM影像。将DOM影像和DSM影像叠加进行信息提取,通过DOM影像判断弃土场边界并进行勾画,利用数据处理模型即可提取出每个弃土场的面积和弃土量。
2.3 精度分析
2.3.1 DOM影像精度分析
DOM影像是计算弃土场面积、弃土量时的背景参考影像,这里采用外业实际检测的方法进行精度分析[11]。在拼接成的DOM影像上找到检查点,读取、记录它的经纬度,作为其影像值,把GPS实测检查点的经纬度作为其实测值,代入以下公式进行计算:
|
$
{m_x} = \pm \sqrt {\frac{{\sum\limits_{i = 0}^n {} {{({X_i} - {X_{i0}})}^2}}}{n}} ;
$
|
(1) |
|
$
{m_y} = \pm \sqrt {\frac{{\sum\limits_{i = 0}^n {} {{({Y_i} - {Y_{i0}})}^2}}}{n}} ;
$
|
(2) |
|
$
{m_{xy}} = \pm m_x^2 + m_y^2。$
|
(3) |
式中:Xi, Yi为检查点影像坐标,cm;Xi0, Yi0为检查点的实测坐标,cm;mx为X方向的精度,my为Y方向的精度,cm;mxy为影像的平面位置精度,cm;n为检查点个数。
2.3.2 弃土场面积、弃土量计算精度分析
6组模型计算面积的原理都是通过地物的地理位置信息确定两点之间的距离,再把需要量测的区域概化为多边形来计算面积;计算弃土量的原理是基于DOM和DSM影像将弃土场的表面概化成三角形(图 4)。通过下式计算若干个三棱柱的体积(图 5)并求和,从而得到弃土量[12],
|
$
{V_i} = {S_i}({h_1} + {h_2} + {h_3})/3;
$
|
(4) |
|
$
{S_0} = \sum\limits_{i = 1}^n {} {S_i};
$
|
(5) |
|
$
{V_0} = \sum\limits_{i = 1}^n {} {V_i}。$
|
(6) |
式中:Vi为每个三棱柱的体积,m3;Si为弃土场被划分成n个三棱柱后每个三棱柱的底面面积,m2;h1、h2和h3为三棱柱底面到各顶点的高,m;S0为弃土场的面积,m2;V0为弃土量,m3。
在计算弃土量时,不同数据处理模型将弃土场划分为三棱柱的密度不同,因此得到的结果也不同。本研究分别采用6组无人机遥感数据处理模型对5个弃土场的面积和弃土量进行计算,以施工单位计量值为基准值,分析每组模型计算结果的误差,得出精度最高的模型。之后使用R语言进行t值检验,可进一步分析得出构建模型过程中使用的每个软件精度情况。
3 结果分析
本次航拍5个弃土场得到的所有DOM影像精度达0.05m,DSM影像精度达0.20m,满足无人机在水土保持监测中应用的要求,模型计算弃土场面积结果如表 3所示,计算弃土场弃土量的结果如表 4所示。
3.1 DOM、DSM影像精度分析
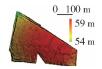
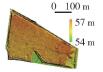
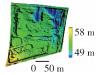
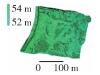
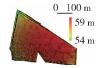
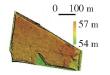
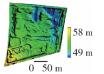
对比5个弃土场的DSM影像可以发现:2和5弃土场高程变化最小,弃土场内高差仅为2 m,使用PhotoScan和Pix4D得到的影像也最接近;1、3和4弃土场高程变化大,不同软件得到的DSM影像差别也大,说明弃土场高程变化越大,使用不同软件得到的DSM影像差别也越大。弃土场影像特征详见表 5。
表 5(Tab. 5)
表 5 弃土场影像特征
Tab. 5 Image characteristics of each disposal ground
弃土场编号
Disposal ground No. |
模型采用软件
Software used in the model |
高差
Height difference/m |
影像畸变情况
Image distortion |
| 1 |
PhotoScan |
4 |
弃土场的西北部明显产生畸变
Significant distortion in the northwest of the disposal ground |
| Pix4D |
4 |
边缘畸变较小,与实际情况更相符
The edge’s distortion is small and is more consistent with the actual situation. |
| 2 |
PhotoScan |
2 |
畸变较小、与实际情况相符
Distortion is small and consistent with the actual situation |
| Pix4D |
2 |
畸变较小、与实际情况相符
Distortion is small and consistent with the actual situation |
| 3 |
PhotoScan |
5 |
弃土场东部高程明显大于其他部位
The eastern elevation of the disposal ground is significantly larger than other parts |
| Pix4D |
3 |
东部未见高程明显增加
No significant elevation in the east oocurs |
| 4 |
PhotoScan |
4 |
东北部水坑及弃土场其他部位未发生明显畸变
No obvious distortion in the puddles and other parts of the northeast is observed |
| Pix4D |
9 |
东北部水坑畸变明显,DSM影像中高程明显低于实际情况
The puddle distortion in the northeast is obvious, and the elevation in the DSM image is lower than the actual situation. |
| 5 |
PhotoScan |
2 |
畸变较小、与实际情况相符
Distortion is small and consistent with the actual situation |
| Pix4D |
2 |
畸变较小、与实际情况相符
Distortion is small and consistent with the actual situation |
|
表 5 弃土场影像特征
Tab. 5 Image characteristics of each disposal ground
|
采用外业实际检测的方法对DOM影像进行精度分析,计算各个DOM影像中3个检查点的误差均值如图 6所示,并计算所有DOM影像中检查点误差的箱线图(图 7)。
从箱线图中可以看出,Pix4D处理得到的DOM影像误差低于PhotoScan产生的误差,这一结果和柱状图中表现出的信息相吻合。
参考《1:500 1:1000 1:2000地形图航空摄影测量数字化测图规范》中的规定,在平地和丘陵地中,地物点的位置误差不能超过0.6m。计算每个弃土场中3个检查点的误差均值,并将其作为该弃土场的位置误差。可以看出,PhotoScan和Pix4D处理得到的DOM影像精度均符合相关规范中的要求。
3.2 弃土场面积计算结果
基于表 3的计算结果做出箱线图如图 8所示。
计算弃土场面积精度最高的模型为Pix-Con,误差为1.23%,精度最低的模型为Pho-Glo,误差为5.57%;使用Pix4D进行初步处理的模型误差较小,并且误差分布较为集中,计算结果较为稳定; 使用PhotoScan进行初步处理的模型误差较大,且分布较为离散,计算结果不稳定。
基于R语言对误差进行t值检验。针对初步处理时使用的PhotoScan和Pix4D 2款软件产生的误差进行分析,经计算得到,二者产生误差的均值分别为1.82%和5.15%,并且2组数据差异显著(P<0.05);因此Pix4D软件产生的误差显著低于PhotoScan产生的误差。
同理,针对数据处理模型中用以提取信息的Global Mapper、LocaSpace Viewer、Context Capture 3款软件产生的误差进行分析。计算得到三者产生的误差均值分别为3.37%、4.05%和3.03%,对这3组数据两两进行t值检验,结果表明每2组数据之间差异均不显著(P>0.05),因此不能判定3种软件在计算面积时精度有显著不同。
3.3 弃土场弃土量计算结果
基于表 4的计算结果做出箱线图如图 9所示。
基于R语言对弃土量误差进行t值检验,原理、过程同3.2,结果如下:PhotoScan和Pix4D产生的误差分别为5.07%和8.03%,P<0.05,说明用数据处理模型计算弃土量时,使用Pix4D的模型精度显著高于使用PhotoScan的模型。Global Mapper、LocaSpace Viewer和Context Capture产生的误差分别为7.4%、8.4%和3.86%,对3组数据两两进行t值检验,使用Global Mapper的模型和使用LocaSpace Viewer的模型计算弃土量的精度没有显著区别,使用Context Capture的模型计算弃土量的精度显著高于其他模型。
4 讨论
1) 在计算面积时,使用Pix4D的模型精度显著高于使用PhotoScan的模型;但是Global Mapper、LocaSpace Viewer、Context Capture三者提取信息的差别不显著。这是因为误差主要来源于初步处理这一步骤,在获取DOM和DSM影像后,提取面积的技术已经较为成熟,因此提取信息时使用的3款软件并没有表现出显著差异。
2) 在计算弃土量时,使用Pix4D的模型精度显著高于使用PhotoScan的模型,这是因为Pix4D得到的影像精度较高、畸变较小;而Context Capture提取信息的精度也显著高于Global Mapper和LocaSpace Viewer,这是因为通过DSM影像计算弃土量的技术尚未足够成熟,不同模型提取信息的差别显著。
3) 采用不同模型处理得到的1、3和4号弃土场DSM影像高程差别较大,但在这种差别下最终计算结果也较为准确。这是因为无人机成像的特点是相对误差较小、绝对误差较大[13],这种误差相当于弃土场整体在空间中倾斜,因此对弃土量计算结果影响较小。
4) PhotoScan对拍摄区域的水面处理更准确,得到的DSM影像与实际情况更相符。
5) 由于本研究中采用单“Z”字型航线拍摄项目区,当项目区内高差较大时,主航线两侧高程将会呈现从一侧向另一侧逐渐增大或减小的趋势,如果采用双“Z”字型航线,即可消除这种误差。
6) 前人在2个弃土场基础上,利用微分法估算弃土量,以施工单位计量值为参考值计算误差,得到弃土量误差分别为10%和7.5%[14]。本研究通过构建无人机遥感数据处理模型,可以更准确地计算弃土场的弃土量,控制误差在3%左右。
7) 由于弃土场的空间尺度较为特殊,介于坡面尺度和流域尺度之间,因此传统的地面观测不是监测弃土场面积及弃土量的最佳方法。无人机遥感技术相比于传统地面监测具有准确、快捷、高效等优势,又能弥补传统遥感监测中高分影像成本过高且难以在第一时间获取所需影像的缺陷[15-16];因此,将无人机应用在弃土场监测中,可以快捷地获取弃土场高精度的遥感数据[17-18],进而应用数据处理模型,准确地得到弃土场的面积、弃土量[19-20]。
5 结论
1) 采用无人机数据处理模型计算弃土场的面积、弃土量时,Pix-Con模型的计算结果精度最高。
2) 如实际工作中只需获取项目区的DOM和DSM影像,则使用Pix4D得到的影像精度最高;但项目区内如有坑塘等水域,使用PhotoScan得到的DOM和DSM影像精度最高。
3) 如已经获取了项目区的DOM和DSM影像,只需计算弃土场的面积和弃土量,则使用Context Capture得到的结果精度最高。
4) 参考目前国内市场价格,构建文中的6组数据处理模型:Pho-Glo、Pix-Glo、Pho-Loc、Pix- Loc、Pho-Con和Pix-Con,费用分别为2.3万、8万、2.3万、8万、29.3万和35万元。Pix-Con模型虽然价格最高,但计算结果的精度也最高,并且其很多功能本研究并未使用,其应用潜力较大;因此推荐该模型在生产建设项目中推广使用。
 2019, Vol. 17