 2022,
Vol. 31
2022,
Vol. 31

2. 中国水产科学研究院南海水产研究所, 广东 广州 510300;
3. 农业农村部外海渔业开发重点实验室, 广东 广州 510300;
4. 广东省渔业生态环境重点实验室, 广东 广州 510300
早期渔业资源评估模型需要长期收集的历史数据,如捕捞努力量、长度组成和生活史特征信息,但是,大多数被开发的渔业资源缺少这些信息而无法进行定量评估。为此,诞生了基于长度频率的渔业资源评估方法。长期以来,长度频率被用于评估渔业资源状况并运用于渔业管理中。19世纪90年代,PETERSEN利用鱼类长度频率数据推断鱼类生长模式[1]。1987年,PAULY[1]指出电子长度频率分析法(ELEFAN Ⅰ)可提供鱼类和无脊椎动物的生长信息。国内外研究表明,通过不同组距重构长度频率,其组距的选择对种群参数的结果关联较大,如相差大的不同分组组距重构长度频率组成数据来估算种群参数有明显差异[2]。其中以10 mm组距重构长度频率估算主要经济鱼类的种群参数较多[3-13],但是10 mm组距不是唯一选择。如:舒黎明等[14]以5 mm为组距对银鲳(Pampus argenteus)进行体长频率整理,进而估算生长和死亡参数;朱清澄等[15]以20 mm为组距对真鲷(Pagrosomus major)体长进行分析,并对体长分布进行了差异性检验;JOHNSON等[16]以间距50 mm重构体长频率对鲔(Euthynnus affinis)进行种群参数分析。可见,渔业长度组距的确定是数据分析的基础。随着资源评估模型和计算机技术的不断发展,更简便快捷的评估方法出现。基于长度贝叶斯生物量估算法(length-based Bayesian biomass estimation method, LBB) 是一种除了长度频率数据外,不需要任何信息输入而实现对鱼类种群参数评估的新方法[17]。目前国内外学者广泛应用LBB方法估算鱼类种群参数。ZHAI等[18]利用此方法研究了中国沿海21种鱼类资源利用情况,WANG等[19]研究了渤海、黄海8种鱼类的种群动态,王雪辉等[20]以北部湾二长棘鲷(Parargyrops edita)为例利用LBB评估该种群资源状况。确定长度分组组距是应用长度频率分析法的重要步骤,但是针对长度组距对评估结果的影响研究较少。
竹䇲鱼(Trachurus japonicus)隶属于鲈形目(Perciformes)鲹科(Carangidae)竹䇲鱼属(Trachurus),为暖水性中上层鱼类,是北部湾的重要海洋经济种类之一[21],研究其渔业生物信息对其资源利用和管理有重要意义。在20世纪70年代后期,竹䇲鱼产量上升从而逐渐引起了人们的重视,但是大部分研究具有综合性,单独报道竹䇲鱼生物学信息的研究很少:曹宁等[22]对竹䇲鱼的开发利用进行了管理探讨;陈国宝等[23]利用FiSATⅡ对竹䇲鱼的生长和死亡参数进行估算,但研究并未涉及体长组距设置对评估的影响。为探究不同组距种群参数的差异,本研究根据2006—2018年北部湾竹䇲鱼生物学测定资料对该鱼类叉长分组重构,对比分析生长、死亡和性成熟参数估算结果,旨在为今后资源评估组距的选择提供参考。
1 材料与方法 1.1 数据所用竹䇲鱼生物学数据取自2006—2018年在北部湾进行的30个航次渔业资源调查,每个航次调查站位共52个。调查船为“北渔60011”底拖网渔船,总吨位242 t,长为36.8 m,宽为6.8 m,主机功率为441千瓦。采样网具为404型底拖网,上纲长度为37.7 m,网目尺寸20 cm,网囊网目尺寸3.9 cm,网衣长60.5 m[24]。采样及样本分析按照《海洋调查规范》(GB/T 12763.6—2007)进行。30个航次共采集竹䇲鱼样本11 726尾(表 1)。

|
表 1 采样航次、时间与样本量信息 Tab.1 Information of sampling voyage, sampling date and sampling size |
竹䇲鱼性腺根据Ⅰ-Ⅵ期成熟度标准进行划分,性腺发育在Ⅲ期及以上认为样本个体达到性成熟[25]。在计算初次性成熟叉长(L50)时使用每年的雌性样本。将叉长按每年3、5、10和15 mm划分区间,将区间内性腺成熟度在Ⅲ期及以上占该区间内全部个体数的百分比作为该长度区间的性成熟个体比例。将各区间性成熟个体比例与长度数据进行Logistic回归分析[26]。具体公式如下:
 (1)
(1)
式中:Pi为第i组性成熟个体占组内个体的相对频率;Li为第i组长度中值, mm;a与b为常数。初次性成熟叉长推算公式为
 (2)
(2)
以3、5、10和15 mm共4个组距分别进行叉长频率重构分组。运用LBB对竹䇲鱼叉长频率数据进行拟合分析,估算出不同组距重构长度频率的种群参数和相对生物量。与其他方法不同,LBB不需要其他数据信息的输入[27]。LBB方法的详细推导过程见文献[28],主要方程如下:
假设鱼类生长遵循vonBertalanffy生长方程[27]:
 (3)
(3)
式中:Lt为t龄时的长度;L∞为渐进叉长;k为达到L∞的速率;t0为鱼叉长为0时的年龄。
受部分选择影响的捕获数量可由方程(4)中的逻辑函数给出:
 (4)
(4)
式中: SL是长度为L渔具保留的个体比例;Lc为50%选择性的叉长;α为逻辑函数的陡峭度。
LP为保留在网具中概率P的鱼类叉长:
 (5)
(5)
 (6)
(6)
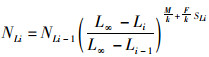
式中:NLi为长度组Li中的个体数,NLi-1是前一个长度组中的数字,所有其他参数如上所述。将方程(6)的两边除以它们各自的和,得到(7):
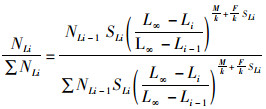 (7)
(7)
将方程(7)应用到长度频率数据,估算出M/k与F/k值,可得出F/M=(F/k)/(M/k)。
未开发世代生物量达到最大时的长度Lopt和最适开捕长度Lc_opt分别由(8)和(9)得出[29]:
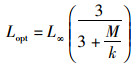 (8)
(8)
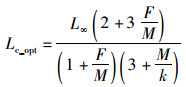 (9)
(9)
B0′为最初鱼类生物量,因此,B/B0的被开发部分的相对生物量为
 (10)
(10)
利用Excel 2019完成长度数据的整理。通过蒙特卡洛马尔科夫链(Monte Carlo Markov Chain,MCMC)进行抽样拟合,在统计语言R 3.6.1中调用JAGS执行[30-31],LBB包下载自http://oceanrep.geomar.de/id/eprint/44832。
2 结果 2.1 群体组成从表 2看出,2006—2018年竹䇲鱼总叉长为75~285 mm,优势叉长组为129~139 mm,平均叉长为134 mm。最小优势叉长组为99~109 mm,占20.42%;最大优势叉长组为149~159 mm,占18.88%。

|
表 2 2006—2018年竹䇲鱼群体组成 Tab.2 Population composition of T.japonicus from 2006 to 2018 |
竹䇲鱼雌雄个体性比为1∶ 0.57,雌性竹䇲鱼个体多于雄性。将2 227尾雌性竹䇲鱼按不同组距通过逻辑斯蒂模型估算其初次性成熟叉长(图 1),得到3、5、10和15 mm体长组的初次性成熟叉长分别为157、158、159、162 mm,4个组距的L50较为接近为157~162 mm,平均159 mm(SE=1.20)。

|
图 1 竹䇲鱼性成熟比例观测值与拟合的逻辑斯蒂曲线 Fig. 1 Observed proportion of mature individuals and curves fitted by Logistic models of T. japonicus in the Beibu Gulf |
L∞和M/k分别为248(241~256) mm和1.38 (1.16~1.55),总体上呈下降趋势。Lc_opt、F/k、Z/k和F/M存在相同的变化趋势,即组距越大估算值越大,估算值分别为156(145~173) mm、8.28 (5.30~11.21)、6.92 (3.75~10.11)和8.14 (2.55~20.06)。
渔业资源状况指标开发率(E)和B/B0分别为0.69 (0.61~0.75)和0.22 (0.18~0.26)。可见,不同组距的E均大于0.5,而B/B0则均小于0.5,说明北部湾竹䇲鱼资源已明显衰退。
2.4 不同组距种群参数的年际变化2006—2018年不同组距竹䇲鱼种群参数估算结果见图 2。结果显示:2006—2010年,L∞、Lc_opt、F/k、Z/k和E呈现上升的趋势;2010—2018年间,这些主要表现为下降趋势。图 2a,以3 mm为组距重构竹䇲鱼体长频率,估算出渐进叉长L∞范围为194~340 mm,在4个组距中叉长范围跨度最大,以5、10和15 mm为组距估算的L∞分别为200~292 mm、205~336 mm、212~290 mm;在4个组距中,最适开捕叉长Lc_opt大小依次为15 mm>3 mm>10 mm>5 mm;M/k在4个组距中1.5上下波动,其中15 mm组距波动最大。总体上,L∞在不同组距均表现较为稳定,而Lc_opt、F/k、Z/k和E等参数随组距的增大波动较为明显。

|
图 2 竹䇲鱼种群参数的年际变化 Fig. 2 Interannual fluctuations of population parameters of T.japonicus |
科学的渔业资源管理是基于渔业信息参考点对资源状况的精确评估。然而,评估过程中有许多因素导致评估结果存在差异,主要包括:数据质量和数量[32]、生长方程形式[33]、数据可用性、历史数据不足[34]和渔业开发历史[35]等。而数据缺乏的渔业资源评估与管理一直以来具有相当大的挑战,评估结果存在很大的不确定性。由于鱼类个体长度较易获取,因此基于长度频率的渔业资源评估是数据受限资源评估的一大热点,并得到运用和推广。如SUN等[36]评估了数据有限方法对从长度频率估计鱼类生命历史参数的敏感性。虽然长度数据容易获得,但是在捕捞过程中易产生误差,例如渔具的选择性。另外,不同组距的长度频率分布是导致评估结果存在差异的另一重要因素[37]。理论上,只要鱼类样本量大,构成样本组成的频率组距越小,组数越多,则越能反映出捕捞群体组成的分布特征。但是,在抽样的过程中样本是有限的,甚至很少。LBB方法为一些缺乏数据信息的鱼类资源提供了新的评估手段,该方法只需鱼类的长度数据。但是,长度数据在取样的过程中存在测量误差和每年获取到的样本量不均衡,大小个体相差较大等都可能造成长度频率分布的偏差[38],从而影响种群参数估算结果。因此,长度频率数据的代表性决定评估结果的准确性。通过分析不同组距竹䇲鱼种群参数的估算结果,发现样本组距和组数的确定是基于长度频率法资源评估的一个重要环节。

|
表 3 运用LBB方法估算不同组距的种群参数 Tab.3 Estimation results of population parameters by LBB based on different intervals |
北部湾竹䇲鱼叉长范围为75 ~ 285 mm,平均叉长134 mm,优势叉长组129 ~ 139 mm。卢振彬等[39]和贾晓平等[40]研究的竹䇲鱼平均长度分别为206和154 mm,两者均大于本研究的134 mm。本研究竹䇲鱼渐进叉长介于241~246 mm,小于历史研究结果。研究表明,北部湾竹䇲鱼个体小型化趋势明显。鱼类群体结构小型化是渔业资源衰退的指标之一,该现象是中国近海主要经济鱼类的共性,如小黄鱼[41]、短尾大眼鲷[42]和二长棘犁齿鲷[13]等均出现群体小型化的趋势。因此,严格执行网具的网目尺寸标准和控制捕捞强度势在必行。
3.2 不同方法种群参数比较本研究中,通过LBB估算的竹䇲鱼L∞范围为240~255 mm,其他两种方法(ELEFAN Ⅰ和鳞片年轮)相比,发现竹䇲鱼的L∞低于以往估算值。这可能与南海北部沿岸海域渔业资源已处于过度开发状态有关,从而渔获物个体逐渐小型化,种类更替明显,大型鱼类种类数量严重下降[43-44]。本研究中,LBB估算结果低于或高于ELEFAN Ⅰ。有研究者[45]认为电子长度频率分析ELEFAN Ⅰ中移动平均值的设置具有重要作用,其设置具有主观性,这可能是ELEFAN Ⅰ和LBB估算结果存在差异的一个原因。一般地,典型鱼类自然死亡率M/k的值为1.0~2.0[46],可判断自然死亡率M估算的可靠性。但是这个区间不是一定的,M/k的值因鱼种不同也会有所差异[47]。因此,本研究所估算的M/k范围1.16~1.55并不能准确代表当前竹䇲鱼的自然死亡状况,还需进一步探究。捕捞死亡率F/k和E则与WANG等[48]的估算结果接近,比较能够代表北部湾竹䇲鱼捕捞强度和实际开发状况。
3.3 竹䇲鱼资源开发状况分析陈国宝等[23]根据1997—1999年南海北部竹䇲鱼的生物学数据,运用ELEFAN Ⅰ技术估算其生长和死亡参数,并建议南海北部湾竹䇲鱼的最适开捕体长为148 mm。陈丕茂[49]建议最适开捕体长为185 mm。本研究估算竹䇲鱼Lc_opt范围为156 (145~173) mm。为保障鱼类有较充足的补充群体,通常认为鱼类在捕捞前至少需产卵一次,这样才能有效维持渔业资源的可持续利用。本研究的Lc_opt理论值为156 (145 ~173) mm,估算L50范围为159 (157~162) mm,为了更好地合理开发竹䇲鱼资源,建议竹䇲鱼的最小开捕叉长为159 mm。
一般认为,鱼类资源最适开发率为0.5[50],本研究估算开发率范围为0.61~0.75,说明北部湾竹䇲鱼处于过度开发状态。近年来,中国政府出台控制渔船功率和渔船数量增长措施,并延长伏季休渔政策,使近海捕捞压力有所缓解,从近年广西和海南的海洋捕捞机动渔船变化趋势也可证实出台政策的实际效果[20]。北部湾为中国和越南两国渔民生产作业的海域,虽然中国的捕捞压力得到控制,但越南在北部湾的捕捞强度没有缓解且有上升趋势[20]。因此,北部湾总体捕捞压力并没有得到有效的控制。
3.4 分组组距根据图 2,L∞在不同组距均表现较为稳定,而Lc_opt、F/k、Z/k和E等参数随组距的增大波动较为明显。可以得出组距越大,种群参数结果差异明显。因此,对于确定一个合理长度分组组距是非常有必要的。根据《国家海洋调查规范》,通常以10 mm作为鱼类长度分组组距,也提出对于过长或过短的鱼类可分别采用组距20 mm、5 mm[51]。但是,没有具体界定何种鱼类应该用多大组距是最佳选择。从本文来看,可以看到图 2c中15 mm组距估算结果存在负值,这可能是组距大的原因导致长度频率分布偏差。今后应当考虑叉长数据、样本数量和应用方法等影响因素共同确定一个组距的划分。
3.5 LBB方法的优缺点虽然目前有较多基于长度、渔获量或产量的渔业资源评估模型应用于评估数据有限的渔业资源,但是这些评估模型存在一定的局限性。例如,DCAC(depletion corrected average catch model)对于自然死亡系数大于0.2y-1的种群不适用[52],LIME(length-based integrated mixed effects)方法较适用于短寿命的鱼类[27]。相较而言,LBB方法是一种基于长度简单快捷的资源评估方法,不需要较多初始数据信息的输入。但是也存在一定的局限性,估算结果可能存在不理想状态。
研究[53]表明,长度组成变异系数较低的物种可以在相同水平的样本量下表现更好。本文每年所用样本量大小水平存在不平衡,因此,单个以CV指标判别不同组距对长度组成估算结果的影响较为片面。其次,大型鱼类和小型鱼类描述长度频率分布的适当样本大小是不一样的,对小型鱼类而言,300~400个样本量是适当样本大小[53]。研究[54]发现,很多鱼类在达到L∞前就会死亡,所以长度频率会向首次捕获时的长度偏移。由于样本量大小的不平衡和缺乏首次捕获鱼类长度信息,今后还需加强在鱼类样本量、种群组成和其他不同影响因素等方面的研究。
综上所述,LBB方法在热带渔业资源评估中具有一定的应用优势。其次,种群参数的准确度受不同因素影响,本文主要考虑不同组距下种群参数结果差异,但是未对不同组距的种群参数结果以及该鱼种的资源评估和管理产生何种影响进行深入研究。因此,建议在以后的竹䇲鱼资源评估中,可以综合考虑样本量、长度组成和其他因素的影响。
| [1] |
PAULY D. A review of the ELEFAN system for analysis of length-frequency data in fish and aquatic invertebrates: length-based methods in fisheries research[C]//ICLARM Conference Proceedings 13. ICLARM, 1987: 7-34.
|
| [2] |
陈国宝, 李永振, 陈丕茂, 等. 鱼类最佳体长频率分析组距研究[J]. 中国水产科学, 2008, 15(4): 659-666. CHEN G B, LI Y Z, CHEN P M, et al. Optimum interval class size of length-frequency analysis of fish[J]. Journal of Fishery Sciences of China, 2008, 15(4): 659-666. DOI:10.3321/j.issn:1005-8737.2008.04.018 |
| [3] |
陈作志, 邱永松. 北部湾二长棘鲷生长和死亡参数估计[J]. 水产学报, 2003, 27(3): 251-257. CHEN Z Z, QIU Y S. Esitimationof growth and mortality parameters of Parargyrops edita Tanaka in Beibu Bay[J]. Journal of Fisheries of China, 2003, 27(3): 251-257. |
| [4] |
何宝全, 李辉权. 珠江河口棘头梅童鱼的资源评估[J]. 水产学报, 1988, 12(2): 125-134. HE B Q, LI H Q. Stock assessment of Collichthys lucidus in pearl river esturary[J]. Journal of Fisheries of China, 1988, 12(2): 125-134. |
| [5] |
陈国宝, 李永振, 陈丕茂. 南海北部陆架区海域蓝圆鲹产卵场的研究[J]. 热带海洋学报, 2003, 22(6): 22-28. CHEN G B, LI Y Z, CHEN P M. A study on spawning ground of blue mackerel scad (Decapterus maruadsi) in continental shelf waters of northern South China Sea[J]. Journal of Tropical Oceanography, 2003, 22(6): 22-28. DOI:10.3969/j.issn.1009-5470.2003.06.004 |
| [6] |
孙典荣, 邱永松. 南海北部大陆架短尾大眼鲷生长和死亡参数估计[J]. 湛江海洋大学学报, 2004, 24(1): 28-34. SUN D R, QIU Y S. Estimation of growth and mortality parameters of Priacanthus macracanthus in the north continental shelf of South China Sea[J]. Journal of Zhanjiang Ocean University, 2004, 24(1): 28-34. DOI:10.3969/j.issn.1673-9159.2004.01.005 |
| [7] |
王雪辉, 邱永松, 杜飞雁. 南海北部金线鱼生长、死亡和最适开捕体长研究[J]. 中国海洋大学学报, 2004, 34(2): 224-230. WANG X H, QIU Y S, DU F Y. Study on the growth, mortality and optimum catchable size of Nemipterus virgatus in the northern South China Sea[J]. Journal of Ocean University of China, 2004, 34(2): 224-230. |
| [8] |
舒黎明, 邱永松. 南海北部多齿蛇鲻生物学分析[J]. 中国水产科学, 2004, 11(2): 154-158. SHU L M, QIU Y S. Biology analysis of Saurida tumbil in northern South China Sea[J]. Journal of Fishery Sciences of China, 2004, 11(2): 154-158. DOI:10.3321/j.issn:1005-8737.2004.02.012 |
| [9] |
朱江峰, 邱永松. 南海北部带鱼生长死亡与参数动态综合模式[J]. 海洋学报, 2005, 27(6): 93-99. ZHU J F, QIU Y S. Growth and mortality of hairtails and their dynamic pool models in the northern South China Sea[J]. Acta Oceanologica Sinica, 2005, 27(6): 93-99. DOI:10.3321/j.issn:0253-4193.2005.06.012 |
| [10] |
刘金殿, 卢伙胜, 朱立新, 等. 北部湾多齿蛇鲻雌雄群体组成、生长、死亡特征的差异[J]. 海洋渔业, 2009, 31(3): 243-253. LIU J D, LU H S, ZHU L X, et al. The difference of growth, mortality and group composition between female and male Saurida tumbil in the Beibu Gulf[J]. Marine Fisheries, 2009, 31(3): 243-253. DOI:10.3969/j.issn.1004-2490.2009.03.004 |
| [11] |
李忠炉, 卢伙胜, 甘喜萍, 等. 北部湾口海域深水金线鱼生长和死亡研究[J]. 水产科学, 2009, 28(10): 556-562. LI Z L, LU H S, GAN X P, et al. Growth and mortality of bottom threadfin bream Nemipterus bathybius in the mouth of Beibu Gulf, South China Sea[J]. Fisheries Science, 2009, 28(10): 556-562. DOI:10.3969/j.issn.1003-1111.2009.10.002 |
| [12] |
周丛羽, 王迎宾, 郑基. 叉长频数数据误差对东海中部鲐鱼资源评估结果的影响[J]. 海洋湖沼通报, 2015(4): 89-95. ZHOU C Y, WANG Y B, ZHENG J. Influence of fork length frequency data error on stock assessment result of chub mackerel in middle East China Sea[J]. Transactions of Oceanology and Limnology, 2015(4): 89-95. |
| [13] |
张魁, 陈作志, 邱永松. 北部湾二长棘犁齿鲷生长、死亡和性成熟参数的年际变化[J]. 南方水产科学, 2016, 12(6): 9-16. ZHANG K, CHEN Z Z, QIU Y S. Decadal changes in growth, mortality and maturity parameters of Evynnisc ardinalis in Beibu Gulf[J]. South China Fisheries Science, 2016, 12(6): 9-16. DOI:10.3969/j.issn.2095-0780.2016.06.002 |
| [14] |
舒黎明, 邱永松. 珠江河口及其附近水域银鲳生长与死亡参数估计[J]. 水产学报, 2005, 29(2): 193-197. SHU L M, QIU Y S. Estimation of growth and mortality parameters for Pampus argenteus in pearl river estuary and adjacent waters[J]. Journal of Fisheries of China, 2005, 29(2): 193-197. |
| [15] |
朱清澄, 孙栋, 花传祥, 等. 西非近海真鲷生物学特征的初步研究[J]. 大连海洋大学学报, 2015, 30(6): 686-691. ZHU Q C, SUN D, HUA C X, et al. Biological characteristics of red sea bream Pagrosomus major in coastal waters of West Africa[J]. Journal of Dalian Fisheries University, 2015, 30(6): 686-691. |
| [16] |
JOHNSON M G, TAMATAMAH A R. Length frequency distribution, mortality rate and reproductive biology of kawakawa (Euthynnus affinis-Cantor, 1849) in the coastal waters of Tanzania[J]. Pakistan Journal of Biological Sciences, 2013, 16(21): 1270-1278. DOI:10.3923/pjbs.2013.1270.1278 |
| [17] |
FROESE R, WINKER H, CORO G, et al. A new approach for estimating stock status from length frequency data[J]. ICES Journal of Marine Science, 2018, 75(6): 2004-2015. DOI:10.1093/icesjms/fsy078 |
| [18] |
ZHAI L, PAULY D. Construction and interpretation of particle size distribution spectra from 19 ecopath models of Chinese coastal ecosystems[J]. Frontiers in Marine Science, 2020, 7: 298. DOI:10.3389/fmars.2020.00298 |
| [19] |
WANG Y B, WANG Y C, LIU S D, et al. Stock assessment using LBB method for eight fish species from the Bohai and Yellow seas[J]. Frontiers in Marine Science, 2020, 7: 164. DOI:10.3389/fmars.2020.00164 |
| [20] |
王雪辉, 邱永松, 杜飞雁, 等. 基于长度贝叶斯生物量法估算北部湾二长棘鲷种群参数[J]. 水产学报, 2020, 44(10): 1654-1662. WANG X H, QIU Y S, DU F Y, et al. Using length-based Bayesian biomass method to estimate Parargyrops edita population parameters in the Beibu Gulf, South China Sea[J]. Journal of Fisheries of China, 2020, 44(10): 1654-1662. |
| [21] |
晏然, 范江涛, 陈作志, 等. 南海北部近海竹?鱼资源密度的概率分布型特征[J]. 中国水产科学, 2019, 26(1): 91-98. YAN R, FAN J T, CHEN Z Z, et al. The probability distribution of the jack mackerel (Trachurus japonicus) density in the offshore of the northern South China Sea[J]. Journal of Fishery Sciences of China, 2019, 26(1): 91-98. |
| [22] |
曹宁, 高健. 东海竹?鱼的开发利用和区域共同管理探讨[J]. 渔业经济研究, 2006(5): 25-29. CAO N, GAO J. Study on utilization and regional cooperation management of Trachurus japonicus in the East China Sea[J]. Fisheries Economy Research, 2006(5): 25-29. |
| [23] |
陈国宝, 邱永松. 南海北部竹?鱼的生长、死亡及合理利用[J]. 湛江海洋大学学报, 2004, 24(1): 35-40. CHEN G B, QIU Y S. Growth, mortality and rational utilization of horse mackerel in northern South China Sea[J]. Journal of Zhanjiang Ocean University, 2004, 24(1): 35-40. DOI:10.3969/j.issn.1673-9159.2004.01.006 |
| [24] |
王雪辉, 邱永松, 杜飞雁, 等. 北部湾鱼类多样性及优势种的时空变化[J]. 中国水产科学, 2011, 18(2): 427-436. WANG X H, QIU Y S, DU F Y, et al. Spatio-temporal variability of fish diversity and dominant species in the BeibuGulf[J]. Journal of Fishery Sciences of China, 2011, 18(2): 427-436. |
| [25] |
史登福, 张魁, 蔡研聪, 等. 南海北部带鱼群体结构及生长、死亡和性成熟参数估计[J]. 南方水产科学, 2020, 16(5): 51-59. SHI D F, ZHANG K, CAI Y C, et al. Population structure of Trichiurus japonicus in northern South China Sea and parameters of its growth, mortality and maturity[J]. South China Fisheries Science, 2020, 16(5): 51-59. |
| [26] |
郜星晨, 姜伟, 白云钦, 等. 长江宜昌段鲢的繁殖生物学特征[J]. 动物学杂志, 2018, 53(2): 198-206. GAO X C, JIANG W, BAI Y Q, et al. Reproductive biology of Hypophthalmichthys molitrix in the Yichang of the Yangtze River[J]. Chinese Journal of Zoology, 2018, 53(2): 198-206. |
| [27] |
PONS M, COPE J M, KELL L T. Comparing performance of catch-based and length-based stock assessment methods in data-limited fisheries[J]. Canadian Journal of Fisheries and Aquatic Sciences, 2020, 77(6): 1026-1037. DOI:10.1139/cjfas-2019-0276 |
| [28] |
SIEGFRIED K I, SANSÓ B. Two Bayesian methods for estimating parameters of the von Bertalanffy growth equation[J]. Environmental Biology of Fishes, 2006, 77(3/4): 301-308. |
| [29] |
BEVERTON R J H. Patterns of reproductive strategy parameters in some marine teleost fishes[J]. Journal of Fish Biology, 1992, 41(sB): 137-160. DOI:10.1111/j.1095-8649.1992.tb03875.x |
| [30] |
PLUMMER M. JAGS: a program for analysis of Bayesian graphical models using Gibbs sampling[C]//Proceedings of the 3rd International Workshop on Distributed Statistical Computing. Vienna, 2003.
|
| [31] |
ALBERT J H. Bayesian estimation of normal ogive item response curves using Gibbs sampling[J]. Journal of Educational Statistics, 1992, 17(3): 251-269. DOI:10.3102/10769986017003251 |
| [32] |
ARNOLD L M, HEPPELL S S. Testing the robustness of data-poor assessment methods to uncertainty in catch and biology: a retrospective approach[J]. ICES Journal of Marine Science, 2015, 72(1): 243-250. DOI:10.1093/icesjms/fsu077 |
| [33] |
徐海龙, 陈勇, 陈新军, 等. 引入不确定性对von Bertalanffy生长方程关系参数估算的影响[J]. 水产科学, 2016, 35(2): 169-173. XU H L, CHEN Y, CHEN X J, et al. Impacts of uncertainty on estimated parameters in von Bertalanffy growth function[J]. Fisheries Science, 2016, 35(2): 169-173. |
| [34] |
陈宁, 徐宾铎, 薛莹, 等. 捕捞数据不确定下蓝点马鲛渔业管理策略评估[J]. 水产学报, 2018, 42(7): 1154-1167. CHEN N, XU B D, XUE Y, et al. Management strategy evaluation of mackerel (Scomberomorus niphonius) fishery with uncertainty of catch data[J]. Journal of Fisheries of China, 2018, 42(7): 1154-1167. |
| [35] |
CHRYSAFI A, KUPARINEN A. Assessing abundance of populations with limited data: lessons learned from data-poor fisheries stock assessment[J]. Environmental Reviews, 2016, 24(1): 25-38. DOI:10.1139/er-2015-0044 |
| [36] |
SUN M, ZHANG C L, CHEN Y, et al. Assessing the sensitivity of data-limited methods (DLMs) to the estimation of life-history parameters from length-frequency data[J]. Canadian Journal of Fisheries and Aquatic Sciences, 2018, 75(10): 1563-1572. DOI:10.1139/cjfas-2017-0325 |
| [37] |
SCHWAMBORN R, MILDENBERGER T K, TAYLOR M H. Assessing sources of uncertainty in length-based estimates of body growth in populations of fishes and macroinvertebrates with bootstrapped ELEFAN[J]. Ecological Modelling, 2019, 393: 37-51. DOI:10.1016/j.ecolmodel.2018.12.001 |
| [38] |
叶婷, 王迎宾, 周丛羽. 鱼类体长频率数据结构对生长参数估算的影响分析[J]. 水产科学, 2014, 33(5): 277-282. YE T, WANG Y B, ZHOU C Y. Analysis of effects of fish length frequency data on estimates of growth parameters[J]. Fisheries Science, 2014, 33(5): 277-282. DOI:10.3969/j.issn.1003-1111.2014.05.003 |
| [39] |
卢振彬, 戴泉水, 朱进福, 等. 福建近海渔业资源结构及其主要种群生态的变化[J]. 福建水产, 1999(3): 1-7. LU Z B, DAI Q S, ZHU J F, et al. Change in structure of the fisheries resources and ecology of the major population in Fujian offshore waters[J]. Journal of Fujian Fisheries, 1999(3): 1-7. |
| [40] |
贾晓平, 李纯厚, 林昭进, 等. 北部湾渔业生态环境与渔业资源[M]. 北京: 科学出版社, 2003: 130-132. JIA X P, LI C H, LIN Z J, et al. Fishery ecological environment and fishery resources in Beibu gulf[M]. Beijing: Science Press, 2003: 130-132. |
| [41] |
林龙山, 程家骅. 东海区小黄鱼渔业生物学现状的分析[J]. 中国海洋大学学报, 2004, 34(4): 565-570. LIN L S, CHENG J H. An analysis of the current situation of fishery biology of small yellow croaker in the East China Sea[J]. Periodical of Ocean University of China, 2004, 34(4): 565-570. |
| [42] |
张魁, 陈作志, 王跃中, 等. 北部湾短尾大眼鲷群体结构及生长、死亡和性成熟参数估计[J]. 热带海洋学报, 2016, 35(5): 20-28. ZHANG K, CHEN Z Z, WANG Y Z, et al. Population structure of Priacanthus macracanthus in the Beibu Gulf, and parameters for its growth, mortality and maturity[J]. Journal of Tropical Oceanography, 2016, 35(5): 20-28. |
| [43] |
晏然. 南海北部近海竹荚鱼资源密度分布特征及栖息地模型构建[D]. 上海: 上海海洋大学, 2019. YAN R. Density distribution and habitat model construction of the jack mackerel (Trachurus japonicus) in the northern South China Sea[D]. Shanghai: Shanghai Ocean University, 2019. |
| [44] |
郑彤, 唐议. 我国南海区海洋捕捞渔船现状分析[J]. 上海海洋大学学报, 2016, 25(4): 620-627. ZHENG T, TANG Y. Analysis of current status of Chinese marine fishing fleet of South China Sea area[J]. Journal of Shanghai Ocean University, 2016, 25(4): 620-627. |
| [45] |
李壮, 刘群. 应用渔业体长分析方法ELEFAN和SLCA估算鱼类生长参数的研究[J]. 海洋湖沼通报, 2007(3): 81-87. LI Z, LIU Q. A study of ELEFAN and SLCA for estimating growth parameters[J]. Transactions of Oceanology and Limnology, 2007(3): 81-87. DOI:10.3969/j.issn.1003-6482.2007.03.013 |
| [46] |
FROESE R, WINKER H, CORO G, et al. On the pile-up effect and priors for Linf and M/K: response to a comment by Hordyk et al. on "A new approach for estimating stock status from length frequency data"[J]. ICES Journal of Marine Science, 2019(2): 2. |
| [47] |
HORDYK A R, PRINCE J D, CARRUTHERS T R, et al. Comment on "A new approach for estimating stock status from length frequency data" by Froese et al. (2018)[J]. ICES Journal of Marine Science, 2019, 76(2): 457-460. DOI:10.1093/icesjms/fsy168 |
| [48] |
WANG X H, QIU Y S, DU F Y, et al. Population parameters and dynamic pool models of commercial fishes in the Beibu Gulf, northern South China Sea[J]. Chinese Journal of Oceanology and Limnology, 2012, 30(1): 105-117. DOI:10.1007/s00343-012-1017-y |
| [49] |
陈丕茂. 南海北部主要捕捞种类最适开捕规格研究[J]. 水产学报, 2004, 28(4): 393-400. CHEN P M. Optimum first capture standards of major capture species of the northern South China Sea[J]. Journal of Fisheries of China, 2004, 28(4): 393-400. |
| [50] |
GULLAND J A. Fish stock assessment: a manual of basic methods[M]. Chichester: Wiley, 1983: 1-223.
|
| [51] |
国家技术监督局. GB/T 12763.6-1991海洋调查规范海洋生物调查[S]. 北京: 中国标准出版社, 1991. The State Bureau of Quality and Technical Supervision. GB/T 12763.6-1991 The specification for oceanographic survey-Marine biological survey[S]. Beijing: Standards Press of China, 1991. |
| [52] |
石永闯, 樊伟, 张衡, 等. 适用于数据缺乏渔业的资源评估方法研究进展[J]. 中国水产科学, 2021, 28(5): 673-691. SHI Y C, FAN W, ZHANG H, et al. Review on stock assessment methods applicable to data-limited fisheries[J]. Journal of Fishery Sciences of China, 2021, 28(5): 673-691. |
| [53] |
WANG J Q, XU L L, LI B, et al. An evaluation of the effects of sample size on estimating length composition of catches from tuna longline fisheries using computer simulations[J]. Aquaculture and Fisheries, 2020, 5(3): 122-130. DOI:10.1016/j.aaf.2019.09.001 |
| [54] |
GULLAND J A, ROSENBERG AA. A review of length-based approaches to assessing fish stocks[R]. Rome: Food and Agriculture Organization, 1992.
|
 ,
WANG Xuehui2,3
,
WANG Xuehui2,3 ,
DU Feiyan2,4,
SUN Dianrong2,3,
WANG Yuezhong2,3,
CHEN Xinjun1,
QIU Yongsong2,3
,
DU Feiyan2,4,
SUN Dianrong2,3,
WANG Yuezhong2,3,
CHEN Xinjun1,
QIU Yongsong2,3
2. South China Sea Fisheries Research Institute, Chinese Academy of Fishery Sciences, Guangzhou 510300, Guangdong, China;
3. Key Laboratory of Open-Sea Fishery Development, Ministry of Agriculture and Rural Affairs, Guangzhou 510300, Guangdong, China;
4. Guangdong Provincial Key Laboratory of Fishery Ecology and Environment, Guangzhou 510300, Guangdong, China