 2016, Vol. 30
The Chinese Meteorological Society
Article Information
- ZHANG Yijun, LÜ Weitao, CHEN Shaodong, ZHENG Dong, ZHANG Yang, YAN Xu, CHEN Lüwen, DONG Wansheng, DAN Jianru, PAN Hanbo . 2016.
- A Review of Advances in Lightning Observations during the Past Decade in Guangdong, China. 2016.
- J. Meteor. Res., 30(5): 800-819
- http://dx.doi.org/10.1007/s13351-016-6928-7
Article History
- Received March 8, 2016
- in final form May 20, 2016


2. Guangzhou Institute of Tropical and Marine Meteorology/Key Laboratory of Regional Numerical Weather Prediction, China Meteorological Administration, Guangzhou 510080;
3. Conghua Meteorological Bureau, Guangzhou 510900
The occurrence of lightning can generate large currents and strong electromagnetic radiation, resulting in casualties and a variety of serious disasters. However, so far, our understanding of lightning physics, the lightning attachment process, and the disaster-causing mechanisms remains limited, mainly because the considerable randomness and transience of lightning occurrence require a substantial amount of field observations. Recently, the international lightning research community has been involved in a number of comprehensive lightning observing experiments. For instance, the DARPA (Defense Advanced Research Projects Agency) NIMBUS observation program, implemented in 2010, focuses on lightning initiation, propagation, the connection process, the electrical effects of lightning in the upper atmosphere, lightning energy radiation characteristics and mechanisms, and lightning disaster prevention measures (Gamerota et al., 2014; Cummer et al., 2015). Because artificially triggered lightning allows direct measurement of the lightning current, as well as controlled observations of the discharge process, it has become an important method in studying lightning physics and lightning protection mechanisms. Similarly, the United States set up the International Center of Lightning Research and Testing, based in Florida, in 1993, to carry out observational studies of artificially triggered lightning and natural lightning, as well as a variety of protection test trials (Uman, 2010; Rakov et al., 2012; Dwyer and Uman, 2014). Elsewhere, Brazil and France have collaborated for many years in conducting artificially triggered lightning and natural lightning observing experiments (Pinto et al., 2005; Visacro et al., 2012).
China has also been conducting its own lightning observational experiments to better understand the physical processes of lightning. For example, artificially triggered lightning experiments carried out by the Institute of Atmospheric Physics, Chinese Academy of Sciences, in Binzhou, Shandong Province, revealed the development and transport processes of artificially triggered lightning leaders and obtained direct measurements of lightning current parameters (Qie et al., 2007, 2009, 2011). The Cold and Arid Regions Environmental and Engineering Research Institute, Chinese Academy of Sciences, in Datong, Qinghai, launched a multi-station observational experiment of natural lightning’s discharge process, mapping the three-dimensional structure and transmission characteristics of lightning discharge channels (Zhang et al., 2010; Li et al., 2013). There is also an ongoing national project entitled "The Dynamic-Microphysical-Electrical Processes in Severe Thunderstorms and Lightning Hazards" (Qie et al., 2014b), of which the physical processes and disaster-causing mechanisms of lightning are an important part.
Lightning observing experiments, carried out in China and abroad, have furthered our understanding of the physical processes that dominate the lightning occurrence and development. For example, Dwyer and Uman (2014) revealed that the lightning discharge process can produce high-energy radiation, and the occurrence of lightning discharge can stimulate mid-and high-level discharge; Shao et al. (2013) reported the influence of the ionosphere; and particularly, the recent use of VHF lightning location technology has revealed that the initial breakdown process is initiated by a positive stream (Rison et al., 2016).
In order to obtain an in-depth understanding of the physical processes and disaster-causing mechanisms of lightning discharge, the Chinese Academy of Meteorological Sciences and Guangdong Provincial Meteorological Bureau have jointly conducted the Guangdong Comprehensive Observing Experiment on Lightning Discharge (GCOELD), which has been taking place every summer since 2006. The objectives of this experimental program are to improve our understanding on four aspects: (1) artificially triggered lightning physics; (2) tall building lightning physics; (3) testing and application of lightning protection methods; and (4) performance evaluation of lightning location detection systems. This paper reviews the main developments achieved through this field program over the 10-yr period (2006-2015) since its launch.
2 Field experiments and instrumentsThe GCOELD lightning observations were carried out in Guangzhou, at three observation stations. Station 1, located at Guangzhou Conghua Meteorological Bureau, observes the optical, electrical, and magnetic properties of natural lightning discharge as well as artificially triggered lightning, and it also monitors thunderstorms. The instruments installed at Station 1 include an electric field mill (sampling rate of once per second), a fast antenna (with a decay time constant of 2 ms and bandwidth of 1 kHz to 2 MHz), a slow antenna (with a decay time constant of 6 s and bandwidth of 10 Hz to 3 MHz), a magnetic field antenna (with bandwidth of 100 Hz to 5 MHz), an optical radiation measurement instrument, a lightning broadband spectrometer, a lightning broadband interferometer, and a high-speed video camera. Located 8.4 km away in the north from Station 1, Station 2 mainly carries out experiments on artificially triggered lightning and lightning protection. Figure 1 shows the artificially triggered lightning experiment field at Station 2. The test facilities at Station 2 include six rocket launchers, an automatic meteorological station, a wind turbine, a telecommunications base station, a 200-m long 10-kV high-voltage transmission line, a 1.3-m long low-voltage distribution line, and a 100-m long network cable. The main measuring instruments include an artificially triggered lightning current measurement system (with a 1-mΩ resistance sensor (coaxial shunt), a bandwidth of 200 MHz, and a rising edge of 1.8 ns), and YOKOGAWA DL750 digital oscilloscopes with a sampling rate of 10 MHz (before 2012) and HBM Gen 5i digital oscilloscopes with a sampling rate of up to 100 MS s−1 (after 2012). The data collection and transmission of the output voltage of the shunt uses an optical isolation system, recording and storing data in the control room. The optical isolation system has been upgraded twice: before 2008, its bandwidth was 10 MHz; during 2008-2011, the bandwidth was 20 MHz; and after 2012, the bandwidth was 25 MHz. Considering the large dynamic current range of lightning discharge in different stages, the current measurement system has two measuring ranges of±2 kA and±50 kA. The current transfers through the grounding grid (with a length of 10 m and grounding resistance of 6.7 Ω) to earth. The electric field mill, fast and slow antenna, and crossed-loop antenna measure the ground atmospheric electric field intensity, the lightning electric field, and magnetic field changes, respectively. With a resistive-capacitive voltage divider to measure the induction voltage on lines, its divider voltage ratio is 204.9:1. A Pearson coil (with a bandwidth of 150 Hz to 150 MHz) measures the induced current. The signals of the inductive voltage and current (sampling rate of 5 MS s−1 and record length of 0.8 s) are transported through an optical fiber isolation system to the computer. About 2 km away from the main part of Station 2, there is an optical observation site, located on the roof of a building, used mainly to observe artificially triggered lightning and natural lightning. The instruments at this site include a highspeed video camera, a Lightning Attachment Process Observing System (LAPOS), and an ordinary camera.

|
| Figure 1 Photographs of (a) the experiment site for the triggering of lightning and (b) the triggered lightning connected to the iron tower at the wireless communication base station. |
Station 3, also referred to as the "Tall-Object Lightning Observatory in Guangzhou" (TOLOG), actually comprises two stations: the main station and a substation. The main station, located on the roof of a 100-m high building and approximately 70 km away from Station 1, monitors the process of lightning flashes striking tall structures (Lu et al., 2010, 2012). The instruments installed at the main station include an electric field mill, fast and slow antennas, crossed-loop magnetic field antennas, an acoustic thunder source positioning system, several ordinary video cameras, three high-speed video cameras, and two LAPOSs. To observe different fields of view (FOV), three high-speed video cameras, two SA5 cameras (HC-1 and HC-2), and one SA3 camera (HC-3), operate at 10 000, 50 000, and 1000 fps (fps: frames per second), respectively. The substation, located on a 70-m high building that belongs to Jinan University, is approximately 4.8 km away from the main station. A number of tall structures are in the FOV of both the main station and the substation. The substation has two ordinary video cameras installed that cooperate with the optical observing system at the main station to observe the process of lightning flashes striking these tall structures, and reconstruct the threedimensional structure of the lightning channels (Gao et al., 2014; Lü et al., 2015).
3 Experiments and results 3.1 Artificially triggered lightning experiments and lightning current characteristicsThe artificially triggered lightning of GCOELD (Zhang et al., 2014) is conducted with the rocket-wire technique. There were a total of 94 triggered lightning flashes from 2006 to 2015, including 81 classically triggered and 13 altitude triggered lightning flashes. Furthermore, 8 of these lightning flashes were triggered at a communication tower (height of 15 m) from 2011 to 2013, and the current was measured at the top of the tower. Figure 1b shows an example of triggered lightning striking the communication tower. The wire material was mainly composed of copper from 2010 to 2012, and steel either side of this period.
Except for a positive-polarity lightning flash that was triggered in 2015, all other flashes between 2006 and 2015 were of negative polarity, including the abnormal triggered lightning flash investigated by Zheng et al. (2012). Figure 2 shows the lightning triggering system, with six rockets installed in the rocket launchers (Fig. 2b), a metal wire on the spool of the lower part of the rocket that is directly connected with the lightning rod (Fig. 2a), and a control device (Fig. 2c) in the control room that is used to control the launch of the rocket by sending an optical signal to the ignitor (Fig. 2b). The current of the triggered lightning flows to the ground through the coaxial shunt (Fig. 2d).

|
| Figure 2 The artificial lightning triggering system of GCOELD: (a) outdoor equipment; (b) rocket and ignitor; (c) launch controller; and (d) current measuring equipment. Source: Zheng et al. (2013). |
Figure 3 shows the current waveform of lightning triggered on 22 June 2009. Before the continuous development of the upward leader, there were some precursor pulses (PPs) in the current waveform. The initial stage (IS) current corresponds to the upward propagation and entrance into the cloud of the upward leader, where some current pulses may have overlain the IS current, referred to as initial continuous current pulses (ICCPs). A few or tens of milliseconds after the IS, the leader-return stroke process might occur and produce the return stroke (RS) current pulse. During the decay stage of the RS current pulse, the current might suddenly enhance, which behaves as the pulse in the current waveform and is referred to as an Mcomponent pulse. The discharge process of triggered lightning is similar to upward natural lightning; and it does not contain the first RS in downward natural lightning, but it is the same as the subsequent RS of natural lightning (Rakov and Uman, 2003).

|
| Figure 3 Current waveforms of classical artificially triggered lightning at 16:32:47 BT (Beijing Time) 22 June 2009: (a) current waveform covering the entire discharge process; (b) current waveform of the precursor pulse; (c) current waveform in the initial stage and the initial continuous current pulse overlapping it; and (d) current waveform of the return stroke and the M-component pulse. The waveforms in (a) and (d) were recorded by the channel in the large measuring range, and those in (b) and (c) were recorded by the channel in the small measuring range. |
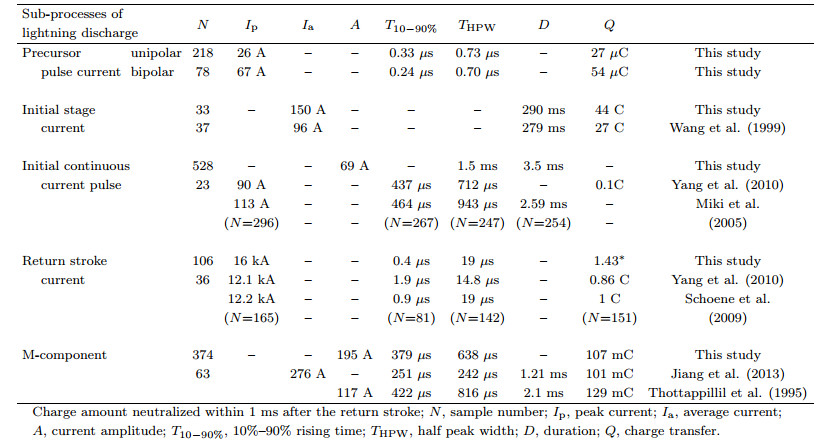
The GCOELD experiments have identified two types of PP waveforms: single-polarity and singlepeak type associated with steel wire, and bipolar oscillatory type associated with copper wire. The latter shows similar characteristics to the PPs reported by Lalande et al. (1998). Table 1 lists the parameters counted from 218 single-polarity and single-peak PPs and 78 bipolar oscillatory PPs (with only first peaks being focused on). The peak current and the charge transfer of the latter type of PPs are around twice those of the former type. Furthermore, the latter type of PPs rise faster than the former type, but they almost have the same half peak width. By introducing a transmission line model, a unipolar current pulse is injected to one top of the wires (Note: the current over the tip of the wire should be unipolar (Biagi et al., 2012) under the assumption that the copper and steel wires were nondestructive transmission lines). The results showed that the current in the copper line was reflected due to the great difference in resistance between the copper line and grounding grid. This resulted in the occurrence of a bipolar oscillatory pulse at the bottom of the channel, and its peak amplitude approximately doubles that of the injected waveform, which are consistent with the measured results. For the steel wire, the current waveform and amplitude did not change obviously compared to the injected waveform over the top tip of the wire, because the impedance of steel wire is very close to that of the grounding grid. This demonstrates that the measured PPs at the bottom of the steel wire were closer to the truth.
|
The IS current corresponds to a stable and continuous development of an upward leader. The characteristics of the IS current were counted based on 33 waveforms (see Table 1). Compared to the results reported by Wang et al. (1999) (Ia=96 A; D=279 ms; Q=27 C), the mean duration was similar, but the average current (150 A) and charge transfer (44 C) of the IS current in GCOELD were greater.
Table 1 also lists the characteristics of ICCPs superimposed on the IS current. Compared with the findings of Wang et al. (1999) and Miki et al. (2005), the ICCPs in GCOELD show greater half-peak widths (1.5 vs 1 and 1.1 ms), longer duration (3.5 vs 2.5 ms) and lower amplitude (69 vs 144 and 76.6 A). More obvious differences could be seen between the ICCPs of triggered lightning in GCOELD and natural upward negative CG (cloud-to-ground) lightning. For example, in studies on natural upward lightning (Wada et al., 1996; Diendorfer et al., 2000; Miki et al., 2006), the half-peak width of ICCPs has been reported as 0.1, 0.3, and 0.2 ms, and the durations of ICCPs as 0.5, 1.2, and 1.8 ms, respectively, which are far lower than the results obtained from GCOELD. On the contrary, the amplitudes, with values of 781, 377, and 512 A, respectively, were far larger than results obtained from GCOELD (Zhang et al., 2014).
The RS is the strongest process involved in lightning discharge. A total of 106 RSs with a minimum, maximum, and geometric mean (GM) current of 3, 42, and 16 kA, respectively, have been analyzed. The parameters of the RSs, listed in Table 1, showing that the GM value of the RS peak current in GCOELD is larger than those recorded in Shandong (approximately 14 kA as in Yang et al. (2010) and Qie et al. (2014a)) and in Florida (about 12 kA as in Schoene et al. (2009)). Furthermore, the peak current is also much greater than that of natural upward lightning observed on the CN tower in Canada (algorithm average value of around 6 kA (Hussein et al., 2004)). Zheng et al. (2013) analyzed the triggered lightning in GCOELD, and found that the current peak value has an obvious functional fitting correlation with the rising rates of the current, charge transfer within 1 ms, and action integral within 1 ms.
The M-component refers to the pulse of rapid current change superimposed on the continual current after the RS peak, and the statistics regarding this are also listed in Table 1. The amplitude of the Mcomponent (195 A) detected from the triggered lightning in GCOELD is lower than the value (276 A) detected in Shandong (Jiang et al., 2013), and higher than the corresponding value (117 A) in Florida (Thottappillil et al., 1995). The 10%-90% rising time (379 µs) and half-peak width (638 µs) of the M-component in the triggered lightning in GCOELD are the largest among the three experiments (251 and 242 µs in Shandong (Jiang et al., 2011, 2013); 442 and 816 µs in Florida (Thottappillil et al., 1995)). The charge transfer values of the M-component are close to each other in the three experiments.
It has been found that there is a "forbidden-zone" correlation between the RS peak current and the subsequent continual current, as shown in Fig. 4. If the peak of the RS is greater than 25 kA, the duration of the continual current cannot last longer than 40 ms. If the duration of the continual current lasts longer than 40 ms, the current peak value of the RS is usually less than 25 kA. In other words, the area in which the duration of the continual current is more than 40 ms and the peak current of the RS is less than 25 kA is considered as the "forbidden zone". Similarly, there is also a forbidden-zone correlation between charge transfer within 1 ms, action integral within 1 ms, and duration of the continuous current. This suggests the presence of charge competition between the RS process and the subsequent continual current. The charge is commonly transferred by a fast-change RS process and slow-changing continual current; however, the allocation mechanism needs further research.

|
| Figure 4 Relationship between the duration of the continuous current and the peak value of the return stroke current. |
There is a linear relationship between the duration of the continual current and the number of Mcomponents superimposed on the continuous current. The longer the duration of the continual current, the Fig. 4. Relationship between the duration of the continuous current and the peak value of the return stroke current. larger the amount of M-components is. There is a forbidden-zone correlation between the duration of the continual current and the average amplitude of the M-component. An M-component with amplitude of greater than 500 A barely exists when the duration of the continual current is longer than 40 ms (Zhang et al., 2016a), and a long duration of the continual current rarely appears when the amplitude of the M-component is large. This also demonstrates the presence of charge transfer competition between the slow changing continual current and the relatively fast changing M-component.
Lü et al. (2008a) reported the optical properties of the artificially triggered lightning channel. Zhou et al. (2013) analyzed the correlation between the optical radiation and current during the continuous current of triggered lightning, and found a fitting equation. Zheng et al. (2012) reported the properties of an abnormal triggered lightning containing two times upward leader propagations, based on optical and electrical observations. These results have helped reveal different discharge characteristics of artificially triggered lightning.
3.2 Observed characteristics of the natural lightning discharge processThe process of natural lightning discharge, including a number of sub-discharge processes such as initial breakdown, leaders, RS, and continuous currents, have been revealed through many observational studies. During GCOLED, the initial discharge and leader propagation have been investigated based on comprehensive observations of electromagnetic signals, broadband multi-frequency signals and high-speed video (Lü et al., 2008b; Zhang et al., 2013a). According to the difference between the polarity of initial breakdown pulses (IBPs) and RSs, three IBPs (Ⅰ, Ⅱ and Ⅲ) have been identified, and their polarities are the same, opposite and blended, respectively, compared to the polarity of the RS. During the initial breakdown discharges, all the three types have been found during both positive and negative flashes in Beijing and Guangzhou alike (Zhang et al., 2013a, b).
Based on an analysis of the IBPs generated during 158 (80 in Beijing and 78 in Guangzhou) negative flashes (Zhang et al., 2013a), Type Ⅰ, was found to be the most probable, with a percentage of 88%. Meanwhile, the percentages for Types Ⅱ and Ⅲ were 8% and 4%, respectively. The characteristic parameters for the same types in Beijing and Guangzhou are similar. The pulse duration, pulse interval, and pulse train duration have been reported as 13.9 µs, 92 µs, and 3.9 ms, respectively. However, the characteristic parameters for the different types show clear differences. The average intervals from an IBP to the first RS are 42, 116, and 106 ms, respectively. The maximum amplitude of IBPs is comparable to the amplitude of the first RS. In Beijing, the relative amplitude of IBPs is 0.5.
Regarding the initial breakdown process during positive flashes (Zhang et al., 2013b), it is found that type Ⅰ represents the largest percentage in both Beijing and Guangzhou, and the percentages of the three types are different. The percentages of type Ⅰ, Ⅱ, and Ⅲ in Beijing are 55%, 39%, and 6%, respectively. In contrast, the corresponding values are 81%, 15%, and 4%, respectively, in Guangzhou. In addition, the characteristic parameters of IBPs in Beijing are different from those in Guangzhou, whereas the pulse interval and duration are smaller in Beijing. Compared with Type Ⅰ, Type Ⅱ features a longer interval from IBPs to the RS, as well as a shorter duration and smaller relative amplitude for IBPs. It is speculated that the different charge structure leads to their difference.
Zhang et al. (2015) found that the discharges after the initial breakdown process are markedly different for different flashes. According to these differences, the discharges involved in the initial breakdown can be classified into four types (A, B, C, and D). Types A, B, and C (Fig. 5) are accompanied by intra-cloud discharge, hybrid flashes (intracloud flashes and an RS), and leader discharge after the initial breakdown discharge. As for type D, IBPs cannot be observed—only a leader-RS process can be detected. Compared to the conventional BIL (breakdown-intermediate-leader) discharge model (Clarence and Malan, 1957), type C is absent in the classical Ⅰ stage, as mentioned by Clarence and Malan (1957). Types B and C feature longer intervals from initial breakdown to the RS, and also show longer intra-cloud propagation and larger relative amplitude, based on the radiation source location. The percentages of the four types in Beijing are different from those in Guangzhou. Namely, Types A and B possess higher percentages in Beijing. The differences can be attributed to the lower positive charge region. As for a classical tripolar thunderstorm, the negative lightning often initiates from the region between the main negative charge region and the lower positive charge region. The large lower positive charge region can neutralize much of the charge of the downward leader, which will hinder the leader from extending out of the lower positive charge region.

|
| Figure 5 Four discharge waveforms related to initial breakdown (Zhang et al., 2015). |
The leader of ground flashes can be observed easily from the optical perspective. Specifically, highspeed video has been used as a highly effective tool to observe the process of leader propagation, revealing aspects such as the leader velocity, branched phenomenon, and channel luminosity change. Based on high-speed video observations of four negative flashes, Zhang et al. (2009) found that different leaders operate at different propagation velocities, depending upon channel shapes. Among the flashes, three downward negative leaders with multiple branches propagated with a velocity of 105 m s−1, while another leader without branching propagated with a velocity of 2.2 × 10⁶ m s−1. Meanwhile, the leader luminosity increased with the propagation of the downward channel. As for the dart leader, before the subsequent RS, the velocity was faster, increasing from 5.2 × 10⁵ to 1.7 × 10⁶ m s−1 when the leader developed from 1.26 to 0.36 km.
In addition, based on observations of electric field change of leader discharge, chaotic pulse train (CPT) events have been found to occur during the propagation of downward leaders (Lan et al., 2011). CPTs are a discharge phenomenon with chaotic initial polarity, chaotic pulse duration, chaotic pulse intervals, and chaotic pulse amplitude; they often occur before the subsequent RS. CPT events in negative CG lightning during 6 thunderstorms in Guangzhou in 2012 were analyzed by Zhou et al. (2014). Their results showed that CPTs were common throughout the negative CG lightning discharge process. In fact, the percentage of negative CG lightning accompanied by CPT events was 75.2%. CPTs often occur before the subsequent RS; indeed, 66.7% of total subsequent strokes were reported to have been preceded by CPTs. With an increase of the order of subsequent strokes, a decreasing trend for the occurrence of CPT events was found, and many CPT events occurred during K discharge.
CPTs generated during the leader stage and before the subsequent RS are often referred to as chaotic leaders (CLs). Based on the waveform of fast electric field change, the pulse interval of CLs was reported to be 5.3-9.0 µs, and the CL duration to be 476 µs (Lan et al., 2011). CLs have stronger high-frequency radiation than stepped leaders and dart leaders (Fig. 6). Liu et al. (2013) reported that the average power spectral density of CLs in the 30-290 MHz band was 1.8-11.6 and 2.4-12 dB larger than that of stepped leaders and dart leaders, respectively, in the same negative CG lightning event. The average speeds were approximately 3.23 × 10⁶ to 1.93 × 10⁷ m s−1, with a mean value of 1.02 × 10⁷ m s−1, which is also similar to that of attempted leaders and dart leaders.

|
| Figure 6 (a) Electric field change and radiation field waveform of a CPT. (b) Electric field change waveform and VHF radiation source of a chaotic leader. |
Based on synchronous optical-electrical data of natural CG flashes, including fast electric field change, slow electric field change, optical signals, and highspeed video, Zhang et al. (2016b) revealed the mechanisms of two CL types (Ⅰ and Ⅱ) after investigating their characteristics, occurrence regularity, and channel propagation. Type Ⅰ exhibits continuously chaotic fast electric field change pulses prior to the subsequent RS; whereas Type Ⅱ begins with large chaotic pulses in the fast electric field change waveform, but without continuous pulses to the subsequent RS. Type Ⅱ is characterized by larger amplitude ratios of chaotic pulses in the waveforms of the fast electric field and optical signal, which is partly related to larger preceding inter-stroke intervals. High-speed video images further depicted the two chaotic leaders. The Type-Ⅰ leaders propagated along one channel’s branch of the previous RS to reach the ground. By comparison, the Type-Ⅱ leaders propagated along one prior channel’s branch at first, but then the channel dimmed, accompanied by strong luminosity.
3.3 Natural CG lightning attachment processThe attachment process in natural CG lightning has always been a focus in lightning physics and lightning protection techniques, but it is also one of the least understood lightning processes. Owing to the instantaneity and randomness in time and space of CG lightning, it is difficult to comprehensively observe the lightning flashes that strike the ground or low-rise buildings at a close distance with high spatiotemporal resolution. Therefore, systematic observations of the inception and development of upward leaders induced by downward leaders and their interactions are lacking. However, tall structures provide an appropriate observational platform to observe the attachment processes in natural CG lightning. Figure 7 shows the FOV of Station 3 during GCOELD. Lü et al. (2010) presented findings regarding two downward CG lightning flashes observed by TOLOG, one of which struck the 610-m (600-m after 2010) high Guangdong Tower. The two-dimensional (2D) length of one upward connecting leader (UCL) was more than 450 m, and that of the other was approximately 177 m; the average 2D propagation velocities of the two UCLs were in the order of 105 m s−1. Lü et al. (2012) analyzed 45 unconnected upward leaders (UULs), which occurred in 19 downward negative flashes, and determined their inception height, inception time prior to the RS, horizontal distance from the flash’s strike point, 2D distance between the nearest downward leader branch tip and the UUL’s inception point at its inception time, 2D length, and 2D average propagation velocity.

|
| Figure 7 Tall structures seen from TOLOG. Photo taken on 5 July 2011 and adapted from Lü et al. (2012). |
Using a high-speed video camera with a sampling rate of 10000 fps, Lü et al. (2013) analyzed a downward negative lightning flash that struck the 440-m high Guangzhou International Finance Center. The results showed a predominantly upward direction of the UCL extension and an overall increase in both speed and luminosity of the UCL, suggesting that the integrated effect of (electric field produced by) all branches of the downward leader on the UCL was significant. During the final 160 µs preceding the beginning of the RS in particular, the speeds of UCLs rapidly rose from an order of 105 m s−1 to an order of 106 m s−1; the UCL effect on the downward leader was limited. Only if the 2D distance between the leaders decreased to less than 60 m, was it observed that the downward leader bent sharply towards the UCL and became brighter and faster. Clearly, the observations of the high-speed video camera with a sampling rate of 50000 fps (Fig. 8) showed the connection of the downward negative leader to the lateral surface of the upward connecting leader, which had not been reported previously in literature. Moreover, further analyses indicated that the connecting behaviors between the downward leader and UCL were diverse. A behavior in the form of connecting the tip of the downward leader to the lateral surface of the UCL was more common than the tip-to-tip connection of the downward leader and the UCL (Lü et al., 2016).

|
| Figure 8 High-speed video frames of flash F1111 with a sampling rate of 50000 frames per second, a frame exposure time of 20 µs, and a spatial resolution of 2.4 m per pixel. TD is the tip of the primary branch of the downward leader that facilitates the connection to the upward connecting leader (UCL) in the last frame preceding the return stroke. TU is the tip of the UCL. HU is the highest UCL point discernible in the return stroke channel. All the images are inverted for a better view. Adapted from Lü et al. (2013). |
Lü et al. (2013) also showed that the ratio of the speed of the downward leader to that of the UCL (Vd/Vu) tended to decrease with time, ranging from 1.8 to 0.12. In leader progression models, it is sometimes assumed that the ratio of the speed of a negative downward leader to that of a positive UCL changes from 4 to 1 during the attachment process, while in other models it is assumed that Vd/Vu is equal to 1, 2, or 4. Either way, the ratio is always larger than 1, meaning Vu is unable to exceed Vd. However, Lü et al. (2013) found that Vu can significantly exceed Vd, and hence Vd/Vu can be significantly less than 1. To the best of our knowledge, the latter possibility has never been considered in such models.
Chen et al. (2016), using high-speed cameras, a LAPOS, and fast and slow electrical antennas, documented a downward bipolar lightning flash that contained one first positive stroke and five subsequent negative strokes. Their results showed that: (ⅰ) all six strokes propagated along the same viewed channel established by the first positive RS; (ⅱ) the leader, which preceded the positive RS, propagated downward without any branches at a 2D speed of 2.5 × 10⁶ m s−1; (ⅲ) an UCL with a length of about 80 m was observed in response to the downward positive leader; (ⅳ) all RSs exhibited similar speeds, ranging from 1.0 to 1.3 × 10⁸ m s−1; (ⅴ) the 10%-90% rise times of the RSs’ optical pulses ranged from 2.2 to 3.2 µs, while the widths from the 10% wave front to the 50% wave tail ranged from 56.5 to 83.1 µs, and the half-peak widths ranged from 53.4 to 81.6 µs.
Qi et al. (2016) presented new high-speed video observations of a natural downward negative lightning flash that occurred at a close distance of 350 m. They showed that nine pronounced field pulses, which were attributed to individual leader steps, were recorded in the electromagnetic field. The time intervals between the step pulses ranged from 13.9 to 23.9 µs, with a mean value of 17.4 µs. For the first time, smaller pulses were observed between the pronounced step pulses in the magnetic field derivative records. Time intervals between the smaller pulses (indicative of intermittent processes between steps) ranged from 0.9 to 5.5 µs, with a mean of 2.2 µs and a standard deviation of 0.82 µs. A total of 23 luminous segments, commonly attributed to space stems/leaders, were captured. Their 2D lengths varied from 1 to 13 m, with a mean of 5 m. The distances between the luminous segments and the existing leader channels ranged from 1 to 8 m, with a mean value of 4 m. Based on these observations, three possible scenarios of the evolution of space stems/leaders located beside the leader channel have been inferred: (ⅰ) the space stem/leader fails to connect to the leader channel; (ⅱ) the space stem/leader connects to the existing leader channel, but may die off and be followed, tens of microseconds later, by a low luminosity streamer; (ⅲ) the space stem/leader connects to the existing channel and launches an upwardpropagating luminosity wave.
Furthermore, based on 2D optical observations, a 3D lightning channel reconstruction method has been established from dual-station video observations (Gao et al., 2015). Combining this method and high-speed video observations, Gao et al. (2014) analyzed six downward negative flashes that terminated on tall structures in Guangzhou. They showed that: the 3D lengths of the 6 positive UCLs ranged from 180 to 818 m; there were 38 3D speeds calculated that combined the 3D UCL channel and the high-speed images for the 6 UCLs. The 3D speed values ranged from 0.8 to 14.3 × 10⁵ m s−1 with an average value of 4.7 × 10⁵ m s−1, and 4 of them (11%, 4/38) were in the order of 106 m s−1; the 2D lengths and 2D speeds ranged from 147 to 610 m and 0.3 to 10.6 × 10⁵ m s−1, respectively. On average, the 3D speed was 1.3 times that of the 2D speed. When the time was approaching the RS, the propagation speed of the UCL was increasing, and all of the 4 3D speeds in the order of 106 m s−1 occurred less than 0.2 ms prior to the RS. When the 3D length was shorter than 300 m, 77% (20/26) of the corresponding 3D speeds were slower than 5 × 10⁵ m s−1; and when the 3D length was longer than 300 m or the UCL tip height was higher than 650 m, all of the corresponding 3D speeds were faster than 5 × 10⁵ m s−1.
Lü et al. (2015) analyzed electrical and dualstation optical observations of a downward negative lightning flash. They reported that: (ⅰ) the 3D propagation speed of the downward leader ranged from 1.3 to 6.8 × 10⁵ m s−1, with an average value of 2.7 × 10⁵ m s−1, during the final 2 ms prior to the RS, and the corresponding 2D speed ranged from 1.1 to 4.9 × 10⁵ m s−1 with an average value of 2.1 × 10⁵ m s−1. The speed change of the downward leader showed no clear trend, except for the final 200 µs; (ⅱ) the 3D propagation speed of the UCL in F1215 ranged from 0.8 to 13.7 × 10⁵ m s−1, with an average value of 4.5 × 10⁵ m s−1. The upward leader, initiated from the tall objects under the influence of the downward negative leader, tended to increase in speed as the time approached the RS, and sharply during approximately the final 1 ms; and (ⅲ) the 3D speed ratio between the downward leader and the UCL, ranging from approximately 2.2 to 0.2, tended to decrease with time.
3.4 Testing of lightning protection technologiesMultiple experiments related to lightning protection have been carried out by using triggered lightning techniques during GCOELD; e.g., at the communications base station and automatic weather station, with buried cable and surge protection devices (SPDs). Zhang et al. (2013c) indicated that the induced overvoltage waveform on a vertical signal line for wind speed and direction has an obvious positive subpeak following the negative main peak, and the main peak pulse resembles a "V" shape, with a geometric average of 412.4 V and -1.2 kV, respectively, during 7 RSs. The joint between the automatic weather station acquisition device and the signal line was obviously damaged and burned when the vertical signal line was not installed with an SPD at the bottom tower. The main reason was that the insulation level could not bear the impulse of the induced over-voltages as the lightning occurred nearby. The overhead power distribution line at the test site is about 1.3 km. The induced over-voltages on the overhead distribution line should not be neglected when nearby lightning flashes occur. The induced over-voltage caused by natural lightning was mainly unipolar pulse, based on seven multiple and five single RS flashes, but with negative or positive polarity, depending on the lightning location. The induced over-voltage due to the first RS of natural lightning was larger than that of the subsequent RS; the negative amplitude of the former ranged from 3.2 to 3.9 kV, with a mean value of 3.5 kV, whereas the mean value for the latter was 0.92 kV. The same consequence for the positive-induced overvoltages was found, with the average positive amplitude corresponding to the first and subsequent RS of 1.9 and 0.81 kV, respectively. However, for the nearby closing triggered lightning, the induced over-voltages on the overhead distribution line were bipolar, with a stronger peak voltage in the RS and continuous current processes. The negative peak values due to the RS ranged from 5.0 to 10.3 kV, with a mean value of 7.9 kV, and with a peak value of about 1.0 kV of negative or positive polarity due to the continuous current process.
Yu et al. (2010) observed induced over-voltage due to different buried cables as nearby natural lightning occurred, and an effective reduction in the induced over-voltage on the shielding layer of buried cables was found. The study showed that the proportion of the peak impulse voltage on the power cable with respect to that of the control cable and signal cable was 65% and 26%, respectively. It was also shown that a shielding layer with a steel belt could effectively restrain the control cable’s induced over-voltage component between 400 kHz to 1 MHz in frequency, with obvious weakness in the signal cables below 50 kHz with a copper belt. However, the shielding effects with a copper belt were superior to those with a steel belt. The study also revealed the different features under different buried conditions, especially demonstrating that soil plays an important role in shielding the lightning electromagnetic impulse. It was found that the peak induced over-voltage buried at a depth of 0.5 m reduced by 52.5% compared to that on the ground, with a particularly large reduction in the frequency range of 905.5 kHz to 1.5 MHz.
SPDs are commonly used in lightning protection. In order to test how SPDs respond in a real lightning environment, the residue voltage and corresponding current through the SPD were observed on an overhead line at the testing site during summer 2008 and summer 2014. The tests aimed to find the influence of nearby lightning electromagnetic impulses and ground potential rise on the SPD. Chen et al. (2016) observed the SPD residue voltage and corresponding grounding current on an overhead line due to 11 RSs of a triggered lightning process during the summer 2014 experiment. They discovered that the SPD voltage at the two ends were positive in the initial stage, and, afterwards, with negative polarity. The variation in the electromagnetic field during the stage of the leader approaching the ground accounted for the initial coupled positive voltage, and the RS process accounted for the negative coupled induced voltage. The SPD residue voltage duration of 11 RSs ranged from 95.2 to 269.0 µs, with a mean value of 157.3 µs. The peak current of the SPD ground line ranged from -198.3 A to -961.0 A, with a mean value of -506.0 A; and the mean 10%-90% current rise time and half-peak width were 17.5 and 68.1 µs, respectively. It was found that the 10%-90% average current gradient of triggered lightning was a key factor for the characteristic parameters of the SPD grounding line current. It was also discovered that the ground potential rise (GPR) affected the SPD voltage when the distance between the two grounding grids of the triggered lightning rod and the SPD installation was about 40 m. With this 40-m distance from the lightning channel to the SPD, the residual voltage of the SPD featuring negative polarity was generally still determined by the voltage induced in the overhead distribution line in the RS, with the GPR as the secondary cause. These characteristics are basically similar to those of natural lightning flashes with no GPR influence. Importantly, there was a recoil voltage that, on average, lasted until the end of the residual voltage for approximately 683.8 µs. This might be attributed to the GPR that played a key role at the end of the RS; whereas the induced voltage tended towards zero at the same time.
Interestingly, as demonstrated in Fig. 9, with two M-component waveforms, in contrary to the other Mcomponents and RSs whose residual voltages are of negative polarity, the residual voltages of the SPD due to the six minor M-components were of positive polarity. The most likely reason for this phenomenon is that the amplitude of the GPR was relatively larger than that of the induced voltage on the overhead distribution line. M-components with minor current have a slow rate of rise, and hence the induced voltage on the overhead distribution line would be smaller than those of the GPR. Consequently, the influence of the GPR becomes strong and dominates the total residual voltage waveform.

|
| Figure 9 Residual voltage waveform (upper lines) of the surge protection device (SPD) and the corresponding current waveform (lower lines) flowing through the SPD during two minor M-component stages in a triggered lightning during the summer 2014 experiment. (a) 74.5-77 ms and (b) 271.5-274 ms. |

|
| Figure 10 (a) Plots of GHMLLS locations versus the corresponding actual strike points for 124 lightning strikes on tall buildings and 133 triggered lightning discharges during 2012-2015 (the origin corresponds to the stroke grounding point). (b) GHMLLS-reported peak current versus that directly measured in the triggered lightning experiments during 2012-2015. |
With a 5-m distance from the lightning channel to the SPD, the residual voltage of the SPD originates mainly from the GPR during the entire flash, especially in the process of the RS and continuous current. When there is a long duration for the continuous current and M-component after the RS process, this will also contribute to a long duration of several ms for the residual voltage of the SPD. The experiment during summer 2008 revealed that the durations of the residual voltages range from 0.2 to 5.9 ms, with an arithmetic mean value of 3.1 ms (Chen et al., 2009), which is much longer than those of the voltages induced in the distribution line by the RSs. It appears more probable that the damage of the SPD (with a nominal impulse current of 20 A) was mainly caused by the long duration of the current due to the nearby GPR in the long continuing current stage and the continuous impact due to multiple RSs in a transient duration. Therefore, the counterattack between two closing grounding grids in the design of a lightning protection design is particularly worthy of concern; if one of the grids is subject to direct lightning, then the other, connecting the equipment and the SPD, should be at a safe distance.
3.5 Performance of CG lightning location systemsLightning location systems (LLSs) are pivotal for monitoring lightning activities over a large area; they can, in real-time, provide information regarding CG lightning stroke parameters, such as the time, location, peak current, polarity, and etc, of lightning. However, the performance of LLSs is of concern to many lightning researchers because it affects both the quality of the data and their application. To objectively evaluate the performance of LLSs using indices such as detection efficiency, location error, and peak current estimation error, reliable observations of lightning "ground truths" need to be obtained and compared to the corresponding LLS records.
To date, several LLSs have been put into operation in Guangdong Province, China, but the main ones are the LLS of the Guangdong power grid, the Guangdong-Hongkong-Macao LLS (GHMLLS), and the Earth Networks Total Lightning Network (ENTLN). Recently, the performance characteristics of the three LLSs were evaluated based on observations of triggered lightning flashes obtained as part of GCOELD, as well as natural lightning flashes to tall structures in Guangzhou obtained at TOLOG.
The LLS of the Guangdong power grid was originally built in 1996. The combined magnetic-directionfinding and time-of-arrival (MDF-TOA) technology is used to detect CG lightning stroke information such as longitude and latitude, GPS time, peak current, polarity, reporting sensors, and so on. The LLS of the Guangdong power grid has the longest continual and stable operation period in China, with historical observations of lightning location data in Guangdong Province accumulated for nearly 19 years. According to a performance evaluation for the Guangdong Power Grid Lightning Location System conducted by Chen et al. (2012), observations of 28 artificially triggered lightning flashes during 2007-2011 and 34 natural lightning flashes that occurred on tall structures during 2009-2011 showed that the arithmetic mean values of the flash detection efficiency, stroke detection efficiency, location error, and absolute percentage errors of peak current estimation, were around 94%, 60%, 710 m, and 16.3%, respectively.
The GHMLLS was jointly constructed by the meteorological departments of Guangdong Province, Hong Kong, and Macao. During 2005-2009, five sensors of Improved Accuracy from Combined Technology (IMPACT) were used in the GHMLLS, and the detection range was limited to a coverage of only around Hong Kong. In 2012, 11 LS-7000 type sensors were added to the GHMLLS, and the detection range was expanded to cover almost the entire Guangdong Province. A comparative analysis was carried out to judge the performance of the GHMLLS, based on observations of 56 artificially triggered lightning flashes (containing 238 confirmed RSs) during 2007-2015, and 96 natural lightning flashes (containing 250 confirmed RSs) during 2009-2015. Results showed that the flash detection efficiency and stroke detection efficiency improved from 74% and 40% to 96% and 89%, respectively, after the GHMLLS was upgraded in 2012, while the location error reduced from 2660 to 532 m. However, the peak current estimation did not improve after the upgrade. The peak current estimation was found to be 25% lower than the ground truth during 2008-2011, while 37% lower during 2012-2015.
The ENTLN was constructed by the Guangdong Meteorological Bureau. By 2015, the ENTLN contained 16 broadband sensors provided by the Earth Network Company, which enables it to detect both cloud-to-cloud and CG lightning flashes. According to comparative results between the ground truth of 13 triggered lightning flashes and 9 natural lightning flashes observed in 2015, the flash detection efficiency, stroke detection efficiency, and location error were found to be about 77%, 76%, and 685 m, respectively, with the peak current estimation of about 61% of the value measured by coaxial shunt.
Overall, the performance of LLSs in Guangdong Province appear to be comparable to the Austrian Lightning Detection & Information System and the U.S. National Lightning Detection Network (Diendorfer, 2010; Nag et al., 2011), as judged by their detection efficiency and location error, but produce relatively lower peak current estimations. Evaluating the performance of LLSs provides not only a reliable reference for the application of lightning location data, but also important information for upgrading and improving these facilities.
4 Summary and conclusionsDuring the decade-long series of lightning field experiments reviewed in this paper, the technology of rocket-wire artificially triggered lightning has been improved, and has successfully triggered 94 lightning flashes. Through direct lightning current waveform measurements, an average RS peak current of 16 kA was obtained. The phenomenon that the downward leader connects to the lateral surface of the upward leader in the attachment process was discovered, and the speed of the upward leader during the connection process being significantly greater than that of the downward leader was revealed. Findings show that the length of the upward connecting leader initiated from tall structures can be several hundred meters and even more than 1 km, and the speed of the upward connecting leader can reach a magnitude of 106 m s−1. Considerable diversity has been found in the connection scenario during the attachment of the downward leader and upward connecting leader. The mechanism causing damage to lightning protection devices (i.e., ground potential rise within the rated current) was established. Tests of lightning protection technologies show that the voltage on the overhead lines induced by close-distance electromagnetic wave coupling from artificially triggered lightning can reach a magnitude of kilovolts. Multiple return strokes, continuing current, and ground potential rise are the main factors that cause damage to surge protective devices. Finally, quantitative assessments of the performance of three lightning monitoring systems in Guangdong Province have been conducted, and results regarding the performance of the Guangdong-Hong Kong-Macau Lightning Location System show that the detection efficiency of flashes and strokes is 96% and 89%, respectively. Meanwhile, the arithmetic mean value of location error is 532 m, and the estimated value of the return stroke current intensity is around 63% of the true value.
Artificially triggered lightning can be measured directly at the bottom of the lightning channel current. The RS process is consistent with its counterpart in natural lightning, providing good conditions for studying the physics of lightning and for testing protection systems. However, such an approach is flawed in that, unlike natural lightning, there is no first RS process in triggered lightning. Furthermore, although there is a higher probability of capturing natural lightning striking tall structures, directly measuring the current remains a challenge. Recently, a 360-m tall meteorological observation tower, designed to directly measure lightning current at its top, has been constructed in Shenzhen. Such structures, capable of directly observing the current of a natural lightning flash, will be an important complement to triggered lightning experiments in future research on the physics of lightning discharge and its effects. They will also further improve our understanding of thunderstorm electricity, likely elucidating the mechanisms underpinning the origins of lightning in cloud, which has remained unsolved at present.
Optical and electrical observations in recent years have revealed some new phenomena during the initial process of lightning, thus deepening our understanding of this process. The occurrence of lightning is accompanied by strong convective processes. As such, lightning information is of great significance to the monitoring and prediction (i.e., early warning systems) of hazardous weather. To this end, lightning data in the pattern of assimilation has provided encouraging results (Qie et al., 2014c).
Despite the above-mentioned significant progress, lightning field observing experiments need to be improved in the following aspects in the future: (ⅰ) testing the combined lightning detection systems with multiple parameters of radar observations with the aim to reveal the relationships between the lightning activity of convective weather and the electrical structure of developing thunderstorms; (ⅱ) applying lightning information to monitoring and early warning systems for disastrous weather, especially through the correlation between lightning activity and disastrous weather processes; and (ⅲ) exploring the response mechanisms of lightning activity to climate change, with a focus on observations of lightning-generated NOx and the impact of aerosols on lightning activity.
Acknowledgments.: We would like to thank many staff of the Conghua Meteorological Bureau and our graduate students for participating in the field experiments.| Biagi C. J., Uman M. A., Hill J. D., et al ,2012: Transient current pulses in rocket-extended wires used to trigger lightning. J. Geophys. Res. , 117 (D7) , D07205. DOI:10.1029/2011JD016161 |
| Chen Shaodong, Zhang Yijun, Yang Shaojie, et al ,2009: Characteristics of induced overvoltage generated by triggered lightning in the low voltage power supply system. High Voltage Engineering , 35 , 2944–2952. |
| Chen L. W., Zhang Y. J., Lu W. T., et al ,2012: Per-formance evaluation for a lightning location system based on observations of artificially triggered lightning and natural lightning flashes. J. Atmos. Oceanic Technol. , 29 , 1835–1844. DOI:10.1175/JTECH-D-12-00028.1 |
| Chen S. D., Zhang Y. J., Chen C., et al ,2016: Influence of the ground potential rise on the residual voltage of low-voltage surge protective devices due to nearby lightning flashes. IEEE Transactions on Power Delivery , 31 , 596–604. DOI:10.1109/TPWRD.2015.2441773 |
| Clarence N. D., Malan D. J. ,1957: Preliminary discharge processes in lightning flashes to ground. Quart. J. Roy. Meteor. Soc. , 83 , 161–172. DOI:10.1002/(ISSN)1477-870X |
| Cummer S. A., Lyu F., Briggs M. S., et al ,2015: Lightning leader altitude progression in terrestrial gamma-ray flashes. Geophys. Res. Lett. , 42 , 7792–7798. DOI:10.1002/2015GL065228 |
| Diendorfer, G., M. Mair, W. Shulz, et al., 2000:Lightning current measurements in Austria:Experimental setup and first results. Proceedings of the 25th International Conference on Lightning Protection, Universität Patras, Rhodos, Greece. 18-22 September, 44-47. |
| Diendorfer, G., 2010:LLS performance validation using lightning to towers. Proceedings of the 21st International Lightning Detection Conference, Orlando, FL, USA. 19-20 April, 1-15.[Available online at http://www.vaisala.com/Vaisala20Documents/Scientific20papers/1.Keynote-Diendorfer.pdf].[Accessed on 05-March-2016] |
| Dwyer J. R., Uman M. A. ,2014: The physics of lightning. Phys. Rep. , 534 , 147–241. DOI:10.1016/j.physrep.2013.09.004 |
| Gamerota W. R., Idone V. P., Uman M. A., et al ,2014: Dart-stepped-leader step formation in triggered lightning. Geophys. Res. Lett. , 41 , 2204–2211. DOI:10.1002/2014GL059627 |
| Gao Y., Lu W. T., Ma Y., et al ,2014: Threedimensional propagation characteristics of the upward connecting leaders in six negative tall-object flashes in Guangzhou. Atmos. Res. , 149 , 193–203. DOI:10.1016/j.atmosres.2014.06.008 |
| Gao Yan, Lü Weitao, Chen Luwen, et al ,2015: Reconstruction method of 3D lightning channel from two-station video observation. Plateau Meteor. , 34 , 842–849. |
| Hussein A. M., Janischewskyj W., Milewski M., et al ,2004: Current waveform parameters of CN tower lightning return strokes. J. Electrostat. , 60 , 149–162. DOI:10.1016/j.elstat.2004.01.002 |
| Jiang Rubin, Qie Xiushu, Wang Caixia, et al ,2011: Lightning M-components with peak currents of kilo amperes and their mechanism. Acta Phys. Sinica , 60 , 867–874, 079201. |
| Jiang R. B., Qie X. S., Yang J., et al ,2013: Characteristics of M-component in rocket-triggered lightning and a discussion on its mechanism. Radio Sci. , 48 , 597–606. DOI:10.1002/rds.v48.5 |
| Lalande P., Bondiou-Clergerie A., Laroche P., et al ,1998: Leader properties determined with triggered lightning techniques. J. Geophys. Res. , 103 (D12) , 14109–14115. DOI:10.1029/97JD02492 |
| Lan Y., Zhang Y. J., Dong W. S., et al ,2011: Broadband analysis of chaotic pulse trains generated by negative cloud-to-ground lightning discharge. J. Geophys. Res. , 116 (D17) , D17109. DOI:10.1029/2010JD015159 |
| Li Y. J., Zhang G. S., Wen J., et al ,2013: Electrical structure of a Qinghai-Tibet Plateau thunderstorm based on three-dimensional lightning mapping. Atmos. Res. , 134 , 137–149. DOI:10.1016/j.atmosres.2013.07.020 |
| Liu Hengyi, Dong Wansheng, Zhang Yijun, et al ,2013: Three-dimensional observation of chaotic pulse train event in negative cloud-to-ground lightning using VHF broadband digital interferometer. Plateau Meteor. , 32 , 1186–1194. |
| Lü Weitao, Zhang Yijun, Zhou Xiuji, et al ,2008a: Analysis of channel luminosity characteristics in rockettriggered lightning. Acta Meteor. Sinica , 22 , 362–374. |
| Lü Weitao, Zhang Yijun, Li Jun, et al ,2008b: Optical observations on propagation characteristics of leaders in cloud-to-ground lightning flashes. Acta Meteor. Sinica , 22 , 66–77. |
| Lü, W. T., Y. Zhang, L. W. Chen, et al., 2010:Attachment processes of two natural downward lightning flashes striking on high structures. 30th International Conference on Lightning Protection-ICLP 2010, Power and Energy Society, Cagliari, Italy. 13-17 September, paper number 1290. |
| Lü W. T., Chen L. W., Zhang Y., et al ,2012: Characteristics of unconnected upward leaders initiated from tall structures observed in Guangzhou. J. Geophys. Res. , 117 (D19) , D19211. DOI:10.1029/2012JD018035 |
| Lü W. T., Chen L. W., Ma Y., et al ,2013: Lightning attachment process involving connection of the downward negative leader to the lateral surface of the upward connecting leader. Geophys. Res. Lett. , 40 , 5531–5535. DOI:10.1002/2013GL058060 |
| Lü W. T., Gao Y., Chen L. W., et al ,2015: Threedimensional propagation characteristics of the leaders in the attachment process of a downward negative lightning flash. J. Atmos. Solar-Terr. Phys. , 136 , 23–30. DOI:10.1016/j.jastp.2015.07.011 |
| Lü W. T., Qi Q., Ma Y., et al ,2016: Two basic leader connection scenarios observed in negative lightning attachment process. High Volt. , 1 , 11–17. DOI:10.1049/hve.2016.0002 |
| Miki M., Rakov V. A., Shindo T., et al ,2005: Initial stage in lightning initiated from tall objects and in rocket-triggered lightning. J. Geophys. Res. , 110 (D2) , D02109. |
| Miki, M., T. Shindo, V. A. Rakov, et al., 2006:Characterization of current pulses superimposed on the continuous current in upward lightning initiated from tall objects and in rocket-triggered lightning. Proceedings of the 28th International Conference on Lightning Protection, University of the Federal Armed Forces Munich, Fridolin Heidler. 18-22 September, 83-88. |
| Nag A., Mallick S., Rakov V. A., et al ,2011: Evaluation of U.S. National Lightning Detection Network performance characteristics using rocket-triggered lightning data acquired in 2004-2009. J. Geophys. Res. , 116 (D2) , D02123. DOI:10.1029/2010JD014929 |
| Pinto Jr O., Pinto I. R. C. A., Saba M. M. F., et al ,2005: Return stroke peak current observations of negative natural and triggered lightning in Brazil. Atmos. Res. , 76 , 493–502. DOI:10.1016/j.atmosres.2004.11.015 |
| Qi Q., Lu W. T., Ma Y., et al ,2016: Highspeed video observations of the fine structure of a natural negative stepped leader at close distanc. Atmos. Res. , 178-179 , 260–267. DOI:10.1016/j.atmosres.2016.03.027 |
| Qie Xiushu, Zhang Qilin, Zhou Yunjun, et al ,2007: Artificially triggered lightning and its characteristic discharge parameters in two severe thunderstorms. Science in China Series D:Earth Sciences , 50 , 1241–1250. DOI:10.1007/s11430-007-0064-2 |
| Qie X. S., Zhao Y., Zhang Q. L., et al ,2009: Characteristics of triggered lightning during Shandong artificial triggering lightning experiment (SHATLE). Atmos. Res. , 91 , 310–315. DOI:10.1016/j.atmosres.2008.08.007 |
| Qie X. S., Jiang R. B., Wang C. X., et al ,2011: Simultaneously measured current, luminosity, and electric field pulses in a rocket-triggered lightning flash. J. Geophys. Res. , 116 (D10) , D10102. DOI:10.1029/2010JD015331 |
| Qie X. S., Jiang R. B., Yang J. ,2014a: Characteristics of current pulses in rocket-triggered lightning. Atmos. Res. , 135-136 , 322–329. DOI:10.1016/j.atmosres.2012.11.012 |
| Qie, X. S., G. P. Lu, Y. J. Zhang, et al., 2014b:Dynamicmicrophysical-electrical processes in severe thunderstorms and lightning hazards. Proceedings of the XV International Conference on Atmospheric Electricity, CAE, Norman, Oklahoma, USA. 15-20 June, 1-4, paper number 0-01-08. |
| Qie X. S., Liu D. X., Sun Z. L. ,2014c: Recent advances in research of lightning meteorology. J. Meteor. Res. , 28 , 983–1002. DOI:10.1007/s13351-014-3295-0 |
| Rakov V. A., Uman M. A.,2003: Lightning:Physics and Effects. Cambridge, UK: Cambridge University Press : 265 -267. |
| Rakov, V. A., S. Mallick, and A. Nag, 2012:Lightning observatory in Gainesville (LOG), Florida:a review of recent results. Proceedings of the 31th International Conference on Lightning Protection, IEEE, Vienna, Austria, 1-8. |
| Rison W., Krehbiel P. R., Stock M. G., et al ,2016: Observations of narrow bipolar events reveal how lightning is initiated in thunderstorms. Nature Communications , 7 , 10721. DOI:10.1038/ncomms10721 |
| Schoene J., Uman M. A., Rakov V. A., et al ,2009: Characterization of return-stroke currents in rockettriggered lightning. J. Geophys. Res. , 114 (D3) , D03106. |
| Shao X. M., Lay E. H., Jacobson A. R. ,2013: Reduction of electron density in the night-time lower ionosphere in response to a thunderstorm. Nature Geoscience , 6 , 29–33. |
| Thottappillil R., Goldberg J. D., Rakov V. A., et al ,1995: Properties of M components from currents measured at triggered lightning channel base. J. Geophys. Res. Atmos. , 100 , 25711–25720. DOI:10.1029/95JD02734 |
| Uman M. A.,2010: The Art and Science of Lightning Protection. Cambridge: Cambridge University Press : pp 45 . |
| Visacro S., Mesquita C. R., De Conti A., et al ,2012: Updated statistics of lightning currents measured at Morro do Cachimbo Station. Atmos. Res. , 117 , 55–63. DOI:10.1016/j.atmosres.2011.07.010 |
| Wada, A., A. Asakawa, and T. Shindo, 1996:Characteristics of lightning strokes to a 200 m-high stack in winter. Proceedings of the 10th International Conference on Atmospheric Electricity, Society of Atmospheric Electricity of Japan, Osaka, 464-467. |
| Wang D., Rakov V. A., Uman M. A., et al ,1999: Characterization of the initial stage of negative rockettriggered lightning. J. Geophys. Res. , 104 (D4) , 4213–4222. DOI:10.1029/1998JD200087 |
| Yang J., Qie X. S., Zhang G. S., et al ,2010: Characteristics of channel base currents and close magnetic fields in triggered flashes in SHATLE. J. Geophys. Res. , 115 (D23) , D23102. DOI:10.1029/2010JD014420 |
| Yu Hui, Dong Wansheng, Chen Shaodong, et al ,2010: Observation and analysis of lightning induced overvoltage on buried cables. High Power Laser and Particle Beams , 22 , 2373–2377. DOI:10.3788/HPLPB |
| Zhang Guangshu, Wang Yanhui, Qie Xiushu, et al ,2010: Using lightning locating system based on time-ofarrival technique to study three-dimensional lightning discharge processes. Science China Earth Sciences , 53 , 591–602. DOI:10.1007/s11430-009-0116-x |
| Zhang Y. J., Lu W. T., Li J., et al ,2009: Luminosity characteristics of leaders in natural cloud-to-ground lightning flashes. Atmos. Res. , 91 , 326–332. DOI:10.1016/j.atmosres.2008.01.013 |
| Zhang Yijun, Lv Weitao, Zhang Yang, et al ,2013a: Observations of the cloud-to-ground lightning discharge process and analysis on its characteristic in Guangzhou. High Voltage Engineering , 39 , 383–392. |
| Zhang Y, Zhang Y. J., Lu W. T., et al ,2013b: Analysis and comparison of initial breakdown pulses for positive cloud-to-ground flashes observed in Beijing and Guangzhou. Atmos. Res. , 129-130 , 34–41. DOI:10.1016/j.atmosres.2013.03.006 |
| Zhang Y. J., Chen S. D., Zheng D., et al ,2013c: Experiments on lightning protection for automatic weather stations using artificially triggered lightning. IEEE Transactions on Electrical and Electronic Engineering , 8 , 313–321. DOI:10.1002/tee.v8.4 |
| Zhang Y. J., Yang S. J., Lu W. T., et al ,2014: Experiments of artificially triggered lightning and its application in Conghua, Guangdong, China. Atmos. Res. , 135-136 , 330–343. DOI:10.1016/j.atmosres.2013.02.010 |
| Zhang Y, Zhang Y. J., Zheng D., et al ,2015: Preliminary breakdown, following lightning discharge processes and lower positive charge region. Atmos. Res. , 161-162 , 52–56. DOI:10.1016/j.atmosres.2015.03.017 |
| Zhang Y., Zhang Y. J., Xie M., et al ,2016a: Characteristics and correlation of return stroke, M component and continuing current for triggered lightning. Electric Power System Research , 139 , 10–15. DOI:10.1016/j.epsr.2015.11.024 |
| Zhang Y, Zhang Y. J., Li C., et al ,2016b: Simultaneous optical and electrical observations of "chaotic" leaders preceding subsequent return strokes. Atmos. Res. , 170 , 131–139. DOI:10.1016/j.atmosres.2015.11.012 |
| Zheng Dong, Zhang Yijun, Lv Weitao, et al ,2012: Optical and electrical observations of an abnormal triggered lightning event with two upward propagations. Acta Meteor. Sinica , 26 , 529–540. DOI:10.1007/s13351-012-0411-x |
| Zheng D., Zhang Y. J., Lu W. T., et al ,2013: Characteristics of return stroke currents of classical and altitude triggered lightning in GCOELD in China. Atmos. Res. , 129-130 , 67–68. DOI:10.1016/j.atmosres.2012.11.009 |
| Zhou E. W., Lv W. T., Zhang Y., et al ,2013: Correlation analysis between the channel current and luminosity of initial continuous and continuing current processes in an artificially triggered lightning flash. Atmos. Res. , 129-130 , 79–89. DOI:10.1016/j.atmosres.2012.10.020 |
| Zhou Wei, Zhang Yang, Zhang Yijun, et al ,2014: Occurrence regularity of CPT discharge event in negative cloud-to-ground lightning. Acta Phys. Sinica , 63 , 019202. |