 2016, Vol. 30
The Chinese Meteorological Society
Article Information
- LIU Qiong, WANG Yuan, KUANG Zhongyu, FANG Sihua, CHEN Yonghang, KANG Yanming, ZHANG Hua, WANG Daoyuan, FU Yingying . 2016.
- Vertical Distributions of Aerosol Optical Properties during Haze and Floating Dust Weather in Shanghai. 2016.
- J. Meteor. Res., 30(4): 598-613
- http://dx.doi.org/10.1007/s13351-016-5092-4
Article History
- Received October 27, 2015
- in final form May 14, 2016


 ,
, 2. Department of Environmental Science, Rutgers University, New Brunswick, NJ 08901, USA;
3. National Climate Center, China Meteorological Administration, Beijing 100081, China;
3. Baruch College, City University of New York, New York 10041, USA;
5. Department of Land, Air, and Water Resources, University of California, Davis, California 95616, USA
Shanghai, as a typical metropolis located on the eastern coast of China, has suffered from severe atmospheric environmental problems, such as haze, atmospheric oxidation, and volatile organic compound pollution, during the last two decades (Geng et al., 2007; Fu et al., 2008; Chen et al., 2012) . In addition, it has also suffered from dust particles, which mostly originate from deserts in northwestern China. One of the most major sources of mineral particles is the Taklimakan Desert, which contributes considerable amounts of dust aerosols in the atmosphere every year (Textor et al., 2006; Wang Wencai et al., 2015) . Dust can worsen the air quality of both the source area and downstream cities (Yoshioka et al., 2007) . In this case, dust originated from the Taklimakan and Gobi deserts and finally reached southern and eastern China, including Shanghai, and even the Pacific Ocean and North America (Haywood et al., 1999; Higurashi and Nakajima, 2002; Takemura et al., 2002; Huang et al., 2008a) . According to the meteorological definition, dust weather can be classified into three types: dust storm, blowing dust, and floating dust. Floating dust is the main type of dust weather, which influences Shanghai after long-term transport, with gradually weakened wind and reduced dust aerosol loading. Floating dust pollution happened 25 times in Shanghai from December 2008 to November 2010 (Wang et al., 2014) , and mostly occurred in spring (Fig. 1) . Therefore, it has become a serious environmental problem in Shanghai.

|
| Figure 1 Seasonal frequency of haze and floating dust weather from December 2008 to November 2010 in Shanghai. |
Aerosol is a critical factor in both regional and global climate due to its direct effect on the earthatmosphere system and indirect effect on cloud and precipitation (Podgorny and Ramanathan, 2001; Yu et al., 2012; Jiang et al., 2013) . Aerosol can participate in many complex physical and chemical reactions and easily carry other air pollutants, such as organic irons, heavy metals, and bacteria, during its transport (Liu Yuzhi et al., 2014) . Both haze and floating dust can reduce the horizontal visibility to less than 10 km (China Meteorological Administration, 2007, 2010) , whereas their aerosol microphysical and optical properties are quite different (Huang et al., 2008b; Chen et al., 2010; Yang Jun et al., 2010; Wu, 2011; Chen et al., 2012; Liu et al., 2012; Ge et al., 2014) .
Although plenty of studies h ave been conducted on the causes, sources, properties, and environmental impacts of haze aerosols (Qureshi et al., 2006; Yang Weifen et al., 2010; Wu, 2011; Yang et al., 2012) , and on the emissions, distributions, characteristics, and climate impacts of dust aerosols (Satheesh and Ramanathan, 2000; Chen et al., 2009; Knippertz and Todd, 2010; Li et al., 2011; Hansell et al., 2012) , comparative studies of haze and floating dust aerosols are still rare. Che et al. (2005) and Yu et al. (2011) analyzed the aerosol optical and physical characteristics of dust and haze in the Mu Us desert and Beijing. Significant differences in the optical thickness, single scattering albedo, and distribution of volume spectrum between the two types of severe pollution were found. Zhou et al. (2012) studied the density concentrations and chemical compositions of fine particles during haze and dust episodes in downtown Shanghai in autumn, and revealed the features of both types of pollution. Pachauri et al. (2013) studied total suspended particulate samples collected during dust and haze weather, and indicated that Ca2+, Cl-, NO3-, and SO42- were the most abundant ions in dust, while secondary aerosol species were the majority of particles in haze. Studies on the vertical distributions of aerosols of both types of pollution are still limited, despite the vertical structure being one of the crucial factors in assessing the radiative effects of aerosols (Claquin et al., 1998; Zhu et al., 2007) .
Among the different surface active remote sensing techniques, micro pulse lidar (MPL) has displayed the best performance in continuously monitoring aerosols (Pan et al., 2010) . It offers a new perspective for research on aerosols by providing the vertical structure of atmospheric aerosols, and relevant optical properties with high temporal and spatial resolutions (Hua et al., 2004) . Huang et al. (2010) estimated the effect of dust on radiative forcing and its associated climate impacts by using three MPL systems. Srivastava et al. (2011) studied the impact of long-range transported dust aerosols in the central Himalaya with the help of MPL. Niranjan et al. (2007) used MPL observations to characterize the spatiotemporal distributions of high-altitude aerosol layers in India.
Although there have been a number of studies on either haze or dust, comparative studies between haze and dust by using MPL are rare. In this work, aerosol vertical profiles during haze and floating dust cases were measured with an MPL system located in Shanghai (31°13'16.6"N, 121°32'54.8"E) in December 2008 and November 2010. A comparative analysis was conducted to investigate the differences in the vertical structure and optical properties of aerosols during haze and floating dust weather, by combining meteorological observations with the MPL observation. Furthermore, two typical cases of haze and floating dust weather were analyzed to examine the differences in aerosols. The objective of this study was to provide a reference for future work on analyzing the differences in aerosol profiles during haze and floating dust weather, and to assist in their forecasting.
2 Mate rials and methods 2.1 MPLThe MPL (MPL_4B, Sigma Space Inc., San Fran-cisco, America) used in this study, is installed in a room of the Shanghai Urban Environmental Meteorological Center (31°13,16.6"N, 121°32'54.8"E) where temperature and humidity are controlled. The system is composed of a laser; a signal control unit; an optical transceiver, working as both a transmitter and a receiver; and a data processor. A diode-pumped Nd: YLF (Neodymium-doped Yttrium Lithium Fluoride) laser with a second harmonic output at 527 nm is operated at 2500 Hz. Continual aerosol measurements are acquired with a 30-m range resolution and a 30- s accumulation time, and the detection range is from 150 to 25000 m.
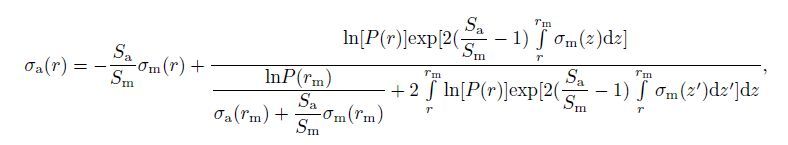
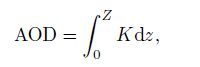
The MPL has been in operation for 24 h a day, without any break, since May 2008. During observation, the lidar system collects the backscattered signals that travel from lower atmospheric aerosols. The aerosol extinction coefficient and aerosol optical depth (AOD) retrieved by the algorithm according to Fernald (1984) and Klett (1985) are described by
|
(1) |
where the subscripts “a” and “m” represent aerosols and air molecules, respectively; P is the atmospheric backscattering echo power at the height r received by the lidar; S is the extinction backscattering ratio; and σ (r) is the extinction coefficient at the height r; and
|
(2) |
where K is the extinction coefficient and dz is the optical path. The atmospheric boundary layer is retrieved by the normalized gradient method (Wang et al., 2012) .
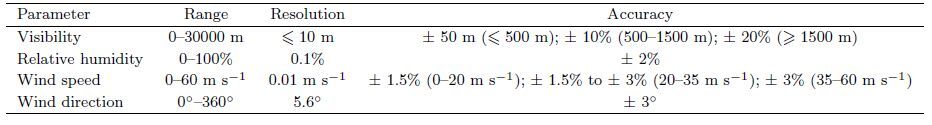
2.2 Surface meteorologySurface meteorological data used to identify haze and floating dust con ditions were obtained from the Shanghai Urban Environmental Meteorological Center. The visibility, relative humidity (RH) , and wind speed or direction were measured by an automatic weather station (Milos-500, Vaisala Inc., Helsinki, Finland) . The measuring ranges, resolutions, and accuracies of Milos-500 are summarized in Table 1.
The HYSPLIT (Hybrid Single-Particle La-grangian Integrated Trajectory) model is a complete system for computing both simple air parcel trajectories and complex dispersion and deposition simulations, developed by the Air Resources Laboratory of NOAA and the Australian Bureau of Meteorology. It is designed to support a wide range of simulations related to the atmospheric transport and dispersion of pollutants and hazardous materials, as well as the deposition of these materials on the earth’s surface. The model calculation method is a hybrid between the La-grangian approach, which uses a moving frame of reference for advection and diffusion as air parcels move from their initial location, and the Eulerian approach, which uses a fixed three-dimensional grid as a frame of reference to compute pollutant air concentrations (Stein et al., 2015) .
In this study, the model was run interactively online through the READY (Real-time Environmental Applications and Display System) system available on its official website. Each backward trajectory was calculated for 36 h to track the areas that the air plumes passed, and then to identify the potential aerosol transport pathways.
2.4 Data selectionAccording to the newly issued standards for meteorological observational operations (China Meteorological Administration, 2010) , and a previous study by Wu (2008) , a haze hour was defined as a study period of 1 h in which the average visibility was less than 10 km and the average RH was less than 95%, without any precipitation, dust storm, blowing sand, dust, smoke, blowing snow, or snow storm. Haze days were identified as days with two or more haze hours, observed from 0800 to 1800 BT (Beijing Time) .
Huang et al. (2008b) found that aerosols are mostly confined to a shallow layer of a-few-hundredmeter thick in the early morning, and as the time progresses, the aerosol layer expands to a thicker layer of more than 1500 m. Therefore, only the aerosol extinction coefficient data from 0 to 3 km were analyzed in this study. No comparison was done in summer in this paper since floating dust weather never occurred in summer over Shanghai during the study period.
Floating dust days were identified according to whether they matched either one of the following conditions, based on the Chinese national standards for grading a sand or dust storm (China Meteorological Administration, 2006) . (1) The four meteorological stations of Pudong, Xujiahui, Baoshan, and Jinshan observed dust at the same time; and (2) remote sens-ing information reported a dust storm occurring over northern China; meanwhile, the visibility was less than 10 km, the wind speed was less than or equal to 3 m s-1, and the wind was blowing from the source of the dust storm without other weather combinations in Shanghai. In this study, the observation period in Shanghai was from December 2008 to November 2010. Haze and floating dust weather were classified into two levels according to the differences of visibility: (1) mild-slight (M-S) when visibility is between 3 and 10 km, and (2) severe-moderate (S-M) when visibility is smaller than 3 km. Finally, to better understand the vertical distributions of aerosol optical properties during haze and floating dust weather, a haze pollution case that occurred during 28 and 29 January 2010, and a floating dust pollution case during 20 and 21 March 2010, were analyzed and compared in detail.
3 Results and discussion 3.1 Seasonal variation of the vertical distribution of aerosol extinction coefficientAs presented in Fig. 2, the values and profiles of the aerosol extinction coefficients during haze and floating dust periods were significantly different. The aerosol extinction coefficients in haze ranged from 0.25 to 1.30 km-1, much larger than those in floating dust weather (0.20-0.35 km-1) , below 3 km. The aerosol extinction coefficients during haze periods in winter were the largest at all levels, followed by autumn and spring from 0.4 to 3.0 km and by spring and autumn below 0.4 km. The aerosol extinction coefficients during floating dust weather from 0.5 to 3.0 km were larger in spring than those in winter and autumn; while below 0.5 km, they were the largest in winter among the three seasons.

|
| Figure 2 Seasonal vertical variations of aerosol extinction coefficient during (a) haze and (b) floating dust weather. |
The aerosol extinction coefficient of floating dust gradually increased with decreasing altitude in spring, autumn, and winter. In contrast, the vertical distributions of the aerosol extinction coefficients during haze varied with season. Two obvious peaks were apparent in autumn and winter: one peak was at 1.0 km, with a maximal value of 1.3 km-1 in autumn; and the other was at 1.9 km, with a value of 0.25 km-1. In spring, aerosol extinction coefficients increased as altitude decreased.
In winter, surface temperature is lowest and the atmosphere is unstable, which makes it difficult for pollution to dissipate. This chain effect yields a much higher extinction coefficient in the lower atmosphere in winter, as compared to spring and autumn. In the winters of the last three years, there were several long-lasting and severe haze pollution episodes over eastern and northern China (Bi et al., 2014) , and Shanghai was one of the most severely affected cities (Li et al., 2015a) . The pollution in Shanghai was closely associated with anthropogenic emissions, especially from vehicles, which caused the accumulation of pollutants in the lower atmosphere. In autumn, Northwest China is mainly controlled by dry conditions and high pressure systems, which produce relatively good air quality without much pollution. The lower atmosphere demonstrated higher light extinction and a more dispersive extinction coefficient spectrum during the studied haze periods. The peak value of extinction coefficient for floating dust appeared in the upper atmosphere in spring, due to the frequent sandstorms of northern China. Apart from the differences in seasonal variations of aerosol extinction ability between haze and floating dust, their vertical distributions were also different. Taking winter as an example, the peak value of aerosol extinction appeared at around 1 km during haze. It became stronger with decreasing altitude during floating dust. The planetary boundary layer is directly affected by surface conditions, including anthropogenic activities. In winter, the aerosol pollution was more closely related to meteorological conditions during haze than during floating dust.
To further examine the vertical distribution of aerosol extinction, we selected the data at 0900, 1200, 1500, and 1800 BT as representative of morning, noon, afternoon, and dusk cases, since aerosols are associated with different anthropogenic activities during these periods. As shown in Fig. 2a, the aerosol extinction coefficients in spring, autumn, and winter during haze periods va ried from 0 to 0.40 km-1, 0 to 0.28 km-1, and 0 to 1.20 km-1, respectively. In contrast, the extinction from aerosols during floating dust periods was weaker, especially in winter. As shown in Fig. 2b, the maximal value of aerosol extinction coefficient was 0.34 km-1, but it was only 0.28 km-1 during haze pe-riods.
Detailed daily vertical distributions of extinction coefficient in the three seasons during haze are displayed in Figs. 3a1, 3b1, and 3c1. The aerosol extinction at 1200 BT was the strongest during daytime from the surface to 3 km in both spring and autumn. However, aerosol extinction was strong throughout the day in winter.

|
| Figure 3 Diurnal vertical variations of aerosol extinction coefficient during (a1-c1) haze and (a2-c2) floating dust weather in (a1, a2) spring, (b1, b2) autumn, and (c1, c2) winter. |
In spring, there was a rising trend of the altitude of aerosol layers from morning to afternoon, and a downward tendency till dusk (Fig. 3a1) . Aerosol extinction appeared at 210 m at 0900 BT, with an extinc-tion coefficient of 0.30 km-1. It then reached a max-imal value of 0.66 km-1 at 300 m during daytime, at 1200 BT. The aerosol layer uplifted to 360-m altitude at 1500 BT, with a decreased extinction coefficient of 0.32 km-1; and shrunk to 300 m at 1800 BT, with a higher extinct coefficient of 0.47 km-1. Generally, most aerosols appeared below 360 m. The depth of the aerosol layer of haze maintained at less than 1 km in autumn and demonstrated a similar diurnal variation in spring (Fig. 3a1) . The extinction coefficient increased from 0900 till 1200 BT, with a maximal value of 0.38 km-1 at 420-m altitude. Thereafter, it continued to decrease for 3 h, before rising for a second time from 1500 to 1800 BT. The largest aerosol extinction coefficient was in winter (Fig. 3c1) , with the strongest fluctuation, and this may have been caused by the relatively low and unstable boundary layer, which can be easily influenced by anthropogenic heat resources (Jiang and Chen, 2007) . The lowest haze aerosol layer was at 570-m altitude at 1200 BT, which corresponded to the highest extinction coefficient of 1.24 km-1. The aerosol layer then rose up to about 1.41 km till 1800 BT, and the extinction coefficient increased to 2.04.
A bimodal shape, with one peak at nightfall and the other in the morning or at noon, was observed in the diurnal variance of extinction coefficient during haze. A high concentration of aerosols emerged in the lower atmosphere (around 210 m) at 0900 BT, which was a result of the combination of relatively low atmospheric temperature inversion and strong anthropogenic pollution emissions. Surface temper ature dropped off more rapidly compared to that in the lower atmosphere, resulting in a lower atmosphere temperature inversion at night due to the lack of shortwave solar radiation. Because the temperature inversion in the Yangtze River delta often happens at nightfall and starts to diminish the next morning or noon, haze aerosols are usually mitigated in the afternoon, accompanied by a minimum extinction coefficient. The unstable and not well-mixed boundary layer can expand and benefit aerosol diffusion in the afternoon. The dominant influence of enhanced anthropogenic emissions results in a peak of haze extinction coefficient at nightfall. Solar radiation can also influence the development of haze aerosol layers. Solar radiation heats up the surface and reinforces vertical convection; thus, the temperature inversion weakens and results in an increase in boundary layer height.
The vertical distributions of aerosols during floating dust and haze were significantly different. Floating dust aerosols were mostly distributed within 0.2-2.0- km altitude, with a maximal extinction coefficient at about 210 m. Aerosol extinction coefficients in spring increased with time during floating dust weather (Fig. 3a2) . They peaked at 0900 BT, with a value of 0.26 km-1 (at 210 m) in autumn, and peak values were all at around 0.14 km-1. There was no obvious diurnal cycle in extinction coefficient (Fig. 3b2) . The aerosol layer expanded from 500 to 1500 m during 0900-1800 BT (Fig. 3c2) . The extinction coefficients in spring, autumn, and winter all varied in the range of 0-0.4 km-1.
The aerosol layer of floating dust thickened during daytime in spring, autumn, and winter. The extinction coefficients on dust days increased with time in spring, which was not singly caused by anthropogenic activities. Previous research (Liu and Niu, 2006) indicated that the aerosol size distribution shows a significant discrepancy under different weather conditions. For example, large dust particles and giant dust particles increase remarkably during dust weather. The thickness of the aerosol layer is closely related to the turbulence of the boundary layer. The period from noon to nightfall favors the formation of sandstorms. Wind blowing from the north can bring more dust during such a period. Moreover, the stratification of the atmosphere is relatively stable at nightfall, with a relatively higher extinction coefficient, since weather conditions are unfavorable for diffusion.
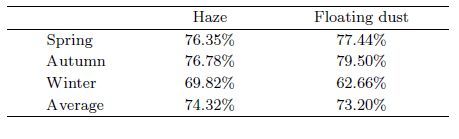
3.2 AODThe AOD measures the radiation that can pass through the aerosol layer and reach the surface, which plays an important role in the surface radiation budget. The AOD at 527 nm for haze and floating dust weather, and the integral of extinction coefficients from 0 to 3 km (AOD3) and 0 to 1 km (AOD1) , are shown in Fig. 4 and Table 2. Similar seasonal variations of optical thickness were observed for haze and floating dust weather (Figs. 5a and 5b) , and the AOD decreased in the following sequence: winter > spring > autumn, which was consistent with the seasonal variation of extinction coefficient. The average AOD1 accounted for 74.32% of AOD3, indicating that most aerosols accumulated in the lower atmosphere (0-1 km) on haze days. The average AOD1 accounted for 73.20% of AOD3 on floating dust days, which was relatively lower than on haze days.

|
| Figure 4 Seasonal variations of AOD during (a) haze and (b) floating dust weather. |

|
| Figure 5 AODs for intense haze and floating dust weather. |
Human beings use large amounts of fossil fuels, such as coal, in winter. The atmospheric turbulence reached its weakest point at the same time, with limited rainfall, leading to less wet scavenging of aerosols. Spring was the second most polluted season, due to the influence of the long-range transport of mineral parti-cles from northwestern China. Better meteorological conditions in autumn favor atmospheric contamination dispersion, and can result in better air quality.
The values of AOD during different intense haze and floating dust weather according to the visibility are presented in Fig. 5. It was defined as mild-slight (M-S) pollution when visibility was between 3 and 10 km; and as severe-moderate (S-M) pollution when under 3 km. The AOD1s of S-M and M-S haze were 0.5854 and 0.2252, respectively. The results show that S-M haze happened less frequently than M-S haze in Shanghai, but it influenced air quality and human health much more strongly, thus S-M haze deserves greater attention. The AOD1s of mildly polluted days Haze Floating dust during floating dust weather were lower than those of severely polluted days.
More than 85% of aerosols were distributed in the lower layer of the atmosphere within 1 km from the surface when serious air pollution occurred, while aerosols were widely distributed within 3 km of the atmosphere on severe and moderate polluted days. We speculate that the drop in the majority of aerosols in height was mainly due to poor ventilation conditions in Shanghai. The high density of buildings and skyscrapers could limit the vertical mixing of air through the city and lead to higher aeros ol extinction coefficient near the surface with severely polluted air.
3.3 Comparison between a haze and a floating dust case 3.3.1 Meteorological factorsThe haze case began at 0800 BT 28 January 2010 and persisted till 2300 BT 29 January 2010. The floating dust case started at 0800 BT 20 March 2010 and ended at 1000 BT 21 March 2010. Variations in meteorological factors during daytime are shown in Fig. 7, and the 36-h backward trajectories of the haze and floating dust cases are shown in Fig. 8.
It was rainy during 0000-0800 BT 28 January 2010, resulting in high RH. The high RH continued afterwards with an average of 77%. The haze was identified as S-M haze, since the visibility was lower than 3 km, till 0500 BT 29 January 2010. The RH reached above 95% with visibility below 1 km from 0500 to 0800 BT 29 January 2010, and this period was i dentified as fog. Air quality became better and visibility started to increase from 1000 BT 29 January 2010, but the weather condition was still considered as slight haze. RH first declined and then rose at nightfall on 29 January 2010. Significant negative correlation between visibility and RH was observed before 1300 BT 29 January 2010, with a correlation coefficient of - 0.7866 (p < 0.001) . The extinction from aerosols with higher humidity is much stronger, resulting in lower visibility (Li et al., 2005) . The strong negative correlation between humidity and visibility in Shanghai indicated that the visibility would decrease with increased humidity.
The airflow at 500-m altitude reaching Shanghai originated from the sea, while the airflow at 1000 and 1500 m both originated in central China (Fig. 7a) . Therefore, southwesterly and southeasterly were the predominant wind. Winds strongly influenced visibility (Fig. 6a) . The wind speed before 0800 BT 28 January 2010 was low. The main surface wind direction was from the southwest, and then gradually turned to the northeast. The wind speed rose to 2.6 m s-1 in the afternoon and reached 3.9 m s-1 at 1300 BT 29 January 2010, with a leading wind from northeast. The visibility improved with the increase in wind speed, and the northeastern wind from clean marine areas stimulated the evacuation of aerosols. Higher wind speed can result in stronger horizontal convection, which is conducive to the spreading of aerosols. The haze case went through multiple transition processes in the sequence of precipitation, severe haze, fog, mild haze, and slight haze, and can thus be considered as a mixed pollution event with fog and haze.

|
| Figure 6 Diurnal variations of meteorological factors in the (a) haze and (b) floating dust cases. |

|
| Figure 7 The 36-h backward traj ectories of the (a) haze and (b) floating dust cases at 500-, 1000-, and 1500-m height. |

|
| Figure 8 Aerosol extinction intensity of (a) haze and (b) floating dust weather. |
Figure 7b shows that the airflow trajectories at 500, 1000, and 1500 m all originated from the northwest—the source of dust. The floating dust occurred from 1000 BT 20 to 1300 BT 21 March 2010, and included two floating dust processes. The first process happened from 1000 BT 20 to 0800 BT 21 March 2010, with visibility less than 3.5 km, and dust was transported a long distance from a 2-day sandstorm in Mongolia on 19 March 2010. The second floating dust process occurred from 0800 to 1300 BT 21 March 2010, due to the backflow from the first floating dust process (Ma et al., 2012) . The RH in the floating dust cases decreased at the beginning and then gradually increased, consistent with the results of Song et al. (2010) . The average RH during the floating dust weather was 41%. No obvious correlation between RH and visibility was observed, which indicated that floating dust weather was a dry obstruction to visibility. The wind speed varied significantly, with a peak at 3.8 m s-1 (at 2100 BT 20 March 2010) , a minimum of 0.7 m s-1 (at 2000 BT 20 March 2010) , and an average wind speed of 2.15 m s-1. The aerosols were brought by a northerly cold front at high levels, since the leading surface wind was mainly from northwest— the same direction as the pollution source. It then piled up in the upper air over Shanghai and was pulled down gravitationally toward the ground. The vertical diffusion of heavier pollution was closely related to the wind. The surface wind changed to easterly in the morning of 21 March 2010. The visibility then increased with higher wind speed. The dilution of clean air from the sea helped reduce the dust particle concentration.
3.3.2 Optical propertiesThe vertical distributions of extinction coefficient during the haze and floating dust periods are shown in Fig. 8. Wind speed is a critical meteorological factor in the dissipation and diffusion of particles, since it influences atmospheric turbulence. Aerosols accumulated in the lower 0.5 km of the atmosphere after 28 January 2010 when haze happened. The aerosol extinction was the strongest from 0800 to 1600 BT and the aerosol layer became thicker from 0800 BT 28 January 2010, due to the higher wind speed (Fig. 6a) . Wind speed reduced and the aerosol layer subsided at 0900 BT 29 January 2010. Wind speed increased again after 1000 BT 29 January 2010, and aerosols were lifted vertically to 2 km. The altitude of the aerosol layer can be uplifted by stronger wind, accelerating the diffusion of aerosols and mitigating the pollution near surface.
Few aerosols were observed before 0800 BT 20 March 2010 (Fig. 8b) . The extinction coefficient in the lower atmosphere became larger when floating dust happened. Most floating dust aerosols were concentrated below 1 km, which was thicker than the haze aerosol layer. The aerosol layer lifted to 2.8 km and the extinction coefficient declined to as small as 0.05 km-1 at noon of 21 March 2010, du e to the increase in wind speed and the changes in wind direction caused by a stronger turbulent-mixing effect and the arrival of clean marine air.
The vertical extinction profiles of selected hours for different intense haze and floating dust weather are presented in Fig. 9. Noticeable differences were found in the thickness of the aerosol layer and the magnitude of the extinction coefficient for different intensities of haze. The extinction coefficient approached 0.4 km-1, and the majority of aerosols concentrated at 300-m altitude, during S-M haze at 0800 BT, due to strong absorption of radiation by rain (Fig. 9) . The aerosol layer was then lifted up to 0.5 km. Extinction coefficients ranged from 0 to 0.7 km-1, and the maximal value was observed at 210 m, with intense atmospheric turbulence. The extinction reduced to 0.25 km-1, and the aerosol layer lifted up to 1 km, when it was mild haze at 1200 BT (Fig. 9b) . No significant diurnal cycle of extinction was observed.

|
| Figure 9 Aerosol extinction vertical profiles of (a) S-M haze, (b) M-S haze, and (c) floating dust weather. |
Most aerosols existed below 2.5 km, with an extinction coefficient lower than 0.1 km-1 at 0800 BT, during the floating dust weather. The aerosol layer gradually suppressed and the surface extinction coefficient increased to a maximum of 0.41 km-1 at 1800 BT. The results indicate that dust aerosols were transported from the higher to the lower atm osphere, and the thickness of the aerosol layer was maintained below 1.0 km. The extinction of floating dust aerosols decreased with height and a similar trend was observed in different magnitudes of visibility, which was slightly smaller than severe haze.
According to related studies on haze in Shanghai (Li et al., 2015a, b) , haze aerosols are generated from the surface and then lifted up to the air in most situations. Extinction coefficients of haze decrease during the lifting process, but dust aerosols are transported vertically from the higher atmosphere to the surface, and the extinction coefficient increases during settling. Extinction coefficients of haze aerosols in the lower atmosphere are generally larger than those of floating dust aerosols.
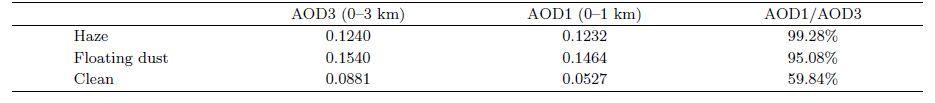
As presented in Table 3, the AOD3 of clear con-ditions in Shanghai was 0.0881, and rose up to 0.1240 when haze occurred. It was larger for floating dust weather, with a value of 0.1540. A thicker aerosol layer of floating dust may lead to a manifest increase in AOD and result in a stronger radiation effect. Approximately 99% of the haze AOD3 was contributed by the aerosols from the atmosphere lower than 1 km. In contrast, the floating dust aerosols from the atmosphere lower than 1 km contributed 95% of the AOD3. Both of them were much higher than that of clear days, on which the ratio of AOD1/AOD3 was only about 59%. The results indicated that aerosols were mainly concentrated in the atmosphere lower than 1 km dur-ing these cases, especially for haze.
The AOD for haze and floating dust weather varied between 0 and 0.4 (Fig. 10) , smaller than the average AOD range of 0.7-0.9 for northeastern China (Luo et al., 2014) . A significant increase in AOD, with a range of 0.1-0.4, was observed during floating dust weather, especially in the early morning of 21 March 2010. The wind direction changed to northerly, with a high wind speed, and brought more dust aerosols (Fig. 6) . Meteorological conditions played a critical role in the occurrence and dissipation of aerosols during the floating dust event. In contrast, no obvious difference was observed in AOD during the haze event. A significant diurnal cycle was observed during haze. The maximal AOD was observed at noon and the minimum at night, which was associated with solar radiation. Pollutants stayed in the atmosphere for a relatively longer time during the haze event.

|
| Figure 10 AOD of the (a) haze and (b) floating dust cases. |
Daily variations of the atmospheric boundary layer during the two cases are presented in Fig. 11. The boundary layers were strongly influenced by thermo-turbulence in both haze and floating dust weather. Variations of the boundary layers were associated with solar radiation and atmospheric stability. The observed diurnal feature of a higher boundary layer at noon and a lower boundary layer at night was similar. Boundary layers were both relatively thinner before the dawn, which limited the vertical transport of pollutants and might have caused an accumulation of aerosols in the lower atmosphere. The variation of the boundary layer depth was small, with an average value of 390.63 m during the haze episode, but the depth of the boundary layer during floating dust weather varied widely, with an average value of 719.88 m. The results indicate that the boundary condition of haze was more stable, and it could lead to worse dissipation conditions compared to floating dust weather. Compared with Fig. 6, the variation of boundary layer thickness was similar to that of AOD, indicating that the boundary layer can interact with pollutants during haze case.

|
| Figure 11 Atmospheric boundary layer height of the haze and floating dust cases. |
In this study, lidar data obtained from MPL were analyzed to understand the vertical distribution of the optical properties for haze and floating dust aerosols in Shanghai. The extinction coefficients of haze and floating dust both decreased with increasing height. For haze, they ranged from 0.25 to 1.50 km-1, and the diurnal variance showed a bimodal shape, with two peaks in the morning or at noon, and nightfall, respectively. Moreover, seasonal variations of the vertical distribution of the aerosol extinction coefficient during haze and floating dust were different. There were two obvious peaks in autumn and winter, respectively; whereas in spring, they increased as the altitude decreased. In contrast, the aerosol extinction coefficient ranged from 0.20 to 0.35 km-1 and gradually increased with decreasing altitude in all three seasons during floating dust weather. The depth of the haze aerosol layer was mostly lower than 1 km, but the depth ranged from 0 to 2 km for floating dust weather, which was relatively higher.
The aerosol extinction and AOD for both haze and floating dust weather in winter were the largest, followed by spring, while those in autumn were the smallest. For different types of intense pollution, the aerosols of S-M haze and floating dust weather were mostly concentrated in the atmosphere lower than 1 km; however, those of M-S haze and floating dust weather were found up to 3 km.
Case studies showed that the haze aerosols were generated from the surface and then lifted up, and the extinction coefficient decreased during this lifting. While the floating dust aerosols were deposited vertically from the higher atmosphere to the surface, the extinction coefficient increased when settling. The average AOD during the floating dust was 0.1543, which was higher than that during the haze, with an average value of 0.1240. Although the boundary layers of haze and floating dust were both heavily influenced by solar radiation, it was more stable during the haze than the floating dust weather.
Acknowledgments: The MPL data and surface meteorological data were obtained from Pudong Meteorological Office in Shanghai. We thank the two anonymous reviewers and the editors for their comments.| Bi J. R, J. P Huang, Z. Y Hu, et al. ,2014: Investigating the aerosol optical and radiative characteristics of heavy haze episodes in Beijing during January of 2013. J. Geophys. Res. , 119 , 9884–9900. DOI:10.1002/2014JD021757 |
| Che Huizheng, Zhang Xiaoye, Shi Guangyu, et al. ,2005: Aerosol optical characteristics in Mu Us Desert under weather conditions of dust storm and haze. China Powder Sci. Technol. , 11 , 122–125. |
| Chen B, J.P Huang, P Minnis, et al. ,2010: Detec-tion of dust aerosol by combining CALIPSO active lidar and passive ⅡR measurements. Atmos. Chem. Phys , 10 , 4241–4251. DOI:10.5194/acp-10-4241-2010 |
| Chen Yonghang, Mao Xiaoqin, Huang Jianping, et al. ,2009: Vertical distribution characteristics of aerosol during a long-distance transport of heavy dust pollution. China Environ. Sci. , 29 , 449–454. |
| Chen Y.H, Q Liu, F.H Geng, et al. ,2012: Vertical distribution of optical and micro-physical properties of ambient aerosols during dry haze periods in Shanghai. Atmos. Environ. , 50 , 50–59. DOI:10.1016/j.atmosenv.2012.01.002 |
| China Meteorological Administratio. ,2006: GB/T 20480-2006 Grade of sand dust storm weather. Standard Press of China, Beijing , 1–2. |
| China Meteorological Administratio. ,2007: QX/T 48-2007 Specifications for surface meteorological observation. Part 4:Observation of weather phenomenon. China Meteorological Press, Beijing , 6. |
| China Meteorological Administratio. ,2010: QX/T 113-2010 Observation and forecasting levels of haze. China Meteorological Press, Beijing , 1–2. |
| Claquin T, M Schulz, Y Balkanski, et al. ,1998: Uncertainties in assessing radiative forcing by mineral dust. Tellus B , 50 , 491–505. DOI:10.1034/j.1600-0889.1998.t01-2-00007.x |
| Fernald F.G. ,1984: Analysis of atmospheric lidar observations:Some comments. Appl. Opt. , 23 , 652–653. DOI:10.1364/AO.23.000652 |
| Fu Q. Y, G.S Zhuang, J Wang, et al. ,2008: Mechanism of formation of the heaviest pollution episode ever recorded in the Yangtze River delta, China. Atmos. Environ. , 42 , 2023–2036. DOI:10.1016/j.atmosenv.2007.12.002 |
| Ge J.M, J.P Huang, C.P Xu, et al. ,2014: Characteristics of Taklimakan dust emission and distribution: A satellite and reanalysis field perspective. J. Geophys. Res. , 119 , 11772–11783. DOI:10.1002/2014JD022280 |
| Geng F.H, C.S Zhao, X Tang, et al. ,2007: Analysis of ozone and VOCs measured in Shanghai: A case study. Atmos. Environ. , 41 , 989–1001. DOI:10.1016/j.atmosenv.2006.09.023 |
| Hansell R.A, S.C Tsay, N.C Hsu, et al. ,2012: An assessment of the surface longwave direct radiative effect of airborne dust in Zhangye, China, during the Asian monsoon years field experiment (2008). J. Geophys. Res. , 117 , D00K39. DOI:10.1029/2011JD017370 |
| Haywood J.M, V Ramaswamy, B.J Sode. ,1999: Tropospheric aerosol climate forcing in clear-sky satellite observations over the oceans. Science , 283 , 1299–1303. DOI:10.1126/science.283.5406.1299 |
| Higurashi A, T Nakajim. ,2002: Detection of aerosol types over the East China Sea near Japan from four-channel satellite data. Geophys. Res. Lett. , 29 . DOI:10.1029/2002GL015357 |
| Hua D.X, M Uchida, T Kobayash. ,2004: Ul-traviolet high-spectral-resolution Rayleigh-Mie lidar with a dual-pass Fabry-Perot etalon for measuring atmospheric temperature profiles of the troposphere. Opt. Lett. , 29 , 1063–1065. DOI:10.1364/OL.29.001063 |
| Huang J.P, P Minnis, B Chen, et al. ,2008a: Long-range transport and vertical structure of Asian dust from CALIPSO and surface measurements during PACDEX. J. Geophys. Res , 113. DOI:10.1029/2008JD010620 |
| Huang Jianping, Huang Zhongwei, Bi Jianrong, et al. ,2008b: Micro-pulse lidar measurements of aerosol vertical structure over the Loess Plateau. Atmos. Oceanic Sci. Lett , 1 , 8–11. |
| Huang Z.W, J.P Huang, J.R Bi, et al. ,2010: Dust aerosol vertical structure measurements using three MPL lidars during 2008 China-U. S. joint dust field experiment. J. Geophys. Res. , 115 . DOI:10.1029/2009JD013273 |
| Jiang Weimei, Chen Ya. ,2007: The impact of anthropogenic heat on urban boundary layer structure. Chinese J. Atmos. Sci. , 31 , 36–46. |
| Jiang Y.Q, X.H Liu, X.Q Yan, et al. ,2013: A nu-merical study of the effect of different aerosol types on East Asian summer clouds and precipitation. Atmos. Environ. , 70 , 51–63. DOI:10.1016/j.atmosenv.2012.12.039 |
| Klett J.D. ,1985: Lidar inversion with variable backscat-ter/extinction ratios. Appl. Opt. , 24 , 1638–1643. DOI:10.1364/AO.24.001638 |
| Knippertz P, M. C Todd. ,2010: The central west Saharan dust hot spot and its relation to African easterly waves and extratropical disturbances. J. Geophys. Res , 115 . DOI:10.1029/2009JD012819 |
| Li Hongjing, Sun Dongsong, Yang Chunhu, et al. ,2005: Atmospheric extinction monitoring over Suzhou city by a 1064-nm lidar. Laser Infrar. , 35 , 323–326. |
| Li J.M, Y.H Yi, P Minnis, et al. ,2011: Radiative effect differences between multi-layered and singlelayer clouds derived from CERES, CALIPSO, and CloudSat data. J. Quant. Spectrosc. Ra. , 112 , 361–375. DOI:10.1016/j.jqsrt.2010.10.006 |
| Li Li, Cai Junlin, Zhou Min. ,2015a: Potential source contribution analysis of the particulate matters in Shanghai during the heavy haze episode in eastern and middle China in December, 2013. Environ. Sci , 36 , 2327–2336. |
| Li Li, An Jingyu, Yan Rusha. ,2015b: Source contribution analysis of the fine particles in Shanghai during a heavy haze episode in December, 2013 based on the particulate matter source apportionment technology. Environ. Sci , 36 , 3543–3553. |
| Liu Fei, Niu Shengji. ,2006: Optical thickness and size distribution of dust aerosol particles in Inner Mongolia. J. Nanjing Inst. Meteor. , 29 , 775–781. |
| Liu Qiong, Geng Fuhai, Chen Yonghang, et al. ,2012: Vertical distribution of aerosols during different intense dry haze periods around Shanghai. China Environ. Sci. , 32 , 207–213. |
| Liu Yuzhi, Jia Rui, Dai Tie, et al. ,2014: A review of aerosol optical properties and radiative effects. J. Meteor. Res. , 28 , 1003–1028. DOI:10.1007/s13351-014-4045-z |
| Luo Y.X, X.B Zheng, T.L Zhao, et al. ,2014: A climatology of aerosol optical depth over China from recent 10 years of MODIS remote sensing data. Int. J. Climatol. , 34 , 863–870. DOI:10.1002/joc.3728 |
| Ma Jinghui, Gu Songqiang, Chen Min, et al. ,2012: Analysis of a dust case using lidar in Shanghai. Acta Ecol. Sinica , 32 , 1085–1096. DOI:10.5846/stxb |
| Niranjan K, B.L Madhavan, V Sreekant. ,2007: Micro pulse lidar observation of high altitude aerosol layers at Visakhapatnam located on the east coast of India. Geophys. Res. Lett. , 34 . DOI:10.1029/2006GL028199 |
| Pachauri T, V Singla, A Satsangi, et al. ,2013: Characterization of major pollution events (dust, haze, two festival events) at Agra, India. Environ. Sci. Pollut. Res. , 20 , 5737–5752. DOI:10.1007/s11356-013-1584-2 |
| Pan Hu, Geng Fuhai, Chen Yonghang, et al. ,2010: Analysis of a haze event by micro-pulse light laser detection and ranging measurements in Shanghai. Acta Scient. Circumst. , 30 , 2164–2173. |
| Podgorny I.A, V Ramanatha. ,2001: A modeling study of the direct effect of aerosols over the tropical Indian Ocean. J. Geophys. Res. , 106 , 24097–24105. DOI:10.1029/2001JD900214 |
| Qureshi S, V. A Dutkiewicz, A. R Khan. ,2006: Elemental composition of PM2.5 aerosols in Queens, New York: Solubility and temporal trends. Atmos. Environ , 40 , 238–251. |
| Satheesh S.K, V Ramanatha. ,2000: Large differences in tropical aerosol forcing at the top of the atmosphere and earth's surface. Nature , 405 , 60–63. DOI:10.1038/35011039 |
| Song Yu, Hu Wendong, Huang Ting, et al. ,2010: Characteristics of dust floating weather in Dalian and new observation criteria. J. Desert Res. , 30 , 1229–1233. |
| Srivastava A.K, P Pant, P Hegde, et al. ,2011: The influence of a South Asian dust storm on aerosol radiative forcing at a high-altitude station in central Himalayas. Int. J. Remote Sens. , 32 , 7827–7845. DOI:10.1080/01431161.2010.531781 |
| Stein A.F, Draxler R.R, Rolph G.D, et al. ,2015: NOAA's HYSPLIT atmospheric transport and dispersion modeling system. Bull. Amer. Meteor. Soc. , 96 , 2059–2077. DOI:10.1175/BAMS-D-14-00110.1 |
| Takemura T, I Uno, T Nakajima, et al. ,2002: Modeling study of long-range transport of Asian dust and anthropogenic aerosols from East Asia. Geophys. Res. Lett. , 29 . DOI:10.1029/2002GL016251 |
| Textor C, M Schulz, S Guibert, et al. ,2006: Analysis and quantification of the diversities of aerosol life cycles within AeroCom. Atmos. Chem. Phys. , 6 , 1777–1813. DOI:10.5194/acp-6-1777-2006 |
| Wang Lin, Xie Chenbo, Wang Zhenzhu, et al. ,2012: Application of gradient method to detect height distribution of atmospheric boundary layer with lidar. J. Atmos. Environ. Opt. , 7 , 161–167. |
| Wang Wencai, Sheng Lifang, Jin Hongchun, et al. ,2015: Dust aerosol effects on cirrus and altocumulus clouds in Northwest China. J. Meteor. Res. , 29 , 793–805. DOI:10.1007/s13351-015-4116-9 |
| Wang Yuan, Deng Junying, Shi Lanhong, et al. ,2014: A floating-dust case study based on the vertical distribution of aerosol optical properties. Environ. Sci. , 35 , 830–838. |
| Wu Dui. ,2008: Distinction between haze and fog in urban metropolitans and hazy weather warnings. Environ. Sci. Technol. , 31 , 1–7. |
| Wu Dui. ,2011: Formation and evolution of haze weather. Sci. Technol , 34 , 157–161. |
| Yang F, H Chen, J.F Du, et al. ,2012: Evolution of the mixing state of fine aerosols during haze events in Shanghai. Atmos. Res. , 104-105 , 193–201. DOI:10.1016/j.atmosres.2011.10.005 |
| Yang Jun, Niu Zhongqing, Shi Chun'e, et al. ,2010: Microphysics of atmospheric aerosols during winter haze/fog events in Nanjing. Environ. Sci. , 31 , 1425–1431. |
| Yang Weifen, Yin Yan, Wei Yuxiang, et al. ,2010: Characteristics and sources of metal elements in PM2.5 during hazy days in Nanjing. China Environ. Sci. , 30 , 12–17. |
| Yoshioka M, N.M Mahowald, A.J Conley, et al. ,2007: Impact of desert dust radiative forcing on Sahel precipitation: Relative importance of dust compared to sea surface temperature variations, vegetation changes, greenhouse gas warming. J. Climate , 20 , 1445–1467. DOI:10.1175/JCLI4056.1 |
| Yu H.B, Y Zhang, M Chin, et al. ,2012: An integrated analysis of aerosol above clouds from A-Train multisensor measurements. Remote Sens. Environ. , 121 , 125–131. DOI:10.1016/j.rse.2012.01.011 |
| Yu X.N, B Zhu, Y Yin, et al. ,2011: A comparative analysis of aerosol properties in dust and haze-fog days in a Chinese urban region. Atmos. Res. , 99 , 241–247. DOI:10.1016/j.atmosres.2010.10.015 |
| Zhou Min, Chen Changhong, Wang Hongli, et al. ,2012: Chemical characteristics of particulate matters during air pollution episodes in autumn of Shanghai, China. Acta Scient. Circumst. , 32 , 81–92. |
| Zhu A.H, V Ramanathan, F Li, et al. ,2007: Dust plumes over the Pacific, Indian, Atlantic oceans:Climatology and radiative impact. J. Geophys. Res. , 112 . DOI:10.1029/2007JD008427 |