 2016, Vol. 28
The Chinese Meteorological Society
Article Information
- ZHAI Panmao, YU Rong, GUO Yanjun, LI Qingxiang, REN Xuejuan, WANG Yaqiang, XU Wenhui, LIU Yanju, DING Yihui. 2016.
- The Strong El Niño of 2015/16 and Its Dominant Impacts on Global and China's Climate
- J. Meteor. Res., 28(3): 283-297
- http://dx.doi.org/10.1007/s13351-016-6101-3
Article History
- Received March 9, 2016;
- in final form May 27, 2016


2 College of Atmospheric Science, Nanjing University of Information Science & Technology, Nanjing 210044;
3 National Climate Center, Beijing 100081;
4 National Meteorological Information Center, Beijing 100081;
5 School of Atmospheric Sciences, Nanjing University, Nanjing 210093
The year 2015 has been reported as by far the warmest on record(WMO,2016a). The global mean surface temperature was more than 1.0℃ higher than that before the industrial levels,which is more than half the target number specified in the Paris Agreement(UNFCC COP21,2015)to keep global warming below 2℃.
In China,special attention has been paid to climate change and the impacts of El Niño on weather and climate. Ding et al.(2006)indicated that surface air temperature in China has increased significantly in the past several decades; meanwhile,the East Asian monsoon has weakened and precipitation has demonstrated a "south-flood–north-drought" pattern(Wang,2001; Zhai et al., 2005; Ding et al., 2008; Li and Zhai, 2011; Zhang,2015). Many studies have suggested that El Niño can affect China in terms of temperature,precipitation, and even l and falling typhoons(Huang and Wu, 1989; Wang et al., 2000; Zhang et al., 2014).
The ENSO cycle during 2014–2016 is analyzed in the present paper,based on the latest global climate observational data and intensive observations in China. Important characteristics of the "super" El Niño in 2015/16 are revealed, and impacts of the global warming trend and possible impacts of the 2015/16 El Niño on global and China's surface temperature are discussed. The effects of the strong El Niño in 2015 on disastrous weather and climate events are also analyzed with a focus on summertime precipitation in China,particularly southern China, and the frequency of haze weather in northern China during November– December 2015.
2. Data and method 2.1 DataThe time series of surface temperature used in the present study were extracted from two datasets independently developed at the National Meteorological Information Center,China Meteorological Administration(CMA):(1)global surface temperature anomalies relative to the 1961–1990 base period. These data were derived from a global homogenized surface temperature dataset(CMA LSAT1.1),the corresponding global surface temperature dataset for 1961–1990, and ERSSTv4(version 4 of NOAA's Extended Reconstructed Sea Surface Temperature dataset);(2)annual av erage surface air temperature anomalies relative to the 1961–1990 base period,obtained based on the CNSAT1 dataset(Li et al., 2010; Xu et al., 2013),with the addition of the latest observations. The CNSAT1 dataset was constructed with a rigorous method(Li et al., 2010; Xu et al., 2013) and is a relatively reliable dataset.
The precipitation observations used in the present study were collected at 756 weather stations in China during the period 1950–2015. The dataset was provided by the National Meteorological Information Center,CMA. Observations at stations with complete records since 1961 were selected for the present study,while those with incomplete records were excluded. Ultimately,observations from 530 stations were selected for analysis.
Observations and diagnostics of the ENSO cycle were obtained from the NCEP of the US and the National Climate Center(NCC)of China: sea surface temperature(SST) and outgoing longwave radiation(OLR)from the NCEP; wind fields,water vapor transport,the equatorial Pacific SST index, and atmospheric oscillation indices(including the southern oscillation index(SOI) and convection oscillation index(COI))from the NCC. The SST index in the Niño Z region is the area-weighted average of the SST indices in the Niño 1+2(10°S–0°,90°–80°W),Niño 3(5°S–5°N,150°–90°W), and Niño 4(5°S–5°N,160°– 150°W)regions(Li and Zhai, 2000). The SOI refers to the st and ardized monthly mean sea surface pressure difference between Tahiti and Darwin. The COI is the st and ardized difference in OLR between the equatorial central–eastern Pacific(5°S–5°N,170°E–90°W) and equatorial western Pacific(5°S–5°N,110°–140°E)(Guo et al., 1998). Multi-year averages over 1981–2010 were used as the st and ard benchmark for the above calculations. The fine particulate matter(PM2.5)concentration data were derived from hourly observations collected at 1491 automatic air quality monitoring stations in China from November to December of 2015. These data are open to the public.
2.2 MethodAverages of data in June,July, and August were used to represent the summer condition, and averages of data in November and December were used to represent the condition in the transitional season. El Niño events were identified based on the monthly Niño Z index data provided by the NCC. An El Niño event was defined if the Niño Z index anomaly was equal to or greater than 0.5℃ in five consecutive months, and a strong El Niño event was defined if the Niño Z index anomaly was equal to or greater than 1℃ in five consecutive months(Li and Zhai, 2000). The El Niño events used for composite analysis were selected based on the criterion of the Niño Z index anomaly being equal to or greater than 1℃. Meanwhile,Niño 3.4 index,SOI, and COI were also considered.
To reveal the impact of El Niño on precipitation,we first calculated the 15-yr running means of precipitation,which were then subtracted from the precipitation observations to obtain the anomalies. Composite precipitation anomalies as percentages for El Niño years were employed to assess the El Niño impact on precipitation. In addition,percentage precipitation anomalies for the years included in the composite analysis were compared with the composite percentage precipitation anomaly; the number of years having the same precipitation anomaly sign as that of the composite precipitation anomaly was counted and the ratio(i.e.,occurrence frequency/probability)between the two was calculated.
To reveal the climate change impact on precipitation,the Optimal Climate Normal(OCN)method was utilized to assess the trend of precipitation change in the context of global warming(Huang et al., 1996; Livezey et al., 2007). Specifically,the percentage change in precipitation during two long-term periods(i.e.,precipitation averaged over 2000–2014 subtracted by that averaged over 1981–2010)was computed to represent the trend of precipitation change. The number of years in which the percentage precipitation anomaly had the same sign as that of the trend of precipitation change was counted for all the years in the range 2000–2014.
Finally,the composite percentage precipitation anomalies for the El Niño years were combined with the percentage change of precipitation obtained by using the OCN method,to obtain the distribution of percentage precipitation change under the joint effects of El Niño and global warming. Similarly,the number of years included in the composite analysis that had the same precipitation anomaly sign as that of the combined percentage change of precipitation was counted and the ratio(i.e.,occurrence frequency/probability)was calculated.
3. Characteristics of the strong El Niño in 2015 and its major impacts on global climate 3.1 Development of the strong El Niño in 2015In as early as January 2014,westerly wind anomalies in the lower troposphere close to the dateline region started to intensify gradually from the west to the east(Fig. 1a),which was accompanied by anomalous SST warming in the equatorial central and eastern Pacific(Fig. 1b). However,the SST warming was no longer maintained in the equatorial central Pacific after spring 2014. From July 2014,westerly wind anomalies larger than 2 m s−1 occurred over the central Pacific(Fig. 1a),whereas large-scale SST warming did not occur over the equatorial central Pacific until after the autumn of 2014(Fig. 1b). The area covered by westerly wind anomalies decreased in the winter,corresponding to near normal SSTs over the equatorial eastern Pacific. However,anomalous SST warming still existed in the equatorial central Pacific.
 |
| Fig. 1. Temporal evolution of the anomalies of (a) 850-hPa zonal wind (m s−1), (b) SST (℃), and (c) OLR (W m−2), over the equatorial Pacific from January 2014 to April 2016. |
Based on the SST changes over the equatorial central and eastern Pacific in 2014 discussed above,a previous study by Min et al.(2015)argued that the El Niño in 2014 did not develop into a strong one due to the influences of the cold SST anomalies(SSTAs)in the midlatitude southern Pacific(Figs. 2a and 2b). Considering the warm SSTAs over the equatorial central and eastern Pacific,the super El Niño event in 2015 can be regarded as a super-long El Niño event that started from 2014(Figs. 2c–h). Regardless of how we look at the El Niño event in 2015,the fact is that the rapidly developed El Niño in the spring of 2015 was closely related to the significant westerly wind anomalies in the lower troposphere over the equatorial eastern Pacific and the large-scale warm SSTAs in the central Pacific.
 |
| Fig. 2. Distributions of monthly global SSTAs in selected months of 2014–2016: (a) July 2014, (b) October 2014, (c) January 2015, (d) April 2015, (e) July 2015, (f) October 2015, (g) January 2016, and (h) April 2016. |
From February 2015,westerly winds over the equatorial central and eastern Pacific intensified anomalously. In April 2015,accompanied by the eastward propagation of Kelvin waves originated from the equatorial western Pacific,warm SSTAs reoccurred in the equatorial eastern Pacific(Figs. 1b and 2d). By the end of spring 2015,large-scale warm SSTAs covered the entire central–eastern Pacific,with SSTAs larger than 1.0℃ in most of the ocean area. Strong El Niño features appeared after spring 2015. Meanwhile,corresponding anomalies also occurred in the atmosphere. Low-level westerly wind anomalies became significant over the equatorial western Pacific and central–eastern Pacific(Fig. 1a),while high-level easterly wind anomalies were also distinct. Convective activity intensified anomalously over the tropical central and eastern Pacific,especially over 160°E–140°W,whereas convection in the tropical western Pacific was suppressed. Corresponding to the low-level wind fields and convection described above,the southern oscillation weakened after May 2015. In autumn 2015,SSTAs were greater than 2℃(Fig. 2f)in most of the equatorial central and eastern Pacific,indicating that the super El Niño had already formed,reaching its peak intensity during November–December. Since January 2016,this super El Niño has been weakening rapidly, and will possibly end in late spring(WMO,2016b). In April 2016,low-level westerly wind anomalies also weakened rapidly(Fig. 1a),while the positive SSTAs in the equatorial central eastern Pacific decreased to about 1.0℃(Figs. 1b and 2h).
Figure 3 compares several important parameters,including SSTA indices,SOI, and COI,among the three strong El Niño events in 1982/83,1997/98, and 2015/16. It shows clearly that the strong El Niño in 2015 developed from the large-scale SSTAs over the equatorial central eastern Pacific,which first appeared in May 2014. However,no such SST warming was found prior to the development of the strong El Niño events in 1982/83 and 1997/98. The strong El Niño in 2015 reached its peak intensity during November– December,about 19 months after its beginning. In contrast,the strong El Niño in 1982/83 and that in 1997/98 reached their peak intensity during January–February,which was only 8 months after their beginning.
 |
| Fig. 3. Monthly SSTA indices for the Niño 3.4 and Niño Z regions, as well as SOI and COI, during the three strong El Niño episodes of (a) 2015/16, (b) 1997/98, and (c) 1982/83. |
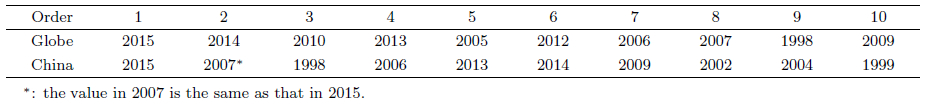
Table 1 lists the 10 hottest years respectively selected for the globe and Chinese mainl and,based on the global average surface temperature data and that of China during 1900–2015. Among the 10 years,2015 was the hottest for both Chinese mainl and and the globe. Note that 8 out of the 10 hottest years over the globe and 6 out of the 10 hottest years for Chinese mainl and occurred during 2006–2015. This result indicates that,both global surface temperature and surface air temperature in Chinese mainl and were anomalously high in the last 10 years(IPCC,2013).
 |
Additionally,Fig. 4 shows the time series of the surface temperature anomaly for the globe and Chinese mainl and based on the two datasets mentioned previously(Fig. 4a), and the time series after the removal of their respective 15-yr running means(Figs. 4b and 4c). Figure 4a shows a clear rising trend of temperature and a rapid warming that has occurred since the late 1970s. In addition,the time series for Chinese mainl and demonstrates that the surface warming experienced a slow-down period after 1998,which is reflective of the so-called "warming hiatus"(Li et al., 2015). However,the "hiatus" is not clear in the time series of global surface temperature due to the high temperature anomalies in 2004 and 2005(Karl et al., 2015; Lewandowsky et al., 2016). Meanwhile,temperatures in northern China(Xinjiang,Inner Mongolia,North China, and Northeast China) and eastern China have been lower than normal after 2005,particularly in Northeast China(Ding et al., 2014; Liang et al., 2014). However,rapid warming has reoccurred in these areas in the last three years,with surface temperature reaching a maximum in 2015.
 |
| Fig. 4. Annual mean global surface temperature anomalies (relative to 1961–1990), and annual mean surface air temperature anomalies (relative to 1961–1990) for Chinese mainland, during 1900–2015: (a) time series, (b) bar chart for the globe after removal of the 15-yr running mean, and (c) bar chart for Chinese mainland after removal of the 15-yr running mean. In (b, c), red bars denote El Niño years, blue bars denote La Niña years, and white bars denote normal years. |
In Figs. 4b and 4c,based on the El Niño and La Niña years identified by Gergis and Fowler(2009)for the period 1880–2002 and the Niño 3.4 index provided by the NCEP(http://www.cpc.ncep.noaa.gov/data/indices/),the El Niño years are indicated by red bars, and the La Niña years by blue bars. Statistical analysis indicates that the years of positive temperature anomalies for the globe and China account for 83.3% and 66.7% of the total El Niño years respectively,suggesting that El Niño may lead to surface warming both the globe and China. This result also implies that the El Niño impact on the climate of China is relatively small,since China is located upstream of the Pacific.
Figure 5 displays the possible impacts of the strong El Niño in 2015 on global weather and climate,based on data and information from various sources. Apparently,the super El Niño event in 2015 has not only affected the weather and climate in the Pacific Rim region,but may also have resulted in disastrous weather and climate events worldwide(WMO,2016c). In southern Africa,dry conditions exacerbated multiyear droughts and led to even worse food crisis. In the western tropical Pacific region,80% provinces of the Philippines experienced drought conditions in spring(van Huysen,2015), and Indonesia encountered severe and frequent wildfires. Australia experienced the fifth-warmest year on record,while its national rainfall was slightly below average(AGBM,2016). In southern Asian countries such as India and Pakistan,heat waves were extremely intense,leading to thous and s of deaths. In East Asia,more floods were observed in southern China but more severe droughts occurred in northwestern China. Fewer than normal l and falling typhoons were reported in China but with higher intensity. In South America,record extreme precipitation resulted in flooding that affected tens of thous and s of people across Peru and Argentina,while rainfall reduced noticeably around the Caribbean and Brazil. The northern United States was also reported to have experienced relatively mild and drier-thannormal weather and the national drought footprint peaked at 36.9% in early April 2015(NCEI,2016). Moreover,an extreme early summer heat wave stroke Europe during the end of June and beginning of July 2015. Several previous studies have indicated that winter temperature,summer precipitation, and even l and falling typhoons,are all possibly affected by El Niño events(Huang et al., 1989; Wu et al., 2001; Elsner and Liu, 2003).
 |
| Fig. 5. Possible impacts of the strong El Nino ˜ event in 2015 on weather and climate disasters worldwide. Color-shaded areas indicate the distribution of SSTA (℃), relative to 1981–2010. |
In total there were 18 rainstorms in the summer of 2015 in southern China. Generally speaking,precipitation was anomalously high in southern China,particularly in the lower Yangtze River valley,where precipitation was more than 20% higher than normal and 50% more than normal in some local areas. However,precipitation was 20%–50% less than normal in most areas of northern China,eastern Northwest China,so-uthwestern Northeast China, and in the western and southeastern Yellow–Huai River valley,amongst other regions. Hebei,Inner Mongolia,Liaoning,Jilin,Sh and ong, and Ningxia suffered severe drought in the summer of 2015(NCCCMA,2016).
Figures 6a–c display the distribution of percentage summer precipitation anomalies under the influence of the strong El Niño and climate change in China. Figure 6a clearly shows that summer precipitation decreased under the effects of the strong El Niño in most areas of China,except the Yangtze–Huai River valley,northern Northeast China, and parts of Xinjiang and Tibet. Precipitation was anomalously lower by more than 20% over the bend of the Yellow River area and southwestern China. Such effects were more distinct when the El Niño was in its strongest stage(Niño Z SSTA ≥ 1.0℃),as compared to its normal stage(Niño Z SSTA ≥ 0.5℃)(figure omitted). In the bend of the Yellow River area and central Inner Mongolia,in North China and Southwest China, and in the southeastern Tibetan Plateau,the probability of a precipitation decrease could be more than 67%. Precipitation increased in the Yangtze–Huai River valley,but the probability of a precipitation increase in this area did not reach 67%.
 |
| Fig. 6. Distribution of the summer precipitation anomaly percentage (color-shaded; %) and its occurrence probability (slashed/latticed; %; slashed areas indicate probability greater than 67% and latticed areas probability greater than 90%) over China. (a) Composite summer precipitation anomaly percentage and probability for strong El Niño years. (b) Climate trend of summer precipitation in percentage (computed as the mean of 2000–2014 minus the mean of 1981– 2010, then divided by the latter) and its occurrence probability projected for 2015. (c) The sum of (a) and (b), reflecting the impacts of both El Niño and the long-term climate trend. (d) The observed accumulated precipitation anomaly percentage in summer 2015 (relative to the 1981–2010 mean). |
In the context of global warming,the percentage change in the summer precipitation anomaly in China(Fig. 6b)in recent years suggests that precipitation decreased in northern and southwestern China but increased in Yellow–Huai River valley and the lower Yangtze River valley. Southeastern China and most of the Tibetan Plateau also experienced a precipitation increase. A high probability(> 67%)of a precipitation increase mainly occurred in eastern Inner Mongolia,northern North China, and western Qinghai.
When considering the effects of both El Niño and climate change(Fig. 6c),it is apparent that the largest decrease in summer precipitation was in central and eastern Inner Mongolia and the bend of the Yellow River region,where precipitation decreased by around 20% to 50%. However,precipitation increased by up to 20% in the Yangtze–Huai River valley and in Zhejiang and Fujian provinces. Areas where the probability of a precipitation increase or decrease reached 90% were found in central and eastern Inner Mongolia,the bend of the Yellow River region,the coastal areas surrounding Bohai Bay,most areas of Southwest China, and the southern Tibetan Plateau.
By comparing Figs. 6a–c with Fig. 6d(distribution of summer precipitation anomaly percentage in 2015),it can be seen that the strong El Niño in the summer of 2015 suppressed precipitation in central Inner Mongolia,the bend of the Yellow River region, and the Bohai Bay area. This indicates that El Niño,especially strong El Niño,has a considerable impact in terms of decreasing summer precipitation over northern China(Gao and Wang, 2007). However,it is not so certain that the increase in summer precipitation in southern China was related to the effects of the strong El Niño. Many studies have investigated the impacts of El Niño on summer precipitation in China,revealing that summer precipitation change in China is largely related to the weakening of the Indian summer monsoon(Wang et al., 2000; Gao et al., 2014; Zhang et al., 2016).
4.2 Impacts on the climate in eastern China during the transitional season(November –December)The strong El Niño in 2015 reached its peak intensity during November–December,corresponding to significant ocean and atmosphere anomalies. During this period,precipitation was anomalously high in most areas of China,except southwestern China and northern North China. Precipitation of 100–400 mm,which was 1–4 times that of the normal precipitation during the same period of normal years,occurred in southern Yangtze River and most areas of southern China. Precipitation in northeastern Guangxi was fourfold greater than normal. The largest levels of precipitation during the same period of November-December since 1961 occurred in Guangxi Region,Jiangxi,Hunan, and Zhejiang provinces(NCCCMA,2016).
Similar to Fig. 6,Fig. 7 shows the precipitation in China during November–December. Figure 7a presents the effects of the strong El Niño on precipitation in China for the transitional season. Apparently,El Niño resulted in a precipitation increase in this season over most areas of China,except Northeast China. Precipitation increased by more than 20% in Xinjiang and Tibet,in the central part of the bend of the Yellow River region, and in the region to the south of the Yangtze River. The probability of a precipitation increase in the region to the south of the Yangtze River reached 67%. Against the background of global warming(Fig. 7b),precipitation has significantly decreased during November–December in the last 10 years in the southeastern Tibetan Plateau and Southwest China,but increased in most other areas of China. Considering the joint effects of El Niño and climate change(Fig. 7c),it can be seen that the strong El Niño of 2015 promoted a precipitation increase in southeastern China(Fig. 7d),while the significant decrease in precipitation in southwestern China and the southeastern Tibetan Plateau may be attributable to the effect of climate change.
 |
| Fig. 7. As in Fig. 6, but for November–December precipitation. |
Note that during November–December of 2015,when precipitation increased significantly in southern China,six haze events occurred and affected large areas of China,particularly North China. Since mid November 2015,four haze events ranging from medium to severe occurred consecutively in North China and the Yellow–Huai River valley. Beijing issued several air pollution red alerts(NCCCMA,2016). Figure 8 shows that the PM2.5 concentration was mostly higher than 120 µg m−3 on average during November–December 2015 in eastern North China. Such a high frequency of haze occurrence is possibly associated with the strong El Niño in 2015. Detailed analysis is given in the next section.
 |
| Fig. 8. Observations of PM2.5 concentration (µg m−3) at 1491 air quality monitoring stations in China, averaged for November–December 2015. |
Further analysis of the mechanisms involved in the precipitation increase over southern China suggests that anomalously strong southerly water vapor transport appeared throughout the entire atmosphere,as shown in Fig. 9. By examining the wind anomalies in the lower atmosphere(850 hPa; Fig. 10),it is clear that the positive anomalies of water vapor transport,which were responsible for the precipitation increase in southern China,were closely related to the strong anticyclonic circulation anomaly prevailing over the northwestern Pacific near the Philippines. This result is consistent with that reported by Zhang et al.(1999,2015),who suggested that the El Niño impacts-especially El Niño in its peak stage-on winter precipitation in southern China were mainly affected by anomalous anticyclonic circulation in the northwestern Pacific. Wang et al.(2000)explained that the anticyclonic circulation anomaly in the western North Pacific was a linkage between the El Niño-induced warming in the eastern Pacific and the weakening of the East Asian winter monsoon. Cyclonic circulations developed in the lower troposphere along both sides of the equator in response to SST warming in the central Pacific. This cyclonic circulation overlapped the northeasterly trade winds in the northwestern Pacific area,leading to intensified wind speeds and ocean surface cooling in the northwestern Pacific. The subsidence forced remotely by the central Pacific warming and the in-situ ocean surface cooling suppress convective heating,which excites descending atmospheric Rossby waves that favor the formation of anticyclonic anomaly in the Philippine Sea.
 |
| Fig. 9. Anomalies of vertically integrated (surface to 300 hPa) water vapor transport (vectors; kg s−1 m−1) and moisture flux convergence (color-shaded; 10−5 kg s−1 m−2), averaged for November–December 2015, relative to the November–December mean of 1981–2010. |
 |
| Fig. 10. Schematic diagram illustrating how the strong El Niño affected the climate of eastern China in 2015, via an anomalous anticyclonic circulation in the Philippines induced by the Rossby wave effect during the El Niño peak period. The November–December 2015 averaged wind anomaly fields at (a) 200 and (b) 850 hPa are shown, with the SSTA av eraged in the same period superimposed in (b). AAC denotes anomalous anticyclonic circulation and ACC denotes anomalous cyclonic circulation. |
By taking into consideration the fact that the warm SSTA was larger than 2℃ during November– December 2015(Figs. 1b and 3a), and by looking at the response of the atmospheric circulation to the SST warming(Fig. 10),it is clear that the Rossby wave response to SST warming along the equatorial eastern Pacific directly was linked to the formation of the cyclonic circulation anomaly and westerly wind anomaly to the east of the dateline. In the area to the west of the dateline,an anticyclonic circulation anomaly prevailed over the Philippines in the lower troposphere. This anticyclonic circulation anomaly intensified the northward transport of water vapor over the northwestern Pacific and the South China Sea,which not only brought abundant water vapor to southeastern China,but also weakened the northerly wind component of the winter monsoon. In addition,the atmospheric circulation anomaly at 200 hPa(Fig. 10)showed a negative–positive–negative circulation anomaly pattern,extending from southern Sc and inavia to the Siberian Plain and further down to Japan. This is the typical negative phase of the Eurasia–Pacific teleconnection pattern(EUP; Wallace and Gutzler, 1981),which can also be clearly seen at 850 hPa(Fig. 10). The negative-phase EUP directly resulted in the weakening of the temperate jet stream over East Asia in the upper troposphere(Ren et al., 2010), and weakened the low-level Siberian high. As a result,the cold air mass from the north was not strong enough to reach northern China. The combined effects of the anticyclonic circulation over the Philippines and the distinct negative-phase EUP that occurred in the mid and high latitudes provided the background for the formation of haze weather in China. It is worth noting that the results shown in Fig. 10 are possibly related to the Walker circulation,which was anomalously weak due to the SST warming in the central and eastern Pacific, and the intensified descending motion in the equatorial western Pacific associated with the significant weakening of the Walker circulation. Zhang et al.(1996)had discussed this mechanism previously.
6. Summary and discussionThe year 2015 was the warmest on record. A super-strong El Niño also formed that year. Based on the latest observation data of global and China's climate,we analyzed the ENSO cycle during 2014–2016 and found several important features of the strong El Niño event. Specifically,this El Niño episode developed into a strong El Niño after the spring of 2015 and reached its peak intensity during November–December 2015. It is one of the three strongest El Niño events on record(the other two being 1982/83 and 1997/98) and is also regarded as the longest duration El Niño event in history.
The super-strong El Niño of 2015 not only exerted significant impacts on weather and climate in the Pacific Rim region,but also brought about disastrous weather and climate events(e.g.,high temperature and droughts)in Europe,Africa, and elsewhere. It is also possible that temperature and precipitation in China may have been affected by this strong El Niño event. In the present study,we analyzed the possible impacts of the strong El Niño of 2015 on summer precipitation in China. The El Niño impacts on the precipitation anomalies in southern China and the consecutive haze weather in northern China in the transitional season(November–December)were also explored. It was found that the strong El Niño of 2015 suppressed summer precipitation in central Inner Mongolia,the bend of the Yellow River region, and coastal areas surrounding Bohai Bay. However,it is less clear whether the positive anomalies of summer precipitation in southern China were associated with the El Niño event. Furthermore,it seems that the strong El Niño promoted more precipitation in southeastern China but suppressed precipitation in northeastern China during November–December 2015. Significant decreases in precipitation in southwestern China and the southeastern Tibetan Plateau might have been caused by the effects of climate change during November–December 2015.
The underlying mechanism of the impact of El Niño on the climate of China was analyzed. It was found that,during the time when the El Niño reached its peak during November–December of 2015,a lowerlevel anticyclonic circulation prevailed over the western North Pacific. In addition,a negative-phase EUP pattern was dominant in the mid and high latitudes. These two factors together resulted in climate anomalies in eastern China. Precipitation was anomalously high in southern China and haze weather occurred frequently in northern China,due to the weaker than normal northerly winds.
| Australian Government Bureau of Meteorology (AGB-M), 2016: Annual Climate Statement 2015. (2016-01-06)[2016-05-01].Available at http://www.bom.gov.au/climate/current/annual/aus/. |
| Ding Yihui, Ren Guoyu, Shi Guangyu, et al., 2006: Na-tional Assessment Report of Climate Change:Cli-mate change in China and its future trend. Adv. Climate Change Res., 2, 3-8. |
| Ding Yihui, Wang Zunya, and Sun Ying, 2008: Inter-decadal variation of the summer precipitation in East China and its association with the decreasing Asian summer monsoon. Part I:Observed evidence. Int. J. Climatol., 28, 1139-1161. |
| Ding Yihui, Liu Yanju, Liang Sujie, et al., 2014: Inter-decadal variability of the East Asian winter monsoon and its possible links to global climate change. J. Meteor. Res., 28, 693-713, doi:10.1007/s13351-014-4046-y. |
| Elsner, J. B., and K. B. Liu, 2003: Examining the ENSO-typhoon hypothesis. Climate Res., 25, 43-54. |
| Gao Hui and Wang Yongguang, 2007: On the weakening relationship between summer precipitation in China and ENSO. Acta Meteor. Sinica, 65, 131-137. (in Chinese) |
| Gao Hui, Jiang Wei, and Li Weijing, 2014: Changed relationships between the East Asian summer mon-soon circulations and the summer rainfall in east-ern China. J. Meteor. Res., 28, 1075-1084, doi:10.1007/s13351-014-4327-5. |
| Gergis, J. L., and A. M. Fowler, 2009: A history of ENSO events since A. D. 1525:Implications for future cli-mate change. Climatic Change, 92, 343-387. |
| Guo Yanjun, Zhai Panmao, and Ni Yunqi, 1998: A new index for ENSO monitoring. J. Appl. Meteor. Sci., 9, 169-177. (in Chinese) |
| Huang, J., H. M. van den Dool, and A. G. Barnston, 1996: Long-lead seasonal temperature prediction using optimal climate normals. J. Climate, 9, 809-817. |
| Huang Ronghui and Wu Yifang, 1989: The influence of ENSO on the summer climate change in China and its mechanism. Adv. Atmos. Sci., 6, 21-32. |
| IPCC, 2013: Climate Change 2013:The Physical Science Basis. Contribution of Working Group I to the Fifth Assessment Report of the Intergovernmental Panel on Climate Change. Cambridge, United Kingdom, New York, NY, USA, Cambridge University Press, 649-740. |
| Karl, T. R., A. Arguez, B. Y. Huang, et al., 2015: Pos-sible artifacts of data biases in the recent global surface warming hiatus. Science, 348, 1469-1472. |
| Lewandowsky, S., J. S. Risbey, and N. Oreskes, 2016: The "pause" in global warming:Turning a routine fluctuation into a problem for science. Bull. Am. Meteor. Soc., doi:10.1175/BAMS-D-14-00106.1, in press. |
| Li, J., R. C. Yu, W. H. Yuan, et al., 2011: Changes in duration-related characteristics of late-summer pre-cipitation over eastern China in the past 40 years. J. Climate, 24, 5683-5690. |
| Li Qingxiang, Dong Wenjie, Li Wei, et al., 2010: Assess-ment of the uncertainties in temperature change in China during the last century. Chin. Sci. Bull., 55, 1974-1982. |
| Li, Q. X., S. Yang, W. H. Xu, et al., 2015: China expe-riencing the recent warming hiatus. Geophys. Res. Lett., 42, 889-898, doi:10.1002/2014GL062773. |
| Li Xiaoyan and Zhai Panmao, 2000: On indices and indi-cators of ENSO episodes. Acta Meteor. Sinica, 58, 102-109. (in Chinese) |
| Liang Sujie, Ding Yihui, Zhao Nan, et al., 2014: Anal-ysis of the interdecadal changes of the wintertime surface air temperature over Chinese mainland and regional atmospheric circulation characteristics dur-ing 1960-2013. Chinese J. Atmos. Sci., 38, 974-992(in Chinese) |
| Livezey, R. E., K. Y. Vinnikov, M. M. Timofeyeva, et al., 2007: Estimation and extrapolation of climate normals and climatic trends. J. Appl. Meteor. Cli-matol., 46, 1759-1776. |
| Min, Q. Y., J. Z. Su, R. H. Zhang, et al., 2015: What hindered the El Niño pattern in 2014? Geophys. Res. Lett., 42, 6762-6770. |
| NCCCMA (National Climate Committee of the China Meteorological Administration), 2016: China Cli-mate Communiqué of 2015. 1-52(in Chinese).[2016-05-10] Available at http://www.cma.gov.cn/2011xwzx/2011xqxxw/2011xqxyw/201601/t20160112-3-01724.html. |
| NOAA National Centers for Environmental Information (NCEI), 2016: State of the Climate:Drought for An-nual 2015. (2016-01-13)[2016-05-08]. Available at https://www.ncdc.noaa.gov/sotc/drought/201513. |
| Ren Xuejuan, Yang Xiuqun, Zhou Tianjun, et al., 2010: Diagnostic comparison of the East Asian subtropical jet and polar-front jet:Large-scale characteristics and transient eddy activities. Acta Meteor. Sinica, 68, 1-11. (in Chinese) |
| Ren, X. J., X. Q. Yang, C. J. Chu, 2010: Seasonal vari-ations of the synoptic-scale transient eddy activity and polar front jet over East Asia. J. Climate, 23, 3222-3233. |
| United Nations Framework Convention on Climate Change (UNFCCC), 21st Conference of Paris (COP21), 2015: Adoption of the Paris Agreement (FCCC/CP/2015/L. 9/Rev.1). (2015-11-12)[2016-05-28]. Available at https://unfccc.int/resource/docs/2015/cop21/eng/l09r01.pdf. |
| van Huysen, T., 2015: El Nino drives drought in the Philippines. (2015-11-12)[2016-05-10]. Avail-able at http://iri.columbia.edu/news/el-nino-drives-drought-in-the-philippines/. |
| Wallace, J. M., and D. S. Gutzler, 1981: Teleconnections in the geopotential height field during the Northern Hemisphere winter. Mon. Wea. Rev., 109, 784-812. |
| Wang, B., R. G. Wu, and X. H. Fu, 2000: Pacific-East Asian teleconnection:How does ENSO affect East Asian climate. J. Climate, 13, 1517-1536. |
| Wang Huijun, 2001: The weakening of the Asian mon-soon circulation after the end of the 1970's. Adv. Atmos. Sci., 18, 376-386. |
| WMO, 2016a: WMO Statement on the Status of the Global Climate in 2015. (2016-03-09)[2016-05-01]. Available at http://public.wmo.int/en/resources/library/wmo-statement-status-of-global-climate-2015. |
| WMO, 2016b: El Niño/La Niña Update. (2016-02-18)[2016-05-15]. Available at http://www.wmo.int/pages/prog/wcp/wcasp/enso-updates.html. |
| WMO, 2016c: The year's weather-2015. (2016-01-08)[2016-05-11]. Available at http://public.wmo.int/en/media/news-from-members/years-weather-2015. |
| Wu, R. G., and B. Wang, 2001: Interannual variability of summer monsoon onset over the western North Pacific and the underlying processes. J. Climate, 13, 2483-2501. |
| Xu, W. H., Q. X. Li, X. L. Wang, et al., 2013: Homog-enization of Chinese daily surface air temperatures and analysis of trends in the extreme temperature indices. J. Geophys. Res. Atmos., 118, 9708-9720. |
| Zhai, P. M., X. B. Zhang, H. Wan, et al., 2005: Trends in total precipitation and frequency of daily pre-cipitation extremes over China. J. Climate, 18, 1096-1108. |
| Zhang, R., A. Sumi, and M. Kimoto, 1996: Impact of El Niño on the East Asian monsoon:A diagnostic study of the '86/87 and '91/92 events. J. Meteor. Soc. Japan, 74, 49-62. |
| Zhang Renhe, A. Sumi, and M. Kimoto, 1999: A di-agnostic study of the impact of El Niño on the precipitation in China. Adv. Atmos. Sci., 16, 229-241. |
| Zhang Renhe, 2015: Changes in East Asian summer mon-soon and summer rainfall over eastern China during recent decades. Sci. Bull., 60, 1222-1224. |
| Zhang, R. H., T. R. Li, M. Wen, et al., 2015: Role of intraseasonal oscillation in asymmetric impacts of El Niño and La Niña on the rainfall over southern China in boreal winter. Climate Dyn., 45, 559-567. |
| Zhang, W. J., F. F. Jin, and A. Turner, 2014: Increas-ing autumn drought over southern China associated with ENSO regime shift. Geophys. Res. Lett., 41, 4020-4026. |
| Zhang, W. J., H. Y. Li, M. F. Stuecker, et al., 2016: A new understanding of El Niño's impact over East Asia:Dominance of the ENSO combination mode. J. Climate, 29, 4347-4359. |