 2015, Vol. 29
The Chinese Meteorological Society
Article Information
- CHEN Chao, PANG Yanmei, PAN Xuebiao, ZHANG Lizhen. 2015.
- Impacts of Climate Change on Cotton Yield in China from 1961 to 2010 Based on Provincial Data
- J. Meteor. Res., 29(3): 515-524
- http://dx.doi.org/10.1007/s13351-014-4082-7
Article History
- Received July 11, 2014;
- in final form February 10, 2015


2 Heavy Rain and Drought-Flood Disasters in Plateau and Basin Key Laboratory of Sichuan Province, Chengdu 610072;
3 College of Resources and Environment, China Agricultural University, Beijing 100193
The globle surface temperature has increased,on average,by 0.74℃ during 1906-2005,while the increase during 1956-2005 was approximately 0.65℃. The rate of warming(increase of average temperature)during the recent 50 years(0.13±0.03℃ per decade)is almost twice as much as that during the last 100 years(0.07±0.02℃ per decade)(IPCC,2007). Further,the increase in global surface temperature is predicted to be up to 1.1-6.4℃ during the next 100 years(IPCC,2007).
During the past 100 years,China experienced significant climate change. The average air temperature increased by 0.5-0.8℃,which is slightly higher than the global average(Ding et al., 2006). The average air temperature in China during 1951-2001 increased by 1.1℃(Ding et al., 2007). The increase in air temperature has been particularly significant since the 1980s(Committee of National Assessment Report on Climate Change,2007). Because of a greater increase in nighttime temperature than that during the daytime,the diurnal temperature range(DTR)shows a downward trend in most areas of China(Liu et al., 2004; Committee of National Assessment Report on Climate Change,2007). Precipitation increased by 10%-15% every decade in western China,while it decreased in most of northern China. A climatic model projected that by 2050,the annual mean temperature in China could rise by 2.3-3.3℃, and the precipitation could increase by 5%-7%(Qin et al., 2005).
A number of studies revealed that the climate change has affected crop yields(Chmielewski and Potts, 1995; Nicholls,1997; Peng et al., 2004; Tao et al., 2006,2008a,2012,2013,2014; Schlenker and Roberts, 2009; Liu et al., 2010; Zhang and Huang, 2012) and will influence global crop production in the present and near future(Parry et al., 2004; Lobell,2007; Schmidhuber and Tubiello, 2007; Lobell et al., 2008). Currently,many studies focus on the effects of increasing temperature on yield; however,the conclusions are often conflicting. Peng et al.(2004)reported that an increase in minimum temperature would cause a decrease in rice yield. However,Sheehy et al.(2006)reanalyzed the experimental data of Peng et al.(2004) and observed that the expected decrease in rice yield might be a combined effect of increasing minimum temperature and decreasing solar radiation. Regional climate trends in China during 1980- 2008 reduced yields of wheat,maize, and soybean by 1.27%,1.73% and 0.41%,respectively; however,they increased rice yield by 0.56%(Tao et al., 2012). Increases in temperature and solar radiation could limit increases in crop yield. Rice production in China has been affected by climate change; however,at the same time,varietal changes continue to be the major factor driving yields and growing period trends(Tao et al., 2013). Changes in temperature,precipitation, and solar radiation during 1981-2009 increased wheat yield in northern China by 0.9%-12.9% but reduced it by 1.2%-10.2% in southern China(Tao et al., 2014). The changes in crop yield are due to interactive climatic factors(Lobell and Oritiz-Monasterio, 2007; Zhang et al., 2010). Climate and yield relations are scale dependent. Large scale statistical data and regional climate datasets are important for investigating general response patterns of crop production to climate change and variability(Lobell,2007; Lobell et al., 2008).
China is the largest cotton producer in the world. Cotton occupies a crucial position in the livelihood of many Chinese farmers and the national economy. Cotton is a strategic commodity in China because of its historic importance in obtaining foreign exchange,in clothing its large army, and as a source of state tax revenue(Fang and Babcock, 2003). Cotton is grown throughout China. The three major cottonproducing regions cover more than 90% of China's total cotton area(Hsu and Gale, 2001), and are located in the northwest region(Xinjiang and Gansu),the Yellow River valley(Shaanxi,Shanxi,Hebei,Henan, and Sh and ong), and the Yangtze River valley(Sichuan,Hubei,Hunan,Anhui,Jiangxi,Jiangsu, and Zhejiang).
Research on how climate change influences the cotton yield in China will be helpful in underst and ing the potential effects of future climate change and for developing scientific countermeasures. However,such information is limited. Therefore,the objective of this study is to systematically quantify climate and cotton yield relations in China by using the regional trends in climate over the last 50 years.
2. Materials and methods2.1 Study region and data sourcesYield data for cotton were obtained from the data sharing infrastructure of earth system science(DSIESS,2011) and from China's agricultural statistics(The Ministry of Agriculture of the People’s Republic of China,2009). The growing-season data for cotton were obtained from historical records(Zhang,1987). Studies have shown no significant difference in cotton growth period across the different regions of each province(Qian et al., 2007; Lu et al., 2008). In addition,the phenophase shift due to weather,climate trend,or farm management was generally < 1 day during the study period(Tao et al., 2006). Therefore,in each province,we assumed a similar cotton-growing season throughout the study period. The climate data were obtained from the National Meteorological Information Center,China Meteorological Administration,which included data from 228 weather stations distributed over the study region. Climatic variables included daily average temperature(Tavg),DTR, and precipitation(Prcp). We further computed the average of each climatic variable during the cotton-growing season for each province. The study regions are given in Fig. 1.
 |
| Fig. 1. Distribution of the major cotton-producing provinces in China(shaded area). The provincial ID is numbered as 0: Non-study region; 1: Xinjiang; 2: Gansu; 3: Shaanxi; 4: Shanxi; 5: Hebei; 6: Henan; 7: Sh and ong; 8: Sichuan; 9: Hubei; 10: Hunan; 11: Anhui; 12: Jiangxi; 13: Jiangsu; and 14: Zhejiang. |
The linear time trend represents the change in each variable(Wei,2007). A simple linear regression equation between Xi and ti can be expressed as follows:
where Xi is the variable(e.g.,a climatic variable),ti is the duration corresponding to Xi,n is the number of samples, and a and b are regression coefficients. The trend rate of the variables is represented by 10 times b.2.2.2 Climatic variables
To avoid the confounding influence of long-term variations,such as changes in crop management, and to focus on the relations between climatic factors and the yield,the cotton yield and climatic variables in a time series(Tavg,DTR, and Prcp)were converted to first-difference values by subtracting the prior year’s value from each year(Nicholls,1997; Lobell et al., 2008). A multiple linear regression model could be used to compute the climate-yield relation,with the first-difference values of the climatic variables(∆Tavg,∆DTR, and ∆Prcp)as explanatory variables and the first-difference value of yield(∆Yield)as the response variable.
where ∆Yield,∆Tavg,∆DTR, and ∆Prcp represent the first-difference values of yield and growing-season climatic variables; βo represents the model intercept; βTavg,βDTR, and βPrcp represent the regression coefficients for climatic variables; and ε represents the model error.
To evaluate the percentage yield change for each additional climatic variable,the percent regression coefficients were calculated by
where β and βpercent represent absolute and percent regression coefficients of certain climatic variables(∆Tavg,∆DTR, and ∆Prcp); and MeanYield represents the mean cotton yield during 1961-2010.3. Results and analysis3.1 Climate change during the cotton-growing season
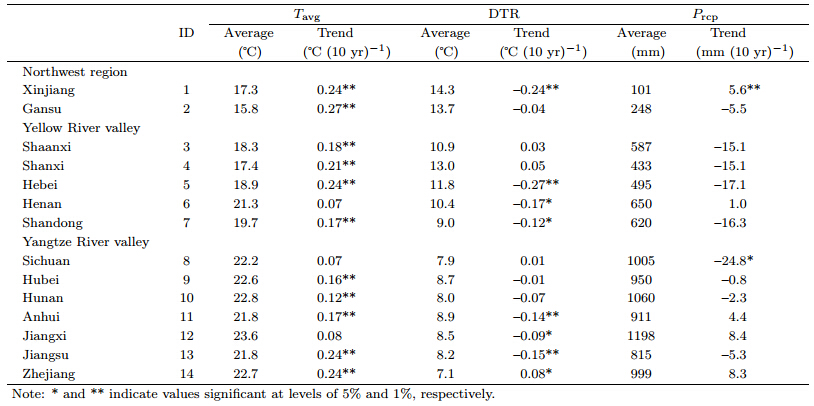
Tavg was higher than 15℃ in the three major cotton-producing regions over the last 50 years,with the highest value appearing in the Yangtze River valley and the lowest value in the northwest region(Table 1). A general warming trend was persistent across the entire study region with a rate of 0-0.27 ℃(10 yr)-1 during the cotton-growing season of 1961-2010. Spatial distribution characteristics of the average DTR demonstrated a b and shape,increasing gradually from the Yangtze River valley to the northwest region. General decreasing trends in DTR were persistent in most regions,with a rate of -0.27-0 ℃(10 yr)-1 in the last 50 years. The average Prcp also showed a b and shape,increasing gradually from the northwest region to the Yangtze River valley. Prcp showed an increasing trend in Xinjiang,Henan,Anhui,Jiangxi, and Zhejiang provinces and a decreasing trend in the other provinces,over the last 50 years.
 |
A positive percent regression coefficient indicates a coincident pattern between climatic variables and cotton yield,whereas a negative value reflects an opposing response of cotton yield to additional climatic variables(Fig. 2).
 |
| Fig. 2. Percent regression coefficients of(a)Tavg(% ℃-1),(b)DTR(% ℃-1), and (c)Prcp(%(100 mm)−1)on cotton yield over 1961–2010. |
Tavg showed a positive effect on cotton yields in both the northwest region and the Yellow River valley,with each additional degree celsius in Tavg increasing cotton yields by 0-13.7%. However,most provinces in the Yangtze River valley showed a negative effect,ranging between -18.7% and 0(Fig. 2a). Increasing DTR led to a higher cotton yield in the northwest region and in Shanxi,Hebei,Sichuan,Hubei, and Anhui provinces,with cotton yields increasing by 0- 10.8% per centigrade of DTR. An inverse effect was observed in the other provinces of the study region,where cotton yields decreased by 0-14.4% per centigrade of DTR(Fig. 2b). Cotton yield increase was associated with greater Prcp in the northwest region and Shanxi,Hebei, and Sichuan provinces,i.e.,0-8.9% increases per 100-mm increase in Prcp. However,the effects were negative in the other provinces,varying between 0 and 7.2% loss in cotton yield per 100-mm precipitation(Fig. 2c).
The regression coefficients calculated with actual trends in Tavg,DTR, and Prcp at the province level were used to evaluate the production change caused by historical accumulated change in climatic variables during 1961-2010. The warming caused a 0-18.5% increase in cotton production in most provinces of the northwest region and the Yellow River valley during 1961-2010. However,the warming in the Yangtze River valley decreased production by 0-9.0%(Fig. 3a). For DTR,the decreasing trend in most provinces resulted in a decrease in production of -9.8-0% in the northwest region and Shaanxi,Hebei,Hubei,Anhui, and Zhejiang provinces,while other provinces in the study region showed increased production with values of 0-12.6%(Fig. 3b). Changes in Prcp increased production by 0- 5.4% in Xinjiang,Shannxi,Sh and ong,Hubei,Hunan, and Jiangsu,while Prcp changes in the other provinces of the study region decreased production by -6.7%-0(Fig. 3c).
 |
| Fig. 3. Changes in cotton production(%)caused by(a)Tavg,(b)DTR, and (c)Prcp during 1961–2010.. |
Both a negative Tavg effect of -0.1% per centigrade and a cotton yield increase of 10.4% per centigrade increase in DTR were observed in the three major cotton-producing regions. On average,the effect of P rcp was 4.4% per additional 100 mm across the entire study region. The regression coefficients calculated by using observed trends in Tavg,DTR, and Prcp across the entire study region were used to evaluate production changes due to historical accumulated changes in climatic variables during 1961-2010. The historical accumulated change in Tavg decreased the cotton production,with values of approximately -0.1%. The production decreased by approximately 5.5% because of changes in DTR. Moreover,production was reduced by approximately 1.1% because of changes in Prcp. Therefore,DTR was the most important factor limiting cotton yield formation(Table 2).
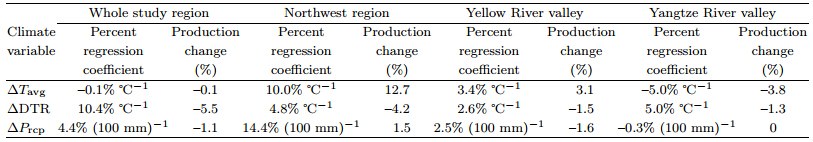 |
In the northwest region,the results showed a positive Tavg effect of 10.0% per centigrade, and a cotton yield increase of 4.8% per centigrade increase in DTR. On average,the Prcp effect was approximately 14.4% per additional 100 mm. For changes in production,Tavg caused an increase of 12.7%. However,the production decreased by 4.2% as DTR changed. Moreover,production improved by approximately 1.5% due to the changes in Prcp. Therefore,Tavg was the most important factor affecting the increase in cotton yield,while DTR was the main factor limiting cotton yield formation(Table 2).
In the Yellow River valley,the results showed a positive Tavg effect of 3.4% per centigrade, and a cotton yield increase of 2.6% per centigrade increase in DTR. On average,the Prcp effect was 2.5% per additional 100 mm. For changes in production,Tavg caused an increase of 3.1%. However,it decreased by 1.5% as DTR changed. Production was reduced by approximately 1.6% because of the changes in Prcp. Therefore,Tavg was the most important factor affecting the increase in cotton yield,while DTR and Prcp were the main factors limiting cotton yield formation in this region(Table 2).
In the Yangtze River valley,the results showed a negative Tavg effect of -5.0% per centigrade; however,a cotton yield increase of 5.0% per centigrade increase in DTR. On average,the Prcp effect was -0.3% peradditional 100 mm. For changes in production,Tavg caused a decrease of 3.8%. The production decreased by approximately 1.3% as DTR changed. However,the effect of P rcp on cotton production was not significant. Therefore,Tavg was the most important factor limiting cotton yield formation in this region(Table 2).
4. DiscussionThis study presents the general response patterns of cotton productivity to climate change,However,physiological mechanisms by which climatic variables may affect crop yields have been only partially revealed(Matsui and Hori, 1992; Tao et al., 2006,2008b). Global warming may have harmful or beneficial impacts on crop production in low or high latitude areas depending on whether the current temperature is generally more or less than the optimal temperature for crop production(IPCC,2001). This mechanism underlies the crop response patterns to temperature change in this paper(Fig. 2a). Growing-season average temperature was positively related to cotton yield in most provinces of the northwest region and the Yellow River valley,suggesting that the present growing-season average temperature might be still in or lower than the optimal temperature range for cotton production. Cotton yield possibly increased due to a warming trend,which is consistent with previous studies(Yang et al., 2008; Liu et al., 2010). Cotton yield in most provinces of the Yangtze River valley showed a negative relation with Tavg,suggesting that the present average temperature is at or above the optimal temperature for cotton production. This indicates that cotton yield could be reduced due to a warming trend,which is consistent with other studies(Peng et al., 2004; Sheehy et al., 2006; Tao et al., 2006).
Evaluating the effects of climate change on cotton yield should include a consideration of the effects of all climatic factors(Lobell and Oritiz-Monasterio, 2007; Zhang et al., 2010). The impact of DTR was bilateral(Fig. 2b). An increase in DTR during the growing season,which has warm days and cool nights,is beneficial for crop growth because the former increases photosynthetic rate and the latter reduces respiration rate(Leopold and Kriedemann, 1975). However,an increase in DTR may also reduce the yield because the associated increase in maximum temperature may result in decreasing net photosynthetic rates or increasing water stress(Dhakhwa and Campbell, 1998,Tao et al., 2006). In this study,the decrease in DTR during the growing season reduced cotton production in the northwest region and Hebei,Hubei,Anhui, and Zhejiang provinces,probably because of an increase in nighttime maintenance respiration rates(Ryan,1991), and consequently,biomass consumption. The decreases in DTR during the growing season increased cotton production in the other provinces,probably because of a reduction of cold damage(Fig. 3b). Precipitation during the cotton-growing season was positively related to cotton yield in the northwest region and Shanxi,Hebei, and Sichuan provinces but was negatively related to the other provinces studied(Fig. 2c). These results are consistent with the reality observed over the past few decades. Cotton yield losses in southern China can be caused by insects,disease,or insufficient sunlight due to excessive precipitation during the growing season(Tao and Yokozawa, 2005). In northern China,because the climate is arid and semi-arid,water stress is the most important limiting factor for rainfed crop yields(Tao et al., 2003).
Comparing cotton with four other major crops studied in climate research,as presented by Tao et al.(2012),changes in temperature and precipitation are observed to adversely affect cotton yields during 1961- 2010. This is consistent with the decrease in climatedriven yield trends for various crops during 1980-2008: yield decreased by 1.27%,1.73%, and 0.41% for wheat,maize, and soybean,respectively. However,for wheat,maize, and soybean this is also contradicted by the 0.56% increase in the climate-driven yield of rice(Tao et al., 2012). Climate warming decreases cotton yields by accelerating the plant development rate and reducing yield accumulation,probably because of increasing temperature extremes and heat stress.
The effects of climate factors are different depending on the developmental stage of the plant and should be studied in the future. For example,in the Yangtze River valley,temperatures in spring and autumn are suitable for cotton production, and thus,the negative effect of increasing average annual temperature is mainly due to heat stress in the summer.
Uncertainties in the results as mentioned above are possible due to several reasons. First,the data in this study are limited to the provincial scale over the past 50 years. However,researches using data collected on different spatial or temporal scales may give different conclusions(Tao et al., 2006; Liu et al., 2012). Therefore,research on the response of crop yields to changes in climatic factors should be extended to different spatial and temporal scales. Second,complete consideration of the effects of technology and management,as well as weather variability,disease,insects, and so on,occurring over five decades of observations is extremely difficult. To some extent,such effects could impact the results of trend analyses. For instance,yields may have increased due to the increasing use of modern technology and new cultivars. If so,the decreases(or increases)in crop productivity may actually be larger(or smaller)than those estimated in our study. Studies on cotton yield responses to technical advancements and economy development should be performed in the future. In addition,the effects of extreme climatic conditions on crop yields were not considered in this study. With the increasing frequency of extreme climate events and frequent agriculture-related meteorological disasters,research on the effects of such events on crop production should be emphasized in the future.
5. ConclusionsThis study revealed the evidence of climatic effects on cotton production in China during 1961-2010 due to the global warming. The warming resulted in an increase in cotton yield in most provinces in the northwest region and the Yellow River valley but a decrease in cotton yield in the Yangtze River valley. The historical accumulated increases in Tavg reduced cotton production,on average,by approximately 0.1% across all regions.
During the cotton-growing seasons of 1961-2010,DTR in most provinces showed decreasing trends. The decrease in DTR during the cotton-growing seasons decreased cotton yield in the northwest region and Shaanxi,Hebei,Hubei,Anhui, and Zhejiang provinces; however,a beneficial DTR effect was observed in the other provinces. The historical accumulated changes in DTR resulted in a decreased production,on average,by approximately 5.5% across the entire studied region.
Precipitation during the cotton-growing seasons of 1961-2010 increased in some provinces but decreased in others. The change in precipitation increased cotton yield in Xinjiang,Shaanxi,Sh and ong,Hubei,Hunan, and Jiangsu provinces but decreased the yield in the other provinces. The average production decreased 1.1% because of historical accumulated changes in precipitation across the entire studied region.
We concluded that DTR was the most important factor limiting cotton yield formation in China. Tavg was the most important factor affecting cotton yield increase in the northwest region. DTR and Prec were the main factors limiting cotton yield formation in the Yellow River valley. Tavg was the most important factor limiting cotton yield formation in the Yangtze River valley. The changes in temperature and precipitation decreased cotton yield in China as whole; however,they increased the yield in the northwest cotton-growing region.
| Chmielewski, F. M., and J. M. Potts, 1995: The relationship between crop yields from an experiment in southern England and long-term climate variations. Agr. Forest Meteor., 73, 43-66. |
| Committee of National Assessment Report on Climate Change, 2007: China's National Assessment Report on Climate Change. China Science Press, Beijing, 80-105. (in Chinese) |
| Data Sharing Infrastructure of Earth System Science (DSIESS), 2011: Institute of Geographic Sciences and Natural Resources Research, Chinese Academy of Sciences 2009. [Online]. Available:http://www.geodata.cn/[25 November 2011]. (in Chinese) |
| Dhakhwa, G. B., and C. L. Campbell, 1998: Potential effects of differential day-night warming in global climate change on crop production. Climatic Change, 40, 647-667. |
| Ding Yihui, Ren Guoyu, Shi Guangyu, et al., 2006: National assessment report of climate change (I):Climate change in China and its future trend. Adv. Climate Change Res., 2, 3-8. (in Chinese) |
| Ding Yihui, Ren Guoyu, Zhao Zongci, et al., 2007: Detection, causes and projection of climate change over China:An overview of recent progress. Adv. Atmos. Sci., 24, 954-971. |
| Fang Cheng and B. A. Babcock, 2003: China's cotton policy and the impact of China's WTO accession and Bt cotton adoption on the Chinese and U. S. cotton sectors. Working Paper 03-WP-322, Center for Agricultural and Rural Development, Iowa State University, Ames, Iowa 50011-1070. |
| Hsu, H. H., and F. Gale, 2001: "Regional Shifts in China's Cotton Production and Use" in Cotton and Wool Situation and Outlook. Economic Research Service, United States Department of Agriculture, Washington D.C., 19-25. |
| IPCC, 2001: Climate Change 2001:Impacts, Adaptation and Vulnerability. Contribution ofWorking Group II to the Third Assessment Report of the Intergovernmental Panel on Climate Change. McCarthy, J. J., O. F. Canziani, N. A. Leary, et al., Eds., Cambridge University Press, Cambridge, United Kingdom and New York, NY, USA, 1032 pp. |
| IPCC, 2007: Climate Change 2007:The Physical Science Basis. Contribution of Working Group I to the Fourth Assessment Report of the Intergovernmental Panel on Climate Change. Solomon, S., D. Qin, M. Manning, et al., Eds., Cambridge University Press, Cambridge, United Kingdom and New York, NY, USA, 996 pp. |
| Leopold, A. C., and P. E. Kriedemann, 1975: Plant Growth and Development. McGraw-Hill, New York, 545 pp. |
| Liu Binhui, Ming Xu, M. Henderson, et al., 2004: Taking China's temperature:Daily range, warming trends, and regional variations, 1955-2000. J. Climate, 17, 4453-4462. |
| Liu Leilei, Wang Enli, Zhu Yan, et al., 2012: Contrasting effects of warming and autonomous breeding on single-rice productivity in China. Agr. Ecosyst. Environ., 149, 20-29. |
| Liu Yuan, Wang Enli, Yang Xiaoguang, et al., 2010: Contributions of climatic and crop varietal changes to crop production in the North China Plain, since 1980s. Global Change Biol., 16, 2287-2299. |
| Lobell, D. B., 2007: Changes in diurnal temperature range and national cereal yields. Agr. Forest Meteor., 145, 229-238. |
| Lobell, D. B., and J. I. Ortiz-Monasterio, 2007: Impacts of day versus night temperatures on spring wheat yields:A comparison of empirical and CERES model predictions in three locations. Agron. J., 99, 469477. |
| Lobell, D. B., M. B. Burke, C. Tebaldi, et al., 2008: Prioritizing climate change adaptation needs for food security in 2030. Science, 319, 607-610. |
| Lu Yanhui, Qiu Fei, Feng Hongqiang, et al., 2008: Species composition and seasonal abundance of pestiferous plant bugs (Hemiptera:Miridae) on Bt cotton in China. Crop Prot., 27, 465-472. |
| Matsui, T., and T. Horie, 1992: Effects of elevated CO2 and high temperature on growth and yield of rice. 2:Sensitive period and pollen germination rate in high temperature sterility of rice spikelets at flowering. Japan J. Crop Sci., 61, 148-149. |
| Nicholls, N., 1997: Increased Australian wheat yield due to recent climate trends. Nature, 387, 484-485. |
| Parry, M. L., C. Rosenzweig, A. Iglesias, et al., 2004: Effects of climate change on global food production under SRES emissions and socio-economic scenarios. Global Environ. Change, 14, 53-67. |
| Peng Shaobing, Huang Jianliang, J. E. Sheehy, et al., 2004: Rice yields decline with higher night temperature from global warming. Proc. Natl. Acad. Sci. USA, 101, 9971-9975. |
| Qian Shuan, Chen Hui, and Wang Liangyu, 2007: Operational prediction method of nationwide cotton development stages. J. Appl. Meteor. Sci., 18, 539-547. (in Chinese) |
| Qin Dahe, Ding Yihui, Su Jilan, et al., 2005: Assessment of climate and environment changes in China (I):Climate and environment changes in China and their projection. Adv. Climate Change Res., 1, 4-9. (in Chinese) |
| Ryan, M. G., 1991: Effects of climate change on plant respiration. Ecol. Appl., 1, 157-167. |
| Schlenker, W., and M. J. Roberts, 2009: Nonlinear temperature effects indicate severe damages to U. S. crop yields under climate change. Proc. Natl. Acad. Sci. USA, 106, 15594-15598. |
| Schmidhuber, J., and F. N. Tubiello, 2007: Global food security under climate change. Proc. Natl. Acad. Sci. USA, 104, 19703-19708. |
| Sheehy, J. E., P. L. Mitchell, and A. B. Ferrer, 2006: Decline in rice grain yields with temperature:Models and correlations can give different estimates. Field Crops Res., 98, 151-156. |
| Tao Fulu, M. Yokozawa, Y. Hayashi, et al., 2003: Changes in agricultural water demands and soil moisture in China over the last half-century and their effects on agricultural production. Agr. Forest Meteor., 118, 251-261. |
| Tao Fulu and M. Yokozawa, 2005: Risk analyses of rice yield to seasonal climate variability in China. J. Agr. Meteor., 60, 885-887. |
| Tao Fulu, M. Yokozawa, Xu Yinlong, et al., 2006: Climate changes and trends in phenology and yields of field crops in China, 1981-2000. Agr. Forest Meteor., 138, 82-92. |
| Tao Fulu, M. Yokozawa, Liu Jiyuan, et al., 2008a: Climate-crop yield relationships at provincial scales in China and the impacts of recent climate trends. Climate Res., 38, 83-94. |
|
Tao Fulu, Y. Hayashi, Zhang Zhao, et al., 2008b: Global warming, rice production, and water use in China:
[34] Developing a probabilistic assessment. Agr. Forest Meteor., 148, 94-110. |
| Tao Fulu, Zhang Zhao, Zhang Shuai, et al., 2012: Response of crop yields to climate trends since 1980 in China. Climate Res., 54, 233-247. |
| Tao Fulu, Zhang Zhao, Shi Wenjiao, et al., 2013: Single rice growth period was prolonged by cultivars shifts, but yield was damaged by climate change during 1981-2009 in China, and late rice was just opposite. Global Change Biol., 19, 3200-3209. |
| Tao Fulu, Zhang Zhao, Xiao Dengpan, et al., 2014: Responses of wheat growth and yield to climate change in different climate zones of China, 1981-2009. Agr. Forest Meteor., 91-104, 189-190. |
| The Ministry of Agriculture of the People's Republic of China, 2009: New China's Agricultural Statistics for 60 Years. China Agriculture Press, Beijing, 303305. (in Chinese) |
| Wei Fengying, 2007: Statistics Technology of Diagnose and Forecast of Modern Climate. China Meteorological Press, Beijing, 50-70. (in Chinese) |
| Yang, W., Peng Shaobing, R. C. Laza, et al., 2008: Yield gap analysis between dry and wet season rice crop grown under high-yielding management conditions. Agron. J., 100, 1390-1395. |
| Zhang Fuchun, 1987: Chinese Agricultural Phenology Atlas. Science Press, Beijing, 134-178. (in Chinese) |
| Zhang Tianyi, Zhu Jiang, and R. Wassmann, 2010: Responses of rice yields to recent climate change in China:An empirical assessment based on long-term observations at different spatial scales (1981-2005). Agr. Forest Meteor., 150, 1128-1137. |
| Zhang Tianyi and Huang Yao, 2012: Impacts of climate change and interannual variability on cereal crops in China from 1980 to 2008. J. Sci. Food Agr., 92, 1643-1652. |