 2015, Vol. 28
The Chinese Meteorological Society
Article Information
- ZHANG Yunwei, ZHANG Qun, LENG Chunpeng, ZHANG Deqin, CHENG Tiantao, TAO Jun, ZHANG Renjian, HE Qianshan. 2015.
- Evolution of Aerosol Vertical Distribution During Particulate Pollution Events in Shanghai
- J. Meteor. Res., 28(3): 385-399
- http://dx.doi.org/10.1007/s13351-014-4089-0
Article History
- Received August 1,2014;
- in final form January 23,2015


2 Fudan-Tyndall Centre, Fudan University, Shanghai 200433;
3 South China Institute of Environmental Sciences, Ministry of Environmental Protection, Guangzhou 510655;
4 Key Laboratory of Regional Climate-Environment Research for Temperate East Asia, Institute of Atmospheric Physics, Chinese Academy of Sciences, Beijing 100029;
5 Shanghai Meteorological Bureau, Shanghai 200030
Atmospheric aerosol that comprises liquid and solid particles dispersed in the atmosphere can directly affect the earth's radiation budget by scattering and absorbing solar and terrestrial radiation and indirectly by disturbing cloud,acting as cloud condensation nuclei(CCN) and ice nuclei(IN)(Charlson et al., 1991;Haywood et al., 1997;Ramanathan et al., 2001). Aerosol comes from natural or anthropogenic sources, and anthropogenic aerosol is one of major contributors to human-induced climate change.The radiative forcing of anthropogenic aerosol has been predicted to cause strong regional cooling over East and South Asia(Chen Weinai et al., 2007),the Mediterranean region(Bergamo et al., 2008), and Germany and India(Ramanathan et al., 2007).
China has been undergoing rapid economic growth and urbanization since 1978.Over the last decades,large quantities of various pollutants have been emitted into the atmosphere(Tie et al., 2006). Atmospheric particle accumulation in the planetary boundary layer(PBL)is primarily responsible for air quality impairment in many cities.This particulate pollution occurs year-round and leads to serious health problems(Duzgoren-Aydin,2008).At present,air pollution is one of the main environmental concerns.For instance,the haze weather in the spring of 2013 is known to have been associated with atmospheric pollution caused by fine particles,especially secondary particles(Wang et al., 2013), and it severely impacted a large domain of central and eastern China as a result of long-term stable atmospheric circulation.
In recent years,Asian pollution(e.g.,haze)has attracted worldwide attention;thus,various instruments have emerged for the observation of aerosol and particulate pollutants.In particular,the development of lidar techniques has provided a useful tool to investigate aerosols in high-altitude atmosphere(Russell et al., 1976;Sassen and Cho, 1992;Welton et al., 2002; Kim et al., 2010).The PBL is the lowest atmospheric layer(i.e.,1-2 km), and is influenced most directly by the exchange of momentum,heat, and water vapor at the earth's surface;accordingly,it plays an important role in the atmospheric environment and human life(Beniston et al., 1990).The temporal evolution of the PBL and aerosol vertical distribution has been studied by using lidar and is known to be extremely important for forecasting weather and as a key parameter in determining the extent of turbulence,dispersion, and transport for pollutants(Kunkel et al., 1977;Boers et al., 1984;Melfi et al., 1985;Parikh and Parikh, 2002). The mixing layer height(MLH),which is consistent with the PBL height in neutral and unstable atmospheres,determines the air volume in which the most effective dispersion process takes place(Seibert et al., 2000).Lidar is known to be a suitable remote sensing instrument for studying the PBL and its evolution. Menut et al.(1999)measured the urban boundary layer height with lidar in Paris.Chen et al.(2001)observed seasonal changes in the MLH in Japan by using micro pulse lidar(MPL).He et al.(2006)studied MLH variations in Beijing on the basis of MPL measurements.Yang et al.(2013)analyzed temporal variations of the MLH by using long-term measurements of daytime atmospheric MLH over Hong Kong. He et al.(2008)summarized aerosol vertical distributions based on 1-yr MPL measurements in Hong Kong.Quan et al.(2013)compared the evolution of the PBL under different weather conditions and investigated its impact on aerosol concentrations in Tianjin,China.However,few studies have focused on aerosol vertical distribution during haze events in Shanghai
This study presents aerosol vertical extinction coefficient(VEC)profiles obtained from MPL,aerosol mass concentration, and meteorological factors measured during 2011 in Shanghai.The purpose of this paper is to explore the evolution of aerosol vertical distribution and the PBL during particulate pollution events, and to provide some insight regarding aerosol vertical dispersion and horizontal transport,interaction between the PBL and pollutant loading within the surface atmosphere, and formation mechanisms of haze weather.
2. Experiment and data2.1 Observation siteOne MPL(532 nm)measured continuously on the rooftop of a building approximately 20 m above ground in the campus of Fudan University in Shanghai(31°180N,121°290E).The site is located in a residential and commercial mixed urban area with no large local emissions(e.g.,stationary source)(Huang et al., 2012).Shanghai enjoys a subtropical oceanic monsoon climate and has four distinct seasons;sunny weather in spring and autumn, and rainy weather in summer. The annual mean precipitation is 1119 mm,approximately 60% of which is concentrated between May and September.Southeasterly wind blowing from the East China Sea prevails in summer, and northwesterly wind from the Mongolian high pressure prevails in winter. Because of its large urban area and dense population,Shanghai is subject to a pronounced heat isl and effect. In this study,the local time(LT)used thereafter is 8 h ahead of Coordinated Universal Time(UTC).
2.2 Instruments and measurementMPL is an eye-safe,compact, and autonomous system that can provide aerosol distribution information at high vertical and temporal resolutions(Spinhirne,1993).It was developed by the Goddard Space Flight Center(GSFC)of the National Aeronautics and Space Administration(NASA)in 1992, and was designed primarily as a ground-based optical remote sensing system to measure the altitude of cloud overhead.The physical principles of MPL are the same as those of radar.A set of incorporated MPL of model MPL-4B-IDS(Sigma Space Co.,USA)was installed at Fudan University in October 2010.This MPL system consists of a computer for dedicated data acquisition and lidar control,a diode-pumped Nd:YAG laser, and an eight-in telescope acting as a coaxial transceiver.
The Cimel sunphotometer,a st and ard instrument used in the NASA Aerosol Robotic Network(AERONET)(Holben et al., 1998),was used to measure direct solar and sky radiance at discrete wavelengths and employ the observations to retrieve aerosol optical depth(AOD),the Ångströom exponent(α), and other aerosol optical properties(Dubovik et al., 2000). A continuous ambient particulate monitor(FH62C14,Thermo)was used to measure the mass concentrations of PM2.5(i.e.,particle aerodynamic diameter less than 2.5 µm).An automatic weather station(HydroMetTM,Vaisala) and a visibility monitor(Vaisala)were employed to collect meteorological data and monitor atmospheric visibility.The MPL and other instruments mentioned above were installed in a working container well air-conditioned at 20℃,the optimal temperature for instrument performance.Additionally,PM10(i.e.,particle aerodynamic diameter less than 10 µm)was obtained from data published by the Shanghai Environmental Monitoring Center.
2.3 MethodologyThe lidar has advantages including continuous measurement and is suitable for studying the evolution of aerosol VEC structure(Russell et al., 1974). The top of the PBL can be defined in different ways depending on the instrument used.For example,the MPL determines PBL depth to be the altitude at which a substantial change in backscatter occurs;however,the vertical gradient in backscatter is small because the PBL typically has a much higher aerosol concentration than that of the free troposphere above,which has a stronger backscatter signal(Boers and Eloranta, 1986;Noh et al., 2007).To date,the MPL has been used to detect the PBL worldwide(Cohn and Angevine, 2000),utilizing the approach of multiple wavelet dilations that was described in detail by Brooks(2003).Quan et al.(2013)compared the PBL heights measured by wind profile radar,microwave radiometer, and MPL, and found that,although there are some shortcomings to determining the PBL by using aerosol scattering coefficients,the MPL is an effective tool for detection of the PBL.This is particularly true in the daytime,the higher temporal resolution and clearer visualization allow for snapshots of PBL evolution to be obtained under different weather conditions.
The original signals collected from the MPL require pre-processing for several corrections,including detector delay,background noise,parasitic pulse,geometric factor, and range,among others(Campbell et al., 1998,2002). Then,the aerosol optical properties can be retrieved by using the following basic lidar equations.
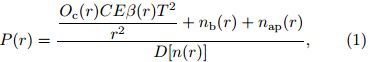
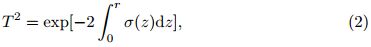
where T is atmospheric transmittance,Oc(r)is the overlap correction as a function of range caused by field-of-view conflicts in the transceiver system,C is a dimensional system calibration constant,E is the transmitted laser pulse energy(µJ),β(r)is the backscatter cross-section due to all types of atmospheric scattering(km−1),r is the range between the detected substance and receiver telescope,nb(r)is the background contribution from ambient light(phe µs−1),nap(r)is the contribution from the afterpulse(phe µs−1), and D[n(r)] is the detector photoncoincidence “dead time” factor as a function of the raw count rate(Campbell et al., 2002). Before the campaign,the MPL instrument was repaired and calibrated by the manufacturer. Moreover,during the campaign,the horizontal calibration(overlap correction),vertical calibration(Rayleigh fitting,C value),aerosol backscattering and extinction profiles, and dead time correction were conducted automatically by the newly advanced calibration-analysis software provided by the manufacturer.
3. Results and discussion3.1 Particulate pollution eventsAerosols can degrade atmospheric visibility through light extinction and hygroscopic growth(Waggoner et al., 1981),which are affected by particle chemistry,size,morphology,hygroscopicity,mixture,chemical reaction, and aging(Hu et al., 2010; Zhang et al., 2012). Generally,particulate pollution occurs when pollutants accumulate within the PBL under stagnant meteorological conditions and causes low visibility(Luo et al., 2001). According to the new weather st and ards published by the China Meteorological Administration in 2010,haze and fog can be identified and approximately differentiated according to relative humidity(RH) and atmospheric visibility. Briefly,at visibility less than 10 km,haze occurs at RH ≤ 80%,fog occurs at RH ≥ 90%, and 80% < RH < 90% is referred to as fog haze mixing. In this study,the particulate pollution event is defined as pollution lasting for at least 4 h. Three typical events affected by particles from different sources are analyzed in the next section.
Dust can significantly impact radiative forcing,the atmospheric environment, and climate change on regional or global scales(Tegen and Lacis, 1996). The aerosol index(AI) and AOD conspicuously increase in regions through which dust aerosols pass(Qiu and Sun, 1994). During 28–30 April 2011,the strongest dust storm of the year occurred in northern China due to the Mongolian cyclone(Duan et al., 2013). Figure 1 presents an image from the NASA Moderate Resolution Imaging Spectroradiometer(MODIS),obtained on 29 April 2011. Dust originated from the Gobi desert in Mongolia and dispersed eastward in late April,with the dust plume covering hundreds of kilometers. On 1 May,the dust plume swept Shanghai and a pollution event occurred,which is referred to as the dustinfluenced haze event. The ultra-violet aerosol index(UVAI)from the ozone monitoring instrument(OMI)was as high as 2.6 over Shanghai on this day,indicating that more dust particles with higher absorbing capacity at 354–388 nm were present in the atmosphere(Liu et al., 2010).
 |
| Fig. 1. Dust storm image over northern China from MODIS in late April 2011. |
Biomass-burning smoke contains abundant partially oxidized organic matter and black carbon, and has significant climatic implications(Christopher et al., 2000). In China,the open combustion of agricultural waste in agricultural areas(i.e.,agri-fire)is common during the summer and autumn harvesting periods. This region is considered as an important source of anthropogenic biomass burning globally. In early June of 2011,the smoke of agri-fires engulfed Shanghai and the smoke plume extended to hundreds of kilometers over eastern China(Fig. 2). During 7–8 June,a particulate pollution event broke out in Shanghai,referred to as the bioburning-influence haze, and high-level pollutants threatened human health.
 |
| Fig. 2. Images of biomass-burning smoke plume over East Asia from MODIS on 8 June 2011. |
Particulate matter(PM)plays a vital role in the formation of haze in cities,especially PM2.5 such as sulfate,nitrate, and soot,which exists primarily as fine particles sourced from local emissions(Fu et al., 2008; Huang et al., 2012). Over the last decade,atmospheric visibility has declined gradually in Chinese megacities,while the number of annual low-visibility days(e.g.,haze)has increased year by year(Che et al., 2008; Deng et al., 2008). During 5–6 January 2011,a particulate pollution event induced by local pollutants broke out in Shanghai,this is referred to as the localpolluted haze event.
3.2 Characteristics of dust-influenced hazeFigure 3 presents hourly averages of visibility,PM2.5,RH, and wind speed from 30 April to 3 May. The dust-influenced haze event started at 2200 LT(local time)30 April and ended at 1700 LT 3 May,with a duration of 54 h,during which RH and visibility were generally less than 80% and 10 km,respectively. Throughout the event,wind speed decreased gradually and PM2.5 was inversely correlated with visibility. Specifically,PM2.5 was highest at 0100 LT 1 May(650 µg m−3) and 0300 LT 3 May(960 µg m−3),corresponding to the lowest visibility(< 2.5 km). On 2 May,the daily-averaged AOD(500 nm)reached 1.54,far higher than the value for neighboring clear days(without haze and rain) and the minimum monthly AOD(0.4)measured in Shanghai(Pan et al., 2010; He et al., 2012); moreover,α(440–675 nm)was approximately 0.37,implying more coarse particles in the atmosphere.
 |
| Fig. 3. Hourly averages of (a) visibility and RH, and (b) wind speed and PM2.5 from 30 April to 3 May 2011. |
Because particles are suspended in the atmosphere,atmospheric motion on a synoptic scale contributes to aerosol vertical variations. On 1 May,a westerly trough and cold front were the prevailing synoptic systems at high altitudes(Fig. 4). The Asian continent was dominated by the northwesterly wind behind the trough with a cold advection,with intensive isobars associated with strong winds. At sea level,a low pressure occurred in the Japan Sea,with a large cold high entrenched over the west of Baikal Lake,Mongolia, and northern China. Shanghai was located in the southeastern edge of the surface high pressure and influenced by the moderate northeasterly or northerly winds(Fig. 4).
 |
| Fig. 4. (a) Surface pressure field at 1100 LT and (b) 850-hPa height field at 0800 LT 1 May 2011. |
Lidar is usually used to monitor the real-time evolution of atmospheric pollution and to track the vertical dispersion and long-distance transport of particles(Wakimoto and Mcelroy, 1986). The aerosol VEC profile derived from lidar at a high temporal resolution reflects the vertical distribution and temporal variation of atmospheric aerosol. Figure 5 shows the temporal variation of aerosol VEC profiles measured by the MPL from 30 April to 3 May 2011. The line at 1100 LT 30 April represents the profile “before the event;” the lines at 2300 LT 30 April,2000 LT 1 May, and 1800 LT 2 May represent “during the event”; and the line at 1700 LT 3 May represents “after the event”. Overall,the aerosol VECs decreased with increasing altitude and ,at any given height in the measured range,the VEC value during the event was generally larger than those before and after the event. Clearly,before the event,the aerosol VECs increased with altitude and peaked at 1 km(1.11 × 10⁻¹ km−1),but subsequently decreased and reached a minimum at 2 km(1.08 × 10⁻² km−1). In the initial stage of the event,the aerosol VECs increased with altitude and peaked at 0.6 km(5.04 × 10⁻¹ km−1), and subsequently decreased to form a valley at approximately 3.5 km(9.39 × 10⁻³ km−1). In the mid-stage,one peak occurred at approximately 0.5 km(2.91 km−1) and another at 3.5 km(1.17 × 10⁻¹ km−1), and the aerosol VECs were lower between 3.8 and 4.2 km. In the later stage,aerosol VECs peaked near the surface(1.79 km−1) and at 2.3 km(1.02 km−1),but a valley occurred at approximately 4 km(2.31 × 10⁻² km−1). After the event,the aerosol VEC profile exhibited a similar bi-peak form to that during the event,but with a magnitude similar to that before the event. The relatively higher aerosol VECs distributed within the PBL implied that most particulate pollutants accumulated in the surface atmosphere. Hence,it is reasonable that the aerosols at high atmospheric layers(e.g.,700–850 hPa)were transported primarily from the remote dust sources in northern China(Fig. 1).
 |
| Fig. 5. Variation of aerosol extinction coefficient profiles measured by MPL from 30 April to 3 May 2011. |
Aerosol has been observed previously by using polarization or Raman lidar in East Asia. In contrast to previous studies in urban dusty weather,the maximum aerosol VECs in the present study were much higher than the mean value(1.6 × 10⁻¹ km−1)measured at Taipei(Chen Weinai et al., 2007),but slightly lower than that(4 × 10⁻¹ km−1)measured for the dust pollution episode of 4–10 April 2009 in Shanghai(Huang et al., 2012). Moreover,the variation of aerosol vertical distribution during this dustinfluenced haze event was comparable to the results measured at Shijiazhuang in China by Sun et al.(2013).
Figure 6 shows a time series of the PBL derived from MPL from 30 April to 3 May. The PBL was generally lower during the haze event than it was before and after the event. Accompanied by the haze occurrence in the morning of 1 May,the PBL dropped below 500 m,corresponding to the highest PM2.5(650 µg m−3)(Fig. 3). The PBL decreased continuously during the morning of 2 May and reached a lower level,but PM2.5 increased. In the morning of 3 May,PM2.5 reached a maximum(920 µg m−3)while the PBL reached a minimum(< 0.5 km). Thus,under these stagnant meteorological conditions,particulate pollutants accumulated and led to serious pollution.
 |
| Fig. 6. Time series of the PBL derived from MPL from 30 April to 3 May 2011 (a–c). |
The HYSPLIT 4 model is typically used to calculate air mass backward trajectory(http://www.arl.noaa.gov) and to analyze the transport pathways of pollutants in the atmosphere and backtrack their sources(Draxler and Hess, 1998). Figure 7 shows the calculated 48-h air mass backward trajectories ending in Shanghai at heights of 500,2000, and 3500 m(corresponding to vertical VEC peaks) and starting at 0800 LT 1 May 2011. Based on these calculated air pathways,the dust originated primarily from the deserts or s and l and s scattered in the west-central part of Inner Mongolia and southern Mongolia and were then transported over long distances in the lower free troposphere. The air mass at 500 m originated from northeastern China and passed southeastward across the Sh and ong Peninsula,both of which are known as industrial areas, and finally arrived in the surface atmosphere over Shanghai,possibly inducing the event in conjunction with local polluted air.
 |
| Fig. 7. 48-h air mass backward trajectories at 500, 2000, and 3500-m heights starting at 0800 LT 1 May 2011, calculated by HYSPLIT. |
Figure 8 presents mean atmospheric visibility,RH,wind speed,PM2.5,SO2, and NO2 during 7– 8 June 2011. The bioburning-influenced haze event started at 2300 LT 7 June and ended at 0700 LT the next day,with a duration of 8 h,during which the visibility remained less than 5 km and RH was typically below 90%. On 8 June,the daily-averaged AOD(500 nm)reached 1.33,far higher than that for clear days; moreover,α(440–675 nm)was approximately 0.93,implying that more fine particles existed in the atmosphere.
 |
| Fig. 8. Time series of (a) mean visibility and RH, (b) wind speed and PM2.5, and (c) SO2 and NO2 from 2100 LT 7 to 0800 LT 8 June 2011. |
The synoptic situation on 7 June was characterized by a deep high pressure over Mongolia and the west of Baikal Lake and a large low pressure covering Northeast China and North China(Fig. 9). Shanghai was located in a transition zone spanning the southeastern edge of the surface low pressure and the northwestern edge of the subtropical anticyclone. This region was primarily controlled by the westerly flow and influenced by weak winds,as indicated by the sparse isobars.
 |
| Fig. 9. (a) Surface pressure field at 2300 LT and (b) 850-hPa height field at 2000 LT 7 June 2011. |
Figure 10 shows the temporal variation of aerosol VEC profiles measured by MPL during 7–8 June 2011. The line at 2100 LT June 7 represents the profile “before the event;” the lines at 0000,0300, and 0600 LT 8 June represent “during the event;” and the line at 0800 LT 8 June represents “after the event.” Before the event,the aerosol VEC reached a maximum at 0.2–1.4- km height,with its second highest levels at 1.5–2.0-km height. During the event,several peaks in VECs were detected at 1.3,2.0, and 3.0 km,in addition to the surface atmosphere. This pattern was attributed to the smoke-containing particulate pollutants that were emitted from biomass burning and transported from agricultural areas(Fig. 2). After the event,the aerosol VECs decreased to reach their levels before the event. Overall,the magnitude of aerosol VECs during the event was typically higher than that before or after the event. In contrast,the aerosol VECs measured by a ground-based elastic backscatter lidar in Sao Paulo,Brazil,were moderately higher than those presented here(Mariano et al., 2010). In addition,the peak(1.2 km−1)in aerosol VEC profiles during a smoke episode has been found to occur at 500–800-m height in Singapore and Malaysia(Salinas et al., 2013).
 |
| Fig. 10. Variation in aerosol extinction coefficient profiles measured by MPL during 7–8 June 2011. |
Figure 11 shows a time series of the MPL-derived PBL during the whole event. When the event began,visibility decreased dramatically to less than 2–3 km(Fig. 8), and the PBL height also decreased from 800 to 500 m. Throughout the haze event,visibility and the PBL remained stable,NO2 and PM2.5 increased slowly,but SO2 decreased slowly. Because of the stagnant meteorological conditions,including the low PBL,biomass-burning smoke was able to cluster easily in the lower troposphere,especially at night.
 |
| Fig. 11. Time series of the PBL derived from MPL during 7–8 June 2011. |
Figure 12 shows 24-h air mass backward trajectories at 1000-,2000-, and 3000-m heights starting at 0000 LT on 8 June. It is clear that,when agricultural biomass burning occurred,smoke originated primarily from eastern Anhui Province and northern Zhejiang Province and then moved northeastward with decreasing heights,finally being deposited down to the surface atmosphere. During the summer harvesting period,straw was typically burnt in the afternoon or evening,consistent with the occurrence time of local pollution in Shanghai. Thus,this haze event was most likely affected by the agricultural biomass-burning smoke from surrounding regions.
 |
| Fig. 12. 24-h air mass backward trajectories at the 1000-, 2000-, and 3000-m heights starting at 0000 LT 8 June 2011, calculated by HYSPLIT. |
During the past decade,particulate matter(PM),sulfur dioxide(SO2), and nitrogen oxides(NOx)have become major air pollutants in Shanghai. Ions(e.g.,NH4+,NO3−, and SO42-) and organic matter are two dominant contributors to PM2.5(Kang et al., 2004; Zhang et al., 2013). The large contribution of sulfate and nitrate is related to the high oxidation rates of SO2 and NOx in haze pollutions(Sun et al., 2006). Figure 13 shows a time series of visibility,RH,wind speed,PM2.5,SO2, and NO2 concentrations from 0000 LT 5 to 0800 LT 6 January 2011. The local-polluted haze event started at 0600 LT 5 January and ended at 0100 LT 6 January,with a duration of 19 h. During this event,visibility was inversely correlated with PM2.5. Specifically,visibility was lowest(1.0 km)at 1200 and 1800 LT 5 January,corresponding to highest PM2.5(180 µg m−3). PM2.5 decreased dramatically to approximately 30 µg m−3 after 1800 LT 5 January; then,visibility continued to rise until the end of the event. On 6 January,the daily-averaged AOD(500 nm) and α(440–675 nm)were approximately 0.5 and 0.98,respectively, and PM2.5/PM10 was(on average)as high as 83%,implying that fine particles were dominant in the atmosphere.
 |
| Fig. 13. Time series of (a) mean visibility and RH, (b) wind speed and PM2.5, and (c) SO2 and NO2 from 0000 LT 5 to 0800 LT 6 January 2011. |
The synoptic situation on 5 January was characterized by a strong cold high pressure arising from the west of Baikal Lake,covering the majority of continental East Asia(Fig. 14). Shanghai was located on the southeastern edge of the surface high,under stable meteorological conditions(i.e.,windless conditions or weak winds),allowing pollutants to accumulate near the surface. As cold air moved southward,the wind speed increased on 6 January,resulting in the dispersion of pollutants.
 |
| Fig. 14. Surface pressure field at 0800 LT 5 January 2011. |
Figure 15 shows the temporal variation of aerosol VEC profiles measured by MPL during 5–6 January 2011. The line at 0500 LT 5 January represents the profile “before the event”; the lines at 1200 and 2300 LT 5 January represent the profile “during the event”; and the line at 0500 LT 6 January represents the profile “after the event”. The distribution of aerosol VECs remained similar below 1 km during the whole event. Before the event,an obvious maximum of aerosol VECs was found at 2.0-km height. As the event erupted,aerosol VECs decreased with increasing altitude and reached a maximum in the surface atmosphere. After the event,aerosol VECs dropped to their lowest values,compared to those during the event. In contrast to previous studies investigating local-polluted weather in Shanghai,the structure of the aerosol VEC profiles was comparable to that measured by Chen et al.(2012)during dry haze periods,although the aerosol VECs were found to be higher in the present study.
 |
| Fig. 15. Variation in aerosol extinction coefficient profiles measured by MPL during 5–6 January. |
Figure 16 shows a time series of the MPL-derived PBL during the whole event. The PBL was typically decreasing slowly and lower than 1.0 km. It is clear that a positive correlation existed between SO2 concentration and PM2.5, and that the SO2 and NO2 concentrations on hazy days exceeded those on non-hazy days.
 |
| Fig. 16. Time series of the PBL derived from MPL during 5–6 January. |
Figure 17 shows the 24-h air mass backward trajectories at 300-,500-, and 2000-m heights starting at 0000 LT January 5. The air mass remained in the Shanghai region for 18 h,indicating relatively slow airmass movement in the horizontal direction. Moreover,the height of the air mass remained almost unchanged for 24 h,implying only mild convection motion in the vertical direction. These analyses demonstrate that pollutants emitted from local sources were most likely responsible for the formation of this event.
 |
| Fig. 17. 24-h air mass back trajectories at the 100-, 300-, and 2000-m heights starting at 0000 LT 5 January 2011, calculated by HYSPLIT. |
A field experiment was conducted in Shanghai by using MPL lidar to explore the evolution of aerosol layering during air pollution events. Aerosol VEC profiles and PBL analyses were used to explain aerosol vertical distribution and pollution formation. Three typical types of pollution events were identified: dustinfluenced haze,bioburning-influenced haze, and localpolluted haze events.
Aerosol VEC at any given measured height during a haze event was much larger than that before and after the event. Aerosol VECs exhibited a multi-peaked form during the dust- and bioburning-influenced haze events owing to the influence of aerosols from various sources. Conversely,during local-polluted haze events,aerosol VECs decreased with increasing altitude and reached maximum values in the surface atmosphere. PM2.5 was inversely correlated with the PBL during haze events, and the interaction between them made an important contribution to the formation and evolution of air pollution. Thus,it is possible that positive feedback induces the acceleration of air pollution.
| Beniston, M., J. P. Wolf, M. Beniston-Rebetez, et al., 1990: Use of lidar measurements and numerical models in air pollution research. J. Geophys. Res., 95, 9879-9894. |
| Bergamo, A., A. M. Tafuro, S. Kinne, et al., 2008: Monthly-averaged anthropogenic aerosol direct radiative forcing over the Mediterranean based on AERONET aerosol properties. Atmos. Chem. Phys., 8, 6995-7014. |
| Boers, R., E. W. Eloranta, and R. L. Coulter, 1984: Lidar observations of mixed layer dynamics: Tests of parameterized entrainment models of mixed layer growth rate. J. Climate Appl. Meteor., 23, 247-266. |
| Boers, R., and E. W. Eloranta, 1986: Lidar measurements of the atmospheric entrainment zone and the potential temperature jump across the top of the mixed layer. Bound.-Layer Meteor., 34, 357-375. |
| Brooks, I. M., 2003: Finding boundary layer top: Application of a wavelet covariance transform to lidar backscatter profiles. J. Atmos. Oceanic Technol., 20, 1092-1105. |
| Campbell, J. R., D. L. Hlavka, J. D. Spinhirne, et al., 1998: Operational cloud boundary detection and analysis from micropulse lidar data. Tucson, Eighth ARM Science Team Meeting, 119-122. |
| Campbell, J. R., D. L. Hlavka, E. J. Welton, et al., 2002: Full-time, eye-safe cloud and aerosol lidar observation at atmospheric radiation measurement program sites: Instruments and data processing. J. Atmos. Oceanic Technol., 19, 431-442. |
| Charlson, R. J., J. Langner, H. Rodhe, et al., 1991: Perturbation of the Northern Hemisphere radiative balance by backscattering from anthropogenic sulfate aerosols. Tellus A, 43, 152-163. |
| Che, H., G. Shi, A. Uchiyama, et al., 2008: Intercomparison between aerosol optical properties by a PREDE skyradiometer and CIMEL sunphotometer over Beijing, China. Atmos. Chem. Phys., 8, 3199-3214. |
| Chen Weibo, H. Kuze, A. Uchiyama, et al., 2001: Oneyear observation of urban mixed layer characteristics at Tsukuba, Japan using a micro pulse lidar. Atmos. Environ., 35, 4273-4280. |
| Chen Weinai, F. J. Tsai, C. C. K. Chou, et al., 2007: Optical properties of Asian dusts in the free atmosphere measured by Raman lidar at Taipei, Taiwan. Atmos. Environ., 41, 7698-7714. |
| Chen Yonghang, Liu Qiong, Geng Fuhai, et al., 2012: Vertical distribution of optical and micro-physical properties of ambient aerosols during dry haze periods in Shanghai. Atmos. Environ., 50, 50-59. |
| Christopher, S. A., J. Chou, Zhang Jianglong, et al., 2000: Shortwave direct radiative forcing of biomass burning aerosols estimated using VIRS and CERES data. Geophys. Res. Lett., 27, 2197-2200. |
| Cohn, S. A., and W. M. Angevine, 2000: Boundary layer height and entrainment zone thickness measured by lidars and wind-profiling radars. J. Appl. Meteor., 39, 1233-1247. |
| Deng Xuejiao, Tie Xuexi, Wu Dui, et al., 2008: Longterm trend of visibility and its characterizations in the Pearl River Delta (PRD) region, China. Atmos. Environ., 42, 1424-1435. |
| Draxler, R. R., and G. D. Hess, 1998: An overview of the HYSPLIT4 modelling system for trajectories, dispersion, and deposition. Aust. Meteor. Mag., 47, 295-308. |
| Duan Haixia, Zhao Jianhua, and Li Yaohui, 2013: The frequencies, severities, and driving factors of the sand-dust weather processes occurred in northern China in the spring of 2011. Journal of Desert Research, 33, 179-186. (in Chinese) |
| Dubovik, O., A. Smirnov, B. N. Holben, et al., 2000: Accuracy assessments of aerosol optical properties retrieved from Aerosol Robotic Network (AERONET) sun and sky radiance measurements. J. Geophys. Res., 105, 9791-9806. |
| Duzgoren-Aydin, N. S., 2008: Health effects of atmospheric particulates: A medical geology perspective. J. Environ. Sci. Heal. C Environ. Carcinog. Ecotoxicol. Rev., 26, 1-39. |
| Fu Qingyan, Zhuang Guoshun, Wang Jing, et al., 2008: Mechanism of formation of the heaviest pollution episode ever recorded in the Yangtze River Delta, China. Atmos. Environ., 42, 2023-2036. |
| Haywood, J. M., V. Ramaswamy, and L. J. Donner, 1997: A limited-area-model case study of the effects of sub-grid scale variations in relative humidity and cloud upon the direct radiative forcing of sulfate aerosol. Geophys. Res. Lett., 24, 143-146. |
| He, Q. S., J. T. Mao, J. Y. Chen, et al., 2006: Observational and modeling studies of urban atmospheric boundary-layer height and its evolution mechanisms. Atmos. Environ., 40, 1064-1077. |
| He Qianshan, Li Chengcai, Mao Jietai, et al., 2008: Analysis of aerosol vertical distribution and variability in Hong Kong. J. Geophys. Res., 113, D14211, doi: 10.1029/2008JD009778. |
| He Qianshan, Li Chengcai, Geng Fuhai, et al., 2012: Aerosol optical properties retrieved from sun photometer measurements over Shanghai, China. J. Geophys. Res., 117, D16204, doi: 10.1029/2011JD 017220. |
| Holben, B. N., T. F. Eck, I. Slutsker, et al., 1998: AERONET-A federated instrument network and data archive for aerosol characterization. Remote Sens. Environ., 66, 1-16. |
| Hu Dawei, Qiao Liping, Chen Jianmin, et al., 2010: Hygroscopicity of inorganic aerosols: Size and relative humidity effects on the growth factor. Aerosol Air Qual. Res., 10, 255-264. |
| Huang, K., G. Zhuang, Y. Lin, et al., 2012: Typical types and formation mechanisms of haze in an eastern Asian megacity, Shanghai. Atmos. Chem. Phys., 12, 105-124. |
| Kang, C. M., H. S. Lee, B. W. Kang, et al., 2004: Chemical characteristics of acidic gas pollutants and PM2.5species during hazy episodes in Seoul, South Korea. Atmos. Environ., 38, 4749-4760. |
| Kim, S. W., S. C. Yoon, J. Kim, et al., 2010: Asian dust event observed in Seoul, Korea, during 29-31 May 2008: Analysis of transport and vertical distribution of dust particles from lidar and surface measurements. Sci. Total Environ., 408, 1707-1718. |
| Kunkel, K. E., E. W. Eloranta, and S. T. Shipley, 1977: Lidar observations of the convective boundary layer. J. Appl. Meteor., 16, 1306-1311. |
| Liu Yi, Yang Dongxu, ChenWenzhong, et al., 2010: Measurements of Asian dust optical properties over the Yellow Sea of China by shipboard and ground-based photometers, along with satellite remote sensing: A case study of the passage of a frontal system during April 2006. J. Geophys. Res., 115, D00K04, doi: 10.1029/2009JD012684. |
| Luo Yunfeng, Lu Daren, Zhou Xiuji, et al., 2001: Characteristics of the spatial distribution and yearly variation of aerosol optical depth over China in last 30 years. J. Geophys. Res., 106, 14501-14513. |
| Mariano, G. L., F. J. S. Lopes, M. P. P. M. Jorge, et al., 2010: Assessment of biomass burnings activity with the synergy of sunphotometric and LIDAR measurements in S-ao Paulo, Brazil. Atmos. Res., 98, 486-499. |
| Melfi, S. H., J. D. Spinhirne, S. H. Chou, et al., 1985: Lidar observations of vertically organized convection in the planetary boundary layer over the ocean. J. Climate Appl. Meteor., 24, 806-821. |
| Menut, L., C. Flamant, J. Pelon, et al., 1999: Urban boundary-layer height determination from lidar measurements over the Paris area. Appl. Opt., 38, 945-954. |
| Noh, Y. M., Y. J. Kim, B. C. Choi, et al., 2007: Aerosol lidar ratio characteristics measured by a multiwavelength Raman lidar system at Anmyeon Island, Korea. Atmos. Res., 86, 76-87. |
| Pan Liang, Che Huizheng, Geng Fuhai, et al., 2010: Aerosol optical properties based on ground measurements over the Chinese Yangtze Delta region. Atmos. Environ., 44, 2587-2596. |
| Parikh, N. C., and J. A. Parikh, 2002: Systematic tracking of boundary layer aerosols with laser radar. Opt. Laser Technol., 34, 177-185. |
| Qiu Jinhuan and Sun Jinhui, 1994: Optically remote sensing of the dust storm and result analysis. Chinese J. Atmos. Sci., 18, 1-10. (in Chinese) |
| Quan Jiannong, Gao Yang, Zhang Qiang, et al., 2013: Evolution of planetary boundary layer under different weather conditions, and its impact on aerosol concentrations. Particuology, 11, 34-40. |
| Ramanathan, V., P. J. Crutzen, J. Lelieveld, et al., 2001: Indian Ocean Experiment: An integrated analysis of the climate forcing and effects of the great IndoAsian haze. J. Geophys. Res., 106, 28371-28398. |
| Ramanathan, V., F. Li, M. V. Ramana, et al., 2007: Atmospheric brown clouds: Hemispherical and regional variations in long-range transport, absorption, and radiative forcing. J. Geophys. Res., 112, D22S21, doi: 10.1029/2006JD008124. |
| Russell, P. B., E. E. Uthe, F. L. Ludwig, et al., 1974: A comparison of atmospheric structure as observed with monostatic acoustic sounder and lidar techniques. J. Geophys. Res., 79, 5555-5566. |
| Russell, P. B., W. Viezee, R. D. Hake Jr, et al., 1976: Lidar observations of the stratospheric aerosol: California, October 1972 to March 1974. Quart. J. Roy. Meteor. Soc., 102, 675-695. |
| Salinas, S. V., B. N. Chew, J. Miettinen, et al., 2013: Physical and optical characteristics of the October 2010 haze event over Singapore: A photometric and lidar analysis. Atmos. Res., 122, 555-570. |
| Sassen, K., and B. S. Cho, 1992: Subvisual-thin cirrus lidar dataset for satellite verification and climatological research. J. Appl. Meteor., 31, 1275-1285. |
| Seibert, P., F. Beyrich, S. E. Gryning, et al., 2000: Review and intercomparison of operational methods for the determination of the mixing height. Atmos. Environ., 34, 1001-1027. |
| Spinhirne, J. D., 1993: Micro pulse lidar. IEEE Trans. Geosci. Remote Sens., 31, 48-55. |
| Sun Yele, Zhuang Gguoshun, Tang Aohan, et al., 2006: Chemical characteristics of PM2. 5 and PM10 in hazefog episodes in Beijing. Environ. Sci. Technol., 40, 3148-3155. |
| Sun Xia, Yin Yan, Sun Yuwen, et al., 2013: Seasonal and vertical variations in aerosol distribution over Shijiazhuang, China. Atmos. Environ., 81, 245-252. |
| Tegen, I., and A. A. Lacis, 1996: Modeling of particle size distribution and its influence on the radiative properties of mineral dust aerosol. J. Geophys. Res., 101, 19237-19244. |
| Tie Xuexi, G. P. Brasseur, Zhao Chunsheng, et al., 2006: Chemical characterization of air pollution in eastern China and the eastern United States. Atmos. Environ., 40, 2607-2625. |
| Waggoner, A. P., R. E.Weiss, N. C. Ahlquist, et al., 1981: Optical characteristics of atmospheric aerosols. Atmos. Environ., 15, 1891-1909. |
| Wakimoto, R. M., and J. L. Mcelroy, 1986: Lidar observation of elevated pollution layers over Los Angeles. J. Climate Appl. Meteor., 25, 1583-1599. |
| Wang Yan, Xie Yisong, Li Zhengqiang, et al., 2013: Anthropogenic aerosol optical depth during days of high haze levels in the Beijing winter. J. Remote Sens., 17, 993-1007. |
| Welton, E. J., K. J. Voss, P. K. Quinn, et al., 2002: Measurements of aerosol vertical profiles and optical properties during INDOEX 1999 using micropulse lidars. J. Geophys. Res., 107, INX2 18-1-INX2 1820, 8019, doi: 10.1029/2000JD000038. |
| Yang Dongwei, Li Chengcai, A. H. K. Lao, et al., 2013: Long-term measurement of daytime atmospheric mixing layer height over Hong Kong. J. Geophys. Res., 118, 2422-2433. |
| Zhang Renyi, A. Khalizov, Wang Lin, et al., 2012: Nucleation and growth of nanoparticles in the atmosphere. Chem. Rev., 112, 1957-2011. |
| Zhang, R., J. Jing, J. Tao, et al., 2013: Chemical characterization and source apportionment of PM2.5 in Beijing: Seasonal perspective. Atmos. Chem. Phys., 13, 7053-7074. |