 2015,vol.29
The Chinese Meteorological Society
Article Information
- Zhang Shaobo, LÜ Shihua, Bao Yan, MA Di, 2015.
- Sensitivity of precipitation over China to different cumulus parameterization schemes in RegCM4
- J. Meteor. Res., 29(1): 119-131
- http://dx.doi.org/10.1007/s13351-014-4042-2.
Article History
- Received March 19, 2014;
- in final form August 2, 2014


2 University of Chinese Academy of Sciences, Beijing100049
Cumulus convection process is a primary partof cloud processes. It significantly affects the climate system by influencing the vertical structureof tropospheric temperature and moisture,radiativeheating/cooling,water vapor circulation, and so on(Arakawa,2004). However,because the resolutionsof General Circulation Models(GCMs) and RegionalClimate Models(RCMs)are too coarse to capture thecumulus cloud on a subgrid scale,cumulus parameterization is commonly used to represent the cumulusconvection process in numerical models.
The International Centre for Theoretical Physics(ICTP)Regional Climate Model(RegCM)is one ofthe most popular RCMs, and is widely used for EastAsian climate research(Gao et al., 2001,2013; Ju et al., 2007; Zhang et al., 2009; Kang et al., 2014).With the development of RegCM from versions 1.0 to4.3,several cumulus parameterization schemes(CPSs)have been imported to the model(Giorgi et al., 2012) and many sensitivity studies have been carried out(Liu and Ding, 2007; Gianotti et al., 2012; Sinha et al., 2013). However,no CPS has been shown to outperform the others in all aspects of simulated climatology(Kang and Hong, 2008)because each has its advantages and disadvantages,considering complex globaltopography and climate backgrounds. For example,the Emanuel scheme(Emanuel,1991)tends to produce excessive precipitation over l and areas,while theGrell scheme(Grell,1993)tends to produce excessively weak precipitation over tropical oceans(Giorgi et al., 2012). Consequently,CPS sensitivity studiesover particular areas are very important for the application and development of RegCM.
The Tiedke scheme(Tiedtke,1989)was added toRegCM in the newly released version 4.3. This schemehas been used in many numerical models,including theECMWF model(Slingo,1987) and the Spectral Atmosphere Model of LASG IAP(Zhang et al., 2010). Bao(2013)applied the Tiedtke scheme to RegCM3, and found that it well described surface climate and largescale circulation in East Asia,especially when compared with the Grell scheme. Comparing the simulations of the Emanuel and the Tiedtke schemes over theTibetan Plateau in RegCM4,Luo et al.(2014)foundthat the simulation with the Tiedtke scheme exhibitedobvious daily and monthly variations of summer precipitation. While these studies have investigated thegeneral features of the Tiedtke scheme in simulatingprecipitation in different regions,further validation isrequired for East Asia.
Due to the limitation of computing resources,researchers have previously concentrated on climate orannual mean states rather than long-term variance inRCM studies(Gao et al., 2001; Ju et al., 2007). Withthe development of computer techonology and the import of parallel algorithms to RegCM,wider area and longer-time sensitivity studies become feasible,suchas those focusing on the l and surface scheme(Zou and Xie, 2012; Kang et al., 2014) and those on lateral boundary conditions(Oh et al., 2013; Park et al., 2013). However,sensitivity studies using different CPSs over a long timescale,e.g.,20 yr,are seldomfound in the literature. Here,we provide a long-termsensitivity study of precipitation over China using different CPSs,based on a group of 31-yr simulationsusing RegCM. This paper is organized as follows. Themodel and experiment design are described briefly inSection 2. Section 3 presents an analysis of spatialdistribution and temporal variation of simulated precipitation and the East Asian summer monsoon index(EASMI). Finally,Section 4 gives conclusions and discussion. 2. Model description and experiment design 2.1 Model description
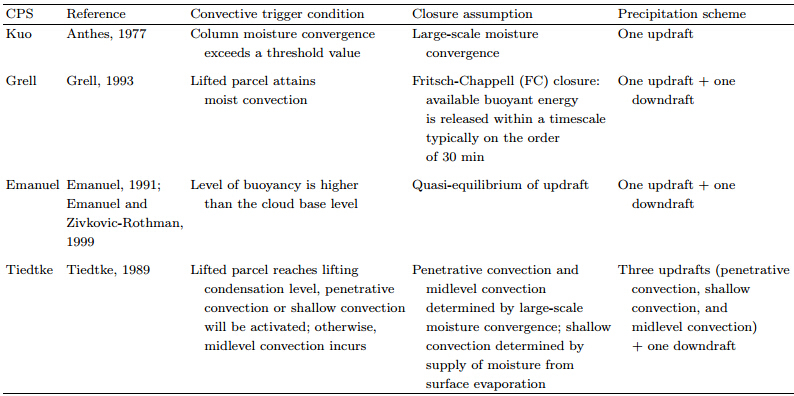
The model used in this study is RegCM version4.3(RegCM-4.3)released and maintained by the ICTP(http://gforge.ictp.it/gf/download/frsrelease/199/1215/RegCM-4.3.5.7.tar.gz). Compared with RegCM3,the new version has many improvements in physicalprocess representation,data storage, and so on. Forexample,it is coupled with the community l and modelversion 3.5(CLM3.5) and has a new planetary boundary layer scheme developed by University of Washington, and the Tiedtke CPS. Based on the advantage of Network Commonn Data Form(NetCDF-4),the model supports reading and writing compresseddata in parallel,which has greatly improved the storage speed and reduced the required storage capacity.There are four available CPSs in the model: Kuo(Anthes,1977),Grell(Grell,1993),Emanuel(Emanuel,1991; Emanuel and Zivkovic-Rothman, 1999), and Tiedtke(Tiedtke,1989). They are compared in Table 1,in terms of the convective trigger condition,closureassumption, and precipitation scheme. A detailed description of RegCM4 can be found in Giorgi et al.(2012).2.2 Experiment design
The model domain under this study covers China and its surrounding area, and is centered at 31°N,110°E(Fig. 1). Based on the Lambert map projection,the true latitudes are defined as 25° and 50°N.The horizontal resolution is 50 km,with 192×144grid points in the longitudinal and latitudinal directions. There are 18 vertical levels in theσ-coordinate,with the top level at 50 hPa. The initial and lateralboundary conditions are obtained from the ERAinterim reanalysis(Dee et al., 2011)with a resolutionof 1.5°×1.5°at 6-h intervals,by using the exponentialrelaxation technique. Sea surface temperature dataare from the US National Oceanic and AtmosphericAdministration(NOAA)website(http://www.esrl.noaa.gov/psd/data/gridded/data.noaa.oisst.v2.html),which is updated weekly. The simulations ran from 1September 1982 to 31 December 2012,with the modelspin-up period from 1 September 1982 to 31 December 1984. Therefore,we only analyze the simulationresults from 1985 to 2012.
 |
| Fig. 1. Model domain and topography(m). Subregions A,B, and C refer to the Tibetan Plateau,East China, and theEast Asian monsoon area. |
To study the sensitivity of precipitation overChina to different CPSs,we conducted four simulations,each using a different CPS as described inTable 1. Aside from the CPS,other physical parameterizations used in this study include the radiativetransfer scheme of the Community Climate ModelCCM3(Kiehl et al., 1996),the planetary boundarylayer scheme of Holtslag et al.(1990),the l and sur-face scheme BATS1e(Biosphere-Atmosphere TransferScheme version 1e)of Dickinson et al.(1993), and the resolved scale precipitation scheme of Pal et al.(2000).
Two datasets are used for comparison in the following analysis. They are 1)the surface precipitation(version 2)data of China on a resolution of 0.5°×0.5°,referred to as OBS; and 2)the ERA-interim reanalysisproduct(Dee et al., 2011). The OBS data were generated from precipitation observations at 2400 stationsover China,processed and quality controlled by theNational Meteorological Information Center of China.3. Results 3.1 Spatial distribution of simulated precipitation
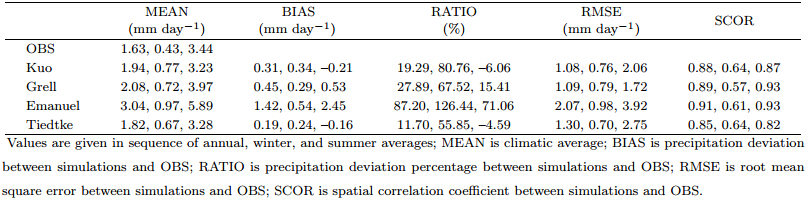
The annual precipitation distribution in Southeast to Northwest China is well simulated by the Kuo,Grell,Emanuel, and Tiedtke schemes,as shown in theleft-h and column of Fig. 2. However,the Emanuelscheme overestimated the precipitation over almostentire China with a bias ratio greater than 100%. Theother three CPSs only overestimated the precipitationover northern and northwestern China but underestimated that over southern China. The bias patterndistribution of the Emanuel scheme led to a 87.2%overestimate of precipitation over China(Table 2),greater than those from the other three CPSs. TheGrell scheme produced more than twice the precipitation overestimate,compared to the Tiedtke scheme.Overall,though the spatial correlation between theTiedtke scheme and OBS is less than the other CPSs,the bias area of the Tiedtke scheme greater than 20%is smaller than the Grell and the Emanuel schemes butslightly larger than the Kuo scheme(Fig. 2).
 |
| Fig. 2. Precipitation distribution annually(left column),in winter(middle column), and in summer(right column)from(a1–a3)OBS and the simulations using the(b1–b3)Kuo,(c1–c3)Grell,(d1–d3)Emanuel, and (e1–e3)Tiedtkeschemes. The precipitation deviation percentage(%)is indicated by hatched fill patterns. |
 |
|
In winter(December to February),the area withprecipitation larger than 2 mm day−1is mainly distributed to the south of the Yangtze River,with littledifference among the four CPSs. The bias distribution of the four CPSs is negative in southern China,with absolute values larger than 20%, and positiveelsewhere,at more than 100%,leading to a generaloverestimate of winter precipitation in China. Thisbias distribution is also found by Zhang et al.(2007),who explained its cause as an underestimate of moisture in the lower troposphere. In addition,the biasof the regions with less precipitation is highlighted bythe percentage analysis. Among the four CPSs,theTiedtke scheme has the smallest overestimate(0.24mm day−1),smallest root mean square error(RMSE;0.7 mm day−1), and the largest spatial correlation(0.64),indicating its advantage for simulating winterprecipitation over China.
In summer(June to August),there is a more obvious difference among the four CPSs than in annual and winter. The Kuo and the Tiedtke schemes underestimated precipitation over eastern China(EC)with anegative bias of smaller than 10%,while the Grell and the Emanuel schemes overestimated over EC. Thereare more positive bias areas in the Emanuel thanthe Grell scheme simulation,leading to the largest(71.06%)overestimate of the Emanuel scheme overChina,among the four CPSs. Overall,the bias distribution of summer precipitation is similar to(differentfrom)that of annual(winter)precipitation. This maybe because relative more(less)precipitation occurs insummer(winter),leading to a bigger(smaller)weightin computing the annual mean precipitation. Amongthe four CPSs,the Tiedtke scheme shows the smallestbias percentage of –4.59%.
The above analysis indicates that the differenceamong the four CPSs is small(big)in winter(summer),especially over EC. It is known that differentCPSs have different physical hypotheses: some CPSsfocus on local atmospheric stability(i.e.,the Grell and the Emanuel),while the others focus on large-scale water vapor movement(i.e.,the Kuo and the Tiedtke).The convective available potential energy(CAPE)wellrepresents atmospheric stability,while the water vapor transport(WVT)integrated from ground surfaceto 500 hPa is often used to indicate large-scale watervapor movement. Here the climatic summer CAPE and WVT are calculated and shown in Fig. 3. In Fig. 3a,the northward WVT reached northern China,withmaximum CAPE in the South China Sea. This agreeswith the northwestward decrease of precipitation. Allthe CPSs captured the characteristics of WVT,withthe WVT maximum appearing over southern China.The lower CAPE over southern China in all the fourschemes(especially the Grell scheme)might have ledto less convective activity there,thus explaining the reduced precipitation over southern China. In addition,stronger convergence of WVT and higher CAPE in theKuo,Emanuel, and Tiedtke CPS are found over thesoutheast coast of China and northern South ChinaSea, and this phenomenon explains the abnormallystrong precipitation there.
 |
| Fig. 3. Distributions of climatic summer CAPE(shading; J kg−1) and WVT(vectors; 100 kg m−1s−1)from(a)ERA-interim data, and simulations using the(b)Kuo,(c)Grell,(d)Emanuel, and (e)Tiedtke schemes. |
In order to better describe the temporal variationof precipitation from each CPS simulation,we choosethree subregions for further analysis. As indicated inFig. 1,they are 1)the high-altitude eastern TibetanPlateau(TP; 29°–38°N,90◦–100°E),2)eastern China(EC; 26°–32°N,110◦–120°E)with abundant precipitation, and 3)China(CN)as a whole.
Because of the influences of the East Asian summer monsoon(EASM) and the Indian monsoon,precipitation is unimodal with a single peak in summer(Fig. 4). All the CPSs simulated well the seasonal variation in CN,while the Emanuel and theGrell schemes overestimated the monthly precipitationamount,with a maximum bias of 2.6 mm day−1in theEmanuel scheme in July(Fig. 4a). Though the precipitation is overestimated(underestimated)in spring(summer)by the Kuo and the Tiedtke scheme,thesetwo schemes show lower bias and RMSE than the Grell and the Emanuel schemes(Figs. 4a and 4d). For theTP,there is a common overestimate of precipitationfor all four CPSs,except for a 0.1 mm day−1underestimate from the Tiedtke scheme in August(Fig. 4b).For EC,the difference among the CPSs is large,averaged as a 0.68 mm day−1overestimate in the Emanuelscheme, and a common underestimate in the Kuo,theGrell, and the Tiedtke schemes(Fig. 4c). Overall,theTiedtke scheme shows the smallest bias and RMSE,implying that it is the best scheme for predicting seasonal variations of precipitation. In addition,the factthat the Emanuel scheme exhibits such an obviousoverestimate of precipitation agrees with Wang and Yu(2011),who argued that convective activity wasoverestimated in the Emanuel scheme and led to excessively simulated precipitation.
 |
| Fig. 4. Monthly variations of simulated and observed precipitation averaged over(a)CN,(b)TP,(c)EC, and (d)the related annual mean statistics. The mean is the annual average and rmse is the root mean square error betweensimulations and OBS. |
Box plots of the interannual precipitation variations in CN,TP, and EC are shown in Fig. 5. FromFig. 5a,it is clear that the precipitation annual variation range is bigger in EC(1.65 mm day−1)than inTP(0.4 mm day−1) and CN(0.33 mm day−1). Thisindicates that the interannual variability of precipitation is larger in the coastal areas of China than ininl and areas. All CPSs have simulated this characteristic well,though with different magnitudes of interannual variance. Compared to the annual analysis,the seasonal analysis in Figs. 5b and 5c revealsthat there is a smaller(bigger)precipitation variationrange, and the difference in winter(summer)amongeach CPS is also relatively small(big),meaning thatthe precipitation interannual variance is small(big)in winter(summer). There is a common underestimate(overestimate)over EC(TP and CN)in winterwhile the results vary greatly in summer. For example,the simulation over EC is obviously overestimatedin the Emanuel scheme, and underestimated for theother three CPSs in summer. The bias of the Tiedtkescheme is the smallest among all the CPSs(Fig. 5).
 |
| Fig. 5. Box plots of the interannual precipitation variability over CN,TP, and EC for(a)annual,(b)winter, and (c)summer. Extra filled dots are the average precipitation plus 2. |
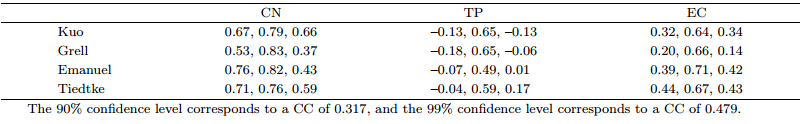
The correlation coefficients(CCs)between thesimulations and OBS are shown in Table 3. In general,higher CCs are with the simulations of winterprecipitation(middle column of each array of numbersin Table 3), and the CCs are significant at the 99%confidence level per the Student’s t test. For summer precipitation,the CCs are not significant and varygreatly,e.g.,the TP has a negative near zero CCs fromthe Kuo and the Grell schemes. Less precipitation inwinter results in smaller interannual variance of precipitation,so the CCs are underst and ably higher inwinter. In addition,the percentage of convective precipitation in winter is also small,so the influence ofthe different CPSs in winter is low. Therefore,we seea higher consistency in winter precipitation among thefour CPSs. Opposite trends appear in summer. Overall,the model has simulated the interannual varianceof precipitation better in winter than in summer, and better for CN than for the subregional(TP and EC)average.
 |
|
Figure 6 displays decadal variations of the domainaveraged precipitation from OBS and the simulations.Annually,the mean value over TP is 0.038 mm day−1(10 yr)-1,indicating an increase as that found byWang and Yu(2011). Because of the difference in dataused and division of subregions,the concrete values ofthe decadal variation of precipitation over TP are different between this study and Wang and Yu(2011).Seasonally,the decadal variations are more obviousin summer,with an increase of more than 0.15 mmday−1(10 yr)-1over EC and TP. The decadal variations in winter and annual precipitation are minor and even negative. When considering each CPS,there isa consistent positive decadal precipitation variation inEC for summer, and the Tiedtke scheme produces thebest fit. The deviation of simulation to OBS is largefor summer precipitation. Put succinctly,the modelhas better simulated the decadal increase of precipitation over TP than over EC,with more success inwinter than in summer,which may be related to thethe relatively low precipitation level in winter.
 |
| Fig. 6. Decadal variations of precipitation over the selected domains from OBS and the simulations using thefour CPS schemes. |
In this study,the EASM index defined by Li and Zeng(2005)was calculated over the East Asian monsoon domain(10°–40°N,110°–140°E; domain C inFig. 1). Using the index,Li and Zeng(2005)foundthat there was an obvious relationship between theEASM index and precipitation over EC. When theEASM index increased,precipitation over the middle and lower reaches of the Yangtze River was less thanusual, and vice versa.
We calculated the EASM index using both theERA-interim and model simulation data, and the results are shown in Fig. 7. An overestimate of theEASM index is found in the Grell(1.77) and theEmanuel(1.68)schemes, and an underestimate in theKuo(–1.24) and the Tiedtke(–0.39)schemes. Thedifferences in the EASM index may well explain thedifferences in simulated spatial distribution of precipitation. The stronger EASM in the Grell and theEmanuel simulations has produced more precipitation over EC. The weaker EASM in the Kuo and theTiedtke simulations leads to the precipitation underestimate over EC. In addition,the Tiedtke scheme hasthe smallest bias(–0.39)in the simulated EASM index,suggesting that it could better simulate the precipitation in the EASM region.
 |
| Fig. 7. Interannual variations of the EASMI from the ERA-interim data and the simulations using the four CPSs. Thetable shows the CPS scheme,mean value(mean),st and ard deviation(std), and the correlation coefficient of the EASMIbetween the CPS and ERA-interim(cor). |
Figure 8 shows distributions of the CC betweenthe EASM index and summer precipitation form OBS and the simulations with different CPSs. Figure 8a indicates a negative correlation between observedEASMI and summer precipitation over the middle and lower reaches of Yangtze River,in accord with Li and Zeng(2005). Similar CC distributions are also foundin the Grell and the Emanuel simulations,implyingthat those two schemes have an advantage in simulating the correlation between the EASMI and precipitation. Although the Grell and the Emanuel schemeshave failed to simulate the interannual variation of theEASMI well(Fig. 7; the EASMI values and the amplitude of the EASMI variation are overestimated),they produced the positive relationship between theEASMI and summer precipitation well(Fig. 8). TheKuo and the Tiedtke schemes failed to simulate theCC distribution well,but they well simulated the interannual variation of the EASMI magnitude(not thephase). The poor simulations in the phase changeof the EASMI variance by the Kuo and the Tiedtkeschemes may result in the poor CC distribution inFigs. 8b and 8e.4. Conclusions and discussion
This study used the RegCM-4.3 model driven bythe ERA-interim data to investigate the impact of different CPSs on simulating precipitation over China. Agroup of 31-yr long-term simulations with the BATS1el and surface model were conducted.
The annual precipitation distribution in Southeast to Northwest China is well simulated by all theCPSs,especially the Emanuel scheme. However,theEmanuel scheme produces an overestimate of annualprecipitation,with a bias ratio greater than 100%,while the other three CPSs have only overestimatedthe annual precipitation over northern and northwestern China but underestimated it over southernChina. The difference of seasonal precipitation simulation among all the CPSs is small in winter and big in summer,especially over eastern China. Amongthe four CPSs,the Tiedtke scheme exhibits the smallest overestimate of precipitation in winter and summer,indicating its advantage in simulating precipitation over China.
All the CPSs are able to better simulate seasonal than interannual variance of precipitation. TheTiedtke scheme produces the best seasonal variation inprecipitation. For interannual variance,all the CPSscapture the larger interannual variation of precipitation along the southeastern coastal areas of Chinawhere abundant precipitation occurs than in inl and areas. The model simulates the interannual variationof precipitation better in winter than in summer, and better for entire China than for the subregional average(such as TP and EC). When considering thedecadal trend of precipitation,the model performsbetter over TP than over EC, and better in winterthan in summer.
There is an overestimation of the strength of theEASM index with the Grell and the Emanuel schemes, and a slight underestimation with the Kuo and theTiedtke schemes,which may explain the corresponding precipitation bias of these schemes over EC. TheTiedtke scheme produces the smallest bias in thestrength of EASMI,suggesting that it may better simulate the total precipitation amount(not necessarilythe distribution)in East Asia. A negative relationship between the EASMI and summer precipitationover the middle and lower reaches of Yangtze Riverwas found in the ERA-interim data and the simulations using the Grell and the Emanuel schemes,whilethis negative correlation was missed by the simulationsusing the Kuo and the Tiedtke schemes.
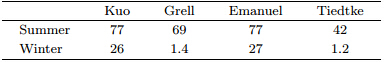
Generally speaking,the simulations show a positive(negative)bias of precipitation in northern(southern)China,consistent with previous studies(Zhang et al., 2007; Giorgi et al., 2012), and leading to an unrealistic northward rain belt in EC. Zhang et al.(2007)argued that one of the main causes of the negative precipitation bias in southern China was the colder and drier nature of the lower troposphere. Comparison ofthe percentage of simulated convective precipitation tototal precipitation over CN in Table 4 indicates thatconvective precipitation plays a more important rolein summer than in winter. Therefore,the influenceof the different CPSs is more significant in summer,while the influence is small in winter when precipitation mainly comes from large-scale instead of convective precipitation. This can explain the large differenceamong the CPSs’ prediction of precipitation in summer, and the high consistency in winter.
 |
|
All the CPSs,especially the Tiedtke scheme,havereasonably produced the annual variation of precipitation over China; however,the interannual and decadalvariations of precipitation are poorly simulated. Thisconclusion should be treated with caution becausemany factors may have influenced the result. First,different CPSs may cause various extreme values and the applicability of these CPSs to the prescribed subregions might need a further scrutiny. Second,the simulation results are influenced not only by CPSs,butalso by topography(Gao et al., 2006; Lee et al., 2011),lateral boundary conditions(Oh et al., 2013; Park et al., 2013),l and surface parameterizations(Zou and Xie, 2012; Kang et al., 2014), and so on. For a bettersimulation of precipitation variation,further optimization should be applied to the experimental design and other physical parameterization schemes.
Overall,the newly added CPS,the Tiedtkescheme,has some advantages in simulating the temporal and spatial distributions of precipitation in China.However,Table 4 indicates that the percentage ofconvective precipitation to total precipitation in theTiedtke scheme is only 42% in summer,which is muchless than others,as also found by Luo et al.(2014).This abnormally low proportion of convective precipitation might be relevant to a defective key parameterin the Tiedtke scheme,presenting a new question forour further research.Acknowledgments.
We acknowledge computing resources and time at the Supercomputing Centerof Cold and Arid Regions Environment and Engineering Research Institute,Chinese Academy of Sciences.
| [1] | Arakawa, A., 2004: The cumulus parameterization prob-lem: Past, present, and future. J. Climate, 17,2493-2525. |
| [2] | Bao, Y., 2013: Simulations of summer monsoon cli-mate over East Asia with a regional climate model (RegCM) using Tiedtke convective parameterization scheme (CPS). Atmos. Res., 134, 35-44. |
| [3] | Dee, D. P., S. M. Uppala, A. J. Simmons, et al., 2011: The ERA-interim reanalysis: Configuration and per-formance of the data assimilation system. Quart. J. Roy. Meteor. Soc., 137, 553-597. |
| [4] | Dickinson, R. E., A. Henderson-Sellers, and P. J.Kennedy, 1993: Biosphere atmosphere transfer scheme (BATS) version 1e as coupled to the NCAR community climate model. NCAR Tech. Note, TN387+STR, 11-59. |
| [5] | Emanuel, K. A., 1991: A scheme for representing cumu-lus convection in large-scale models. J. Atmos. Sci.,48, 2313-2335. |
| [6] | Emanuel, K. A., and M. Zivkovic-Rothman, 1999: Devel-opment and evaluation of a convection scheme for use in climate models. J. Atmos. Sci., 56, 1766-1782. |
| [7] | Gao Xuejie, Zhao Zongci, Ding Yihui, et al., 2001: Cli-mate change due to greenhouse effects in China as simulated by a regional climate model. Adv. Atmos. Sci., 18, 1224-1230. |
| [8] | Gao Xuejie, Xu Ying, Zhao Zongci, et al., 2006: Im-pacts of horizontal resolution and topography on the numerical simulation of East Asian precipita-tion. Chinese J. Atmos. Sci., 30, 185-192. (in Chinese) |
| [9] | Gao Xuejie, Wang Meili, and F. Giorgi, 2013: Climate change over China in the 21st century as simulated by BCC-CSM1. 1-RegCM4.0. Atmos. Ocean. Sci.Lett., 6, 381-386. |
| [10] | Gianotti, R. L., D. F. Zhang, and E. A. B. Eltahir, 2012: Assessment of the regional climate model version 3 over the maritime continent using different cumulus parameterization and land surface schemes. J. Cli-mate, 25, 638-656. |
| [11] | Giorgi, F., E. Coppola, F. Solmon, et al., 2012: RegCM4: Model description and preliminary tests over multi-ple CORDEX domains. Climate Res., 52, 7-29. |
| [12] | Grell, G. A., 1993: Prognostic evaluation of assumptions used by cumulus parameterizations. Mon. Wea. Rev., 121, 764-787. |
| [13] | Holtslag, A. A., M. E. I. F. Debruijn, and H. L. Pan, 1990: A high resolution air mass transformation model for short-range weather forecasting. Mon. Wea. Rev., 118, 1561-1575. |
| [14] | Ju, L. X., H. J. Wang, and D. B. Jiang, 2007: Simulation of the last glacial maximum climate over East Asia with a regional climate model nested in a gen-eral circulation model. Palaeogeogr. Palaeoclimatol. Palaeoecol., 248, 376-390. |
| [15] | Kang, H. S., and S. Y. Hong, 2008: Sensitivity of the simulated East Asian summer monsoon climatol-ogy to four convective parameterization schemes. J. Geophys. Res., 113, doi: 10.1002/joc.3998. |
| [16] | Kang, S., E. S. Im, and J. B. Ahn, 2014: The impact of two land-surface schemes on the characteris-tics of summer precipitation over East Asia from the RegCM4 simulations. Int. J. Climatol., doi:10.1002/joc.3998. |
| [17] | Kiehl, J., J. Hack, G. Bonan, et al., 1996: Description of NCAR Community climate model (CCM3). NCAR Technical Note, NCAR/TN-420+STR, 51-78. |
| [18] | Lee, S. W., D. K. Lee, and D. E. Chang, 2011: Impact of horizontal resolution and cumulus parameterization scheme on the simulation of heavy rainfall events over the Korean Peninsula. Adv. Atmos. Sci., 28,1-15. |
| [19] | Li Jianping and Zeng Qingcun, 2005: A new monsoon index, its interannual variability and relation with monsoon precipitation. Clim. Environ. Res., 10,351-365. (in Chinese) |
| [20] | Liu Yanju and Ding Yihui, 2007: Sensitivity study of the South China Sea summer monsoon in 1998 to different cumulus parameterization schemes. Adv. Atmos. Sci., 24, 360-376. |
| [21] | Luo Xiaoqing, Yang Meixue, Wang Xuejia, et al., 2014: Simulation influences of summer precipita-tion by two cumulus parameterization schemes over Qinghai-Xizang Plateau. Plateau. Meteor., 33, 313-322. (in Chinese) |
| [22] | Oh, S. G., M. S. Suh, and D. H. Cha, 2013: Impact of lat-eral boundary conditions on precipitation and tem-perature extremes over South Korea in the cordex regional climate simulation using RegCM4. Asia-Pacific J. Atmos. Sci., 49, 497-509. |
| [23] | Pal, J. S., E. E. Small, and E. A. B. Eltahir, 2000: Sim-ulation of regional-scale water and energy budgets: Representation of subgrid cloud and precipitation processes within RegCM. J. Geophys. Res., 105,29579-29594. |
| [24] | Park, J. H., S. G. Oh, and M. S. Suh, 2013: Impacts of boundary conditions on the precipitation simulation of RegCM4 in the cordex East Asian domain. J. Geophys. Res., 118, 1652-1667. |
| [25] | Sinha, P., U. C. Mohanty, S. C. Kar, et al., 2013: Sensi-tivity of the GCM driven summer monsoon simula-tions to cumulus parameterization schemes in nested RegCM3. Theor. Appl. Climatol., 112, 285-306. |
| [26] | Slingo, J. M., 1987: The development and verification of a cloud prediction scheme for the ECMWF model. Quart. J. Roy. Meteor. Soc., 113, 899-927. |
| [27] | Tiedtke, M., 1989: A comprehensive mass flux scheme for cumulus parameterization in large-scale models. Mon. Wea. Rev., 117, 1779-1800. |
| [28] | Wang Chenghai and Yu Lian, 2011: Sensitivity of re-gional climate model to different cumulus param-eterization schemes in simulation of the Tibetan Plateau climate. Chinese J. Atmos. Sci., 35, 1132-1144. (in Chinese) |
| [29] | Zhang, D. F., A. S. Zakey, X. J. Gao, et al., 2009: Simu-lation of dust aerosol and its regional feedbacks over East Asia using a regional climate model. Atmos. Chem. Phys., 9, 1095-1110. |
| [30] | Zhang Dongfeng, Ouyang Licheng, Gao Xuejie, et al., 2007: Simulation of the atmosphere circulation over East Asia and climate in China by RegCM3. J. Trop. Meteor., 23, 444-452. (in Chinese) |
| [31] | Zhang Jie, Zhou Tianjun, Bao Qing, et al., 2010: The vertical structures of atmospheric tempera-ture anomalies associated with El Niño simulated by the LASG/IAP AGCM: Sensitivity to convection schemes. Adv. Atmos. Sci., 27, 1051-1063. |
| [32] | Zou Jing and Xie Zhenghui, 2012: The effects of the land-surface process parameterization of the RegCM4 on climate simulation in East Asia. Acta Meteor. Sinica, 70, 1312-1326. (in Chinese) |
| [33] | Anthes, R. A., 1977: A cumulus parameterization scheme utilizing a one-dimensional cloud model. Mon. Wea. Rev., 105, 270-300. |