 2014, Vol. 28
The Chinese Meteorological Society
Article Information
- LIU Yi, ZHANG Yuli. 2014.
- Overview of the Major 2012-2013 Northern Hemisphere Stratospheric Sudden Warming:Evolution and Its Association with Surface Weather
- J. Meteor. Res., 28(4): 561-575
- http://dx.doi.org/10.1007/s13351-014-3065-z
Article History
- Received September 9, 2013;
- in final form April 30, 2014


2 University of Chinese Academy of Sciences, Beijing 100049
Stratospheric sudden warming(SSW)dominates the Northern Hemisphere(NH)wintertime variation of the general circulation in the middle atmosphere(e.g.,Andrews et al., 1987). When an SSW event occurs,the stratospheric polar night jet circling the wintertime polar vortex slows down or even reverses direction within a few days,accompanied by a rise of stratospheric temperature by several tens of Kelvins in the polar region. Any SSW event can be regarded as a "major warming" if the circulation reversal is observed at 10 hPa(approximately 32 km)or below(e.g.,McIn-turff,1978). The occurrence of SSW is affected by var-ious external factors,such as solar activity,sea surface temperature, and quasi-biennial oscillation(e.g., Lab-itzke and vanLoon,2000; Baldwin et al., 2001; Liu and Lu, 2010). In recent decades,scientific interest in major SSW has increased due to its influence on atmospheric transport and chemistry(e.g.,Manney et al., 2008,2009; Liu C. X. et al., 2009,2010; Liu Y. et al., 2009,2011) and implications for extended-range weather forecasting at the midlatitude surface(e.g.,Baldwin and Dunkerton, 2001; Baldwin et al., 2003; Sigmond et al., 2013).
During the development of major SSW,the cold stratospheric polar vortex becomes either displaced from the pole or splits(Charlton and Polvani, 2007)as a result of the enhanced upward planetary waves(Matsuno,1971). Nakagawa and Yamazaki(2006)classified SSW events according to their downward propagation into the troposphere and showed that the upward wavenumber-2 is more likely to result in vortex splitting and downward propagation of SSW. Many studies(e.g.,Baldwin and Dunkerton, 1999)have indicated the possibility that SSW can significantly influence tropospheric circulation(e.g.,Julian and Labitzke, 1965; Kodera et al., 2011) and sur-face climate. Scaife and Knight(2008)showed that much of the cold anomaly over Europe in the 2005-2006 winter is likely attributable to the occurrence of SSW. A recent study by Mitchell et al.(2013)also suggests that the displacement or splitting of the stratospheric polar vortex during a major SSW may lead to different patterns of surface weather and climate anomalies. Yi et al.(2013)investi-gated the relationship between weak polar vortex and surface temperature over East Asia,suggesting the potential linkage between high-level air with high potential vorticity and cold weather at the surface. In the 2012-2013 winter,many countries across the high- and mid-latitude Eurasian Continent experi-enced extremely cold episodes. China also witnessed the coldest winter throughout the past few decades(http://www.usatoday.com/story/news/world/2013/ 01/08/china-cold/1817271/). Moreover,an additional major SSW event occurred in early January 2013,which led to a long-lasting polar vortex splitting deep into the upper troposphere.
In this study,we investigate the evolution of the major 2012-2013 NH SSW and its potential linkage to the wintertime surface temperature over North China. The rest of the paper is organized as follows. Section 2 describes the data and methods used. Section 3 examines the dynamical evolution of the warming event in terms of temperature,zonal wind,geopotential height, and planetary wave activity. Section 4 shows the relationship between SSW and surface tempera-ture. Finally,the main conclusions are summarized and discussed in Section 5.
2. Data and methodology
In this study,the daily mean horizontal wind,temperature, and geopotential height are derived from the ECMWF Reanalysis Interim(ERA-Interim)data(e.g.,Simmons et al., 2007a,b; Dee et al., 2011)with a horizontal resolution of 1.5° × 1.5°. Cohen and Jones(2011)summarized the central dates of major SSW events occurring during 1948-2010 on the basis of the NCEP/NCAR reanalysis,during which 18 vortex-displacement events and 17 vortex-splitting events oc-curred,respectively. In this study,the surface temper-ature anomaly and 500-hPa geopotential height after the vortex-splitting in early January 2013 are com-pared with the composite anomalies following various types of SSWs during 1979-2013.
The northern annular mode(NAM)is known as the leading mode of NH circulation and is defined as the leading empirical orthogonal function(EOF)of daily wintertime geopotential anomalies north of 20°N(Baldwin and Dunkerton, 2001). The NAM in-dex(NAMI),defined as the time series of the leading EOF,is calculated in this study to provide a measure of the vertical coupling and the influence of SSW on surface temperature.
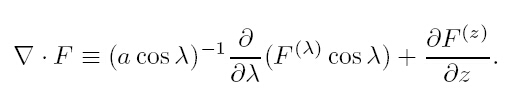
The Eliassen-Palm(E-P)flux(Eliassen and Palm, 1961) and its divergence(e.g.,Edmon et al., 1980),which depict planetary wave activity and eddy forc-ing on zonal mean flow,respectively,are examined to characterize the feature of the planetary wave in the 2012-2013 winter. The components of the E-P flux,F ≡(O,F(λ),F(z),are defined as
where θ refers to potential temperature. The diver-gence of the E-P flux is given by
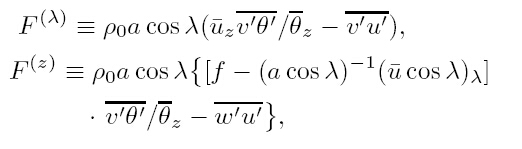
Due to differences in magnitude through the tro-posphere and stratosphere,the E-P flux in this study is scaled by 1.0 below 100 hPa,2.0 between 100 and 10 hPa, and 0.4 above 10 hPa. Because meridional heat flux is proportional to the vertical component of the E-P flux,the 100-hPa zonal mean eddy heat fluxes of the first three zonal wavenumber components averaged over 45°-75°N are computed to quantify the activity of upward-propagating wavenumber-1,-2, and -3 plan-etary waves(Fig. 1). 3. Dynamical evolution
Figure 1a shows the temporal evolution of verti-cal profiles of Arctic air temperature(60°-90°N) and zonal-mean zonal wind along 64.5°N from the up-per troposphere(500 hPa)to the upper stratosphere(1 hPa). It is shown that the warming and easterly winds occurred at 1 hPa at the beginning of January 2013 and propagated downward into the upper tro-posphere and lower stratosphere(UTLS)within ap-proximately two weeks(6-20 January 2013). After-ward,the upper and mid stratosphere cooled down at the end of January. The warming signal persisted in the UTLS region until late February and early March. Furthermore,a good correlation appeared between the warming signals in the mid stratosphere including the increased temperature and decreased zonal wind at 10 hPa(Fig. 1b) and the zonal-mean eddy heat flux at 100 hPa(Fig. 1c),suggesting the importance of the planetary waves upward-propagating from the troposphere to the initiation and development of the warming event. For example,enhanced activity of the wavenumber-2 planetary wave began in late November and early December 2012(Fig. 1c),leading to a pro-nounced disturbance in the stratospheric polar vortex(Figs. 2a-7a). Although the planetary wave activ-ity was not strong enough to cause a major warm-ing event,it was followed by a pronounced temper-ature increase(up to 15 K or so)at 10 hPa over the North Pole and a pronounced decrease(approximately from 40 to 10 m s-1)in the 10-hPa zonal-mean zonal wind at 64.5°N(Fig. 1b). Before the full recovery of the stratospheric polar vortex,an additional burst of the upward-propagating wavenumber-1 planetary wave began in mid December and peaked on 23 De-cember 2012(Fig. 1c). Shortly after this peak,a third burst of planetary wave began on 28 December 2012 and peaked on 5 January 2013. Different from the pre-vious two bursts of upward planetary waves beginning in late November and mid December,the third burst of planetary wave was composed of mixed wavenumber-1 and -2 components. The highly active planetary waves from mid December 2012 to early January 2013 led to a splitting of the stratospheric polar vortex on 7 January 2013,with a 10-hPa temperature over the North Pole rising from 200 K to above 240 K within 10 days,from 30 December 2012 to 7 January 2013. After mid January 2013,the fourth planetary wave burst,which was dominated by a wavenumber-2 com-ponent,leading to a persistent disturbance of the lower stratosphere(Fig. 1a).
To illustrate the relationship between the tro-pospheric planetary wave and the horizontal distri-bution of the stratospheric polar vortex,Figs. 2-7 show the evolution of the daily mean E-P fluxes of wavenumbers-1 and -2,all wavenumbers, and their divergences in both the troposphere and stratosphere,as well as geopotential height in the mid troposphere(500 hPa),UTLS(100 and 50 hPa),mid stratosphere(10 hPa), and upper stratosphere(5 hPa). The plot of E-P flux at 1 hPa was omitted,given its similarity to that at 5 hPa.
As shown in Fig. 2c,on 1 December 2012,upward-propagating E-P flux occurred above the mid troposphere(approximately 500 hPa)between 45° and 60°N. The E-P flux of the wavenumber-2 planetary wave(Fig. 2b)was greater than that of wavenumber-1(Fig. 2a),suggesting that the wavenumber-2 was more active at this time. The upward E-P flux of the wavenumber-2 planetary wave showed a slight pole-ward propagation between the lower and mid strato-sphere,leading to a pronounced wavenumber-2 dis-turbance in the lower stratospheric polar vortex(Figs. 2d-f). The E-P flux turned equatorward as soon as it arrived at 30 hPa. As a result,the disturbance of the mid and upper stratospheric polar vortex was much weaker than that in the lower stratosphere,as revealed by a comparison of Figs. 2g-h and Figs. 2e-f. The area of negative E-P flux divergence between 70 and 10 hPa was confined to the region south of 75°N,which was still far from the core of the polar vortex. There-fore,as shown in Figs. 1a and 1b,the wavenumber-2 disturbance did not cause a major SSW event.
 |
| Fig. 2. Eliassen{Palm(E-P)flux(vector; kg s¡2) and its divergence(negative contour; kg m¡1 s¡2)of(a)wavenumber-1,(b)wavenumber-2, and (c)all wavenumbers for the troposphere and stratosphere on 1 December 2012, and thecorresponding geopotential height(£103 gpm)at(d)500,(e)100,(f)50,(g)10, and (h)5 hPa. |
On 21 December 2012,the upward E-P flux in the troposphere became stronger(Fig. 3c),leading to large areas of negative E-P flux divergence between 45° and 75°N in the mid and upper troposphere(500-200 hPa). The main contributor was the E-P flux of the wavenumber-1 planetary wave in the strato-sphere,as revealed by a comparison of Figs. 3a and 3b. The upward-propagating wavenumber-1 plane-tary wave(Figs. 3a and 1c)led to a similar cir-culation pattern throughout the stratosphere(100-5 hPa),with the stratospheric polar vortex over North Europe and high geopotential height over the Aleu-tian Isl and s(Figs. 3e-h). In the troposphere,the active wavenumber-1 planetary wave was related to a deep trough over East Asia. Moreover,strong tropo-spheric wavenumber-2 activity also occurred(Fig. 3b),which disturbed the wavenumber-1 pattern by produc-ing multiple ridges along the latitude. The strongest ridge in the troposphere was located to the east of the Date Line,extending from North Pacific to the Aleu-tian Isl and s and the Bering Sea(Fig. 3d).
 |
| Fig. 3. As in Fig. 2,but for 21 December 2012. |
In late December 2012,the upward E-P flux per-sisted throughout the troposphere and stratosphere,producing an increased area of negative E-P flux di-vergence in the upper stratosphere above 10 hPa(e.g.,Fig. 4c). However,the area with E-P flux conver-gence in the upper stratosphere was confined equa-torward of 60°N,suggesting that the polar vortex was weak at those altitudes. The E-P flux of the wavenumber-1 planetary wave(Fig. 4a)was greater than that of wavenumber-2(Fig. 4b). As a result,the distribution of geopotential height shows that the wavenumber-1 pattern of disturbance can be at-tributed to a tropospheric ridge extending from the subtropical eastern Pacific northward toward the west coast of North America(Fig. 4d). As a result,similar ridges appeared over the same region throughout the UTLS(Figs. 4e-f). The poleward intrusion from mid-latitude was also shown by the poleward propagation of E-P flux between 100 and 30 hPa,as revealed by comparison between Fig. 4c and Figs. 4e-f. In con-trast,the upper stratospheric ridges over East Asia(e.g.,10-5 hPa)indicated a pronounced westward tilt of the planetary wave with height(Figs. 4g-h). The lag of ridge between the upper and lower stratosphere further indicates the upward influence of the planetary wave prior to the onset of the 2012-2013 major SSW.
 |
| Fig. 4. As in Fig. 2,but for 30 December 2012. |
With the propagation and development of the up-ward planetary waves,the Aleutian high intensified on 5 January 2013(Figs. 5g-h). As a result,poleward propagation of the E-P flux was enhanced in the up-per stratosphere,leading to large areas of negative E-P flux divergence within the Arctic region(Fig. 5c). Different from the wavenumber-1 pattern in the upper stratosphere(Figs. 5g-h,5a, and 1c),an additional tropospheric ridge developed quickly over the North Atlantic/Europe sectors,producing the pronounced wavenumber-2 patterns just prior to the major SSW throughout the mid troposphere and the UTLS(Figs. 5d-f,5b, and 1c).
 |
| Fig. 5. As in Fig. 2,but for 5 January 2013. |
With the upward propagation of the plane-tary wave related to the ridge over the North At-lantic/Europe sectors,the wavenumber-2 pattern be-came clear in the mid and upper stratosphere on 7 January 2013(Figs. 6b and 6g-h). As a result,the E-P fluxes of both wavenumber-1 and -2 planetary waves were enhanced poleward and converged between 70 and 10 hPa(Figs. 6a-c),causing the occurrence of easterly winds at high latitudes(Fig. 1a). The east-erly winds in the mid and upper stratosphere prohib-ited the upward propagation of the planetary wave be-yond the mid stratosphere,leading to the subsequent splitting of the polar vortex in the lower stratosphere(Figs. 6f and 7e).
 |
| Fig. 6. As in Fig. 2,but for 7 January 2013. |
On January 20,two weeks after the central date of the SSW,the upper stratospheric polar vortex re-mained completely broken up(Figs. 7g-h), and the lower stratospheric polar vortex remained split(Figs. 7e-f)due to the wavenumber-2 activity at those lev-els(Fig. 7b). In the troposphere,an additional ridge that developed over the west coast of North America triggered a fourth planetary wave burst after mid Jan-uary 2013(Fig. 1c). However,with the prevalence of easterlies in high latitudes throughout the stratosphere(Figs. 7e-h),the tropospheric disturbances did not propagate further upward(Fig. 7c). The negative E-P flux divergence of the wavenumber-2 planetary wave below 200 hPa(Fig. 7b)suggests that the interactions between the planetary wave and zonal flow remained strong in the upper troposphere. These interactions may also be important in the persistence of the polar vortex splitting in the UTLS. At the end of January 2013,the polar vortex began to recover gradually.
 |
| Fig. 7. As in Fig. 2,but for 20 January 2013. |
As shown by recent studies(e.g.,Thompson et al., 2002; Baldwin et al., 2003),stratospheric circu-lation anomalies associated with major SSW events may lead to large-scale anomalous weather patterns at the surface. As shown in Fig. 1a,a long-lasting disturbance in the polar vortex in the UTLS region propagated downward and may have influenced the troposphere and the surface. Figures 8a,8c,8e, and 8g show the time-height evolution of the composite NAMI throughout the winters(from November to April)dur-ing the vortex displacement,vortex splitting,all SSW events with no separated vortex displacement and vor-tex splitting, and the 2012-2013 SSW,respectively. The positive NAMI before the vortex-split SSW(Fig. 8c)was stronger than that before the vortex-displaced SSW(Fig. 8a). Strong negative NAMI occurred along with the SSW events(Figs. 8a,8c,8e, and 8g),sug-gesting strong disturbances of the polar vortex. As the disturbance propagated downward,this negative NAMI gradually descended to the troposphere,likely resulting in the anomalous tropospheric circulation and surface temperature.
 |
| Fig. 8.(a,c,e,g)Composites of 1979{2013 time-height evolution of the northern annular mode index(NAMI), and (b,d,f,h)30-day average 500-hPa geopotential height(contour; m) and surface temperature anomalies(shading; K)after the central dates of the 2012{2013 SSW during(a,b)vortex-displacement SSW events;(c,d)vortex-split SSWevents;(e,f)all SSW events; and (g,h)the 2012{2013 SSW. Lag 0 in(a,c,e)indicates the central dates of SSW events.Positive and negative values in(b,d,f,h)are indicated by solid and dashed contours,respectively,with an interval of30 gpm. The color-shaded(blue for negative; red for positive)anomalies in(b,d,f)are statistically significant at the95% confidence level based on Student's t-test. |
Figures 8b,8d,8f, and 8h show a comparison of the 30-day mean surface temperature anomaly and the 500-hPa geopotential height anomaly following the central date of the major 2012-2013 SSW for the vor-tex displacement,vortex splitting, and all SSW events during 1979-2013. As shown in Figs. 8b and 8d,after the vortex displacement and vortex splitting events,large-scale surface temperature anomalies occurred. After the vortex-split SSW events,the two split polar vortex components tended to move toward East Asia and North America separately,leading to the deepen-ing of a tropospheric trough over each region. As a re-sult,negative surface temperature anomalies occurred over the northern Eurasian continent and southern United States(Fig. 8d).
Similar to a previous study by Mitchell et al.(2013),the temperature anomalies after vortex-displaced SSWs were significantly weaker,as revealed by a comparison of Figs. 8b and 8d. However,the pattern of surface temperature anomaly after the 2012-2013 SSW event did not resemble the compos-ites of either vortex-displaced or vortex-split SSW events. This result likely occurred because the 2012-2013 SSW shows features of both vortex-displaced and vortex-split SSW events,which were driven by both wavenumber-1 and -2 planetary waves. There-fore,the 2012-2013 SSW resembles the composite pat-tern of all SSW events(Figs. 8e and 8f). After the major 2012-2013 SSW,the 500-hPa geopotential height was characterized by deep troughs over East Asia and North America and strong ridges over North Pacific and North Atlantic. This remarkably strong wavenumber-2 pattern likely contributed to the long-lasting disturbances throughout the UTLS(Fig. 1a). As a result of the persistent trough over East Asia,the surface temperature over northern Eurasia showed a pronounced negative anomaly,which is highly similar to the composite circulation anomaly occurring after vortex-split SSWs(Figs. 8d vs. 8h). However,due to the strong ridge developing from the Bering Sea to the Arctic Ocean,an additional negative surface tem-perature anomaly occurred over central North Amer-ica that differed from the composite of either vortex-displacement or vortex-split SSW events,as revealed by a comparison of Fig. 8h to Figs. 8a and 8d.
5. Summary
In this study,we analyzed the dynamical evolu-tion of SSW in the 2012-2013 boreal winter and its relation to the wintertime surface temperature over the NH. It is shown that four bursts of intermittent planetary waves occurred from the troposphere into the polar stratosphere,including three prior to the polar vortex splitting and one following. From late November to early December 2012,the wavenumber-2 planetary wave led to a pronounced disturbance of the stratospheric polar vortex,although no major SSW occurred. Mixed wavenumber-1 and -2 plane-tary waves from mid December 2012 until the SSW onset on 7 January 2013,led to strong upward E-P flux and convergence throughout the stratosphere at high latitudes. These disturbances were crucial for the weakening and splitting of the stratospheric polar vor-tex.
Evolution of geopotential height and the E-P flux diagnostics at multiple pressure levels(500-5 hPa)indicate that the frequent occurrence of tropo-spheric ridges from North Pacific to the west coast of North America can be the triggering mechanism of the upward planetary waves that led to similar cir-culation patterns throughout the UTLS and the mid-stratosphere. The lag of geopotential pattern in the upper stratosphere also indicates the upward influ-ence of the planetary wave. After the warming sig-nal arrived in the lower stratosphere,the tropospheric wavenumber-2 planetary wave increased again after mid January 2013.
Due to the prevalence of easterlies in high lat-itudes throughout the stratosphere,the tropospheric disturbances were unable to propagate further upward,although the interactions between the planetary wave and zonal flow in the upper troposphere were still im-portant to the persistence of the polar vortex split-ting in the UTLS. With the persistent warming in the lower stratosphere,the upper stratosphere began to cool down and recover at the end of January 2013. These results are consistent with those of our previous study(e.g.,Liu Y. et al., 2009),which revealed that the upward tropospheric planetary waves could hardly penetrate the disturbed lower stratosphere,as shown in Fig. 1a.
The strong downward negative NAMI after SSW,which indicates the downward propagation of the dis-turbance of the polar vortex,likely resulted in the anomalies of 500-hPa circulation and surface temper-ature.
The 2012-2013 SSW shows combined features of both vortex-displaced and vortex-split SSWs. There-fore,the anomalies of 500-hPa geopotential height and surface temperature after the 2012-2013 SSW resemble the compositions of all SSW events with no separated vortex displacement and vortex splitting. It was shown that the remarkable ridge extending from the Bering Sea to the Arctic Ocean together with the resulting deepened East Asian trough play important roles in bringing cold air from the high Arctic to cen-tral North America and northern Eurasia.
In this study,we compared the tropospheric cir-culation and surface temperature anomalies related to vortex-displaced SSW and vortex-split SSW with those of the 2012-2013 major SSW and discovered a statistic connection between the SSW and tropo-spheric anomalies. However,the dynamical expla-nation for the observed connection is still missing. Further studies are required to examine the roles of both the troposphere and stratosphere in creating and maintaining the large-scale circulation anomalies months after the central dates of SSWs.
Acknowledgments: We thank Dr. Chuanxi Liu for his helpful comments and discussion. The ERA-Interim reanalysis data were kindly provided by the ECMWF at http://www.ecmwf.int/products/ data/.
| [1] | Andrews, D. G., J. R. Holton, and C. B. Leovy, 1987: Middle Atmosphere Dynamics. Academic Press, 489 pp. |
| [2] | Baldwin, M. P., and T. J. Dunkerton, 1999: Propagation of the Arctic oscillation from the stratosphere to the troposphere. J. Geophys. Res., 104, 30937-30946. |
| [3] | Baldwin, M. P., and T. J. Dunkerton, 2001: Stratospheric harbingers of anoma-lous weather regimes. Science, 294, 581-584. |
| [4] | Baldwin, M. P., L. J. Gray, T. J. Dunkerton, et al., 2001: Quasi-biennial oscillation. Rev. Geophys., 39, 179-229. |
| [5] | Baldwin, M. P., D. B. Stephenson, D. W. J. Thompson, et al., 2003: Stratospheric memory and skill of extended-range weather forecasts. Science, 301, 636-640. |
| [6] | Charlton, A. J., and L. M. Polvani, 2007: A new look at stratospheric sudden warming. Part I: Climatology and modeling benchmarks. J. Climate, 20, 449-469. |
| [7] | Cohen, J., and J. Jones, 2011: Tropospheric precursors and stratospheric warmings. J. Climate, 24, 6562-6572. |
| [8] | Dee, D. P., S. M. Uppala, A. J. Simmons, et al., 2011: The ERA-Interim reanalysis: Configuration and perfor-mance of the data assimilation system. Quart. J. Roy. Meteor. Soc., 137, 553-597. |
| [9] | Edmon, H. J., B. J. Hoskins, and M. E. McIntyre, 1980: Eliassen-Palm cross-sections for the troposphere. J. Atmos. Sci., 37, 2600-2616. |
| [10] | Eliassen, A., and E. Palm, 1961: On the transfer of en-ergy in stationary mountain waves. Geofys. Publ., 22, 1-23. |
| [11] | Julian, P. R., and K. B. Labitzke, 1965: A study of atmo-spheric energetic during the January-February 1963 stratospheric warming. J. Atmos. Sci., 22, 597-610. |
| [12] | Kodera, K., N. Eguchi, J. N. Lee, et al., 2011: Sudden changes in the tropical stratospheric and tropo-spheric circulation during January 2009. J. Meteor. Soc. Japan, 89, 283-290. |
| [13] | Labitzke, K., and H. Van Loon, 2000: The QBO effect on the solar signal in the global stratosphere in winter of the Northern Hemisphere. J. Atmos. Solar-Ter. Phy., 62, 621-628. |
| [14] | Liu, C. X., Y. Liu, Z. N. Cai, et al., 2009: A Madden-Julian Oscillation-triggered record ozone minimum over the Tibetan Plateau in December 2003 and its association with stratospheric “low-ozone pock-ets”. Geophys. Res. Lett., 36, L15830, doi: 10.1029/2009GL039025. |
| [15] | Liu, C. X., Y. Liu, Z. N. Cai, et al., 2010: Dynamic formation of extreme ozone minimum events over the Tibetan Plateau during northern winters 1987-2001. J. Geophys. Res., 115, D18311, doi: 10.1029/2009JD013130. |
| [16] | Liu, Y., C. X. Liu, H. P. Wang, et al., 2009: Atmospheric tracers during the 2003-2004 stratospheric warming event and impact of ozone intrusions in the tropo-sphere. Atmos. Chem. Phys., 9, 2157-2170. |
| [17] | Liu Yi and Lu Chunhui, 2010: The influence of the 11-year sunspot cycle on the atmospheric circulation during winter. Chinese J. Geophy., 53, 1269-1277. (in Chinese) |
| [18] | Liu Yi, Liu Chuanxi, Tie Xuexi, et al., 2011: Middle strato-spheric polar vortex ozone budget during the warm-ing Arctic winter, 2002-2003. Adv. Atmos. Sci., 28, 985-996. |
| [19] | Manney, G. L., K. Krüger, S. Pawson, et al., 2008: The evolution of the stratopause during the 2006 major warming: Satellite data and assimilated meteorolog-ical analyses. J. Geophys. Res., 113, D11115, doi: 10.1029/2007JD009097. |
| [20] | Manney, G. L., M. J. Schwartz, K. Krüger, et al., 2009: Aura Mi-crowave Limb Sounder observations of dynamics and transport during the record-breaking 2009 Arc-tic stratospheric major warming. Geophys. Res. Lett., 36, L12815, doi: 10.1029/2009GL038586. |
| [21] | Matsuno, T., 1971: A dynamical model of the strato-spheric sudden warmings. J. Atmos. Sci., 28, 1479-1494. |
| [22] | McInturff, R., 1978: Stratospheric warmings: Synoptic, dynamic, and general-circulation aspects. NASA Reference Publ. NASA-RP-1017, NASA, Natl. Me-teorol. Cent., Washington, D. C. |
| [23] | Mitchell, D. M., L. J. Gray, J. Anstey, et al., 2013: The influence of stratospheric vortex displacements and splits on surface climate. J. Climate, 26, 2668-2682. |
| [24] | Nakagawa, K. I., and K. Yamazaki, 2006: What kind of stratospheric sudden warming propagates to the troposphere? Geophys. Trs. Lett., 33, L04801, doi: 10.1029/2005GL024784. |
| [25] | Scaife, A. A., and J. R. Knight, 2008: Ensemble simu-lations of the cold European winter of 2005-2006. Quart. J. Roy. Meteor. Soc., 134, 1647-1659. |
| [26] | Sigmond, M., J. F. Scinocca, V. V. Kharin, et al., 2013: Enhanced seasonal forecast skill following strato-spheric sudden warmings. Nature Geoscience, 6, 98-102. |
| [27] | Simmons, A., S. Uppala, D. Dee, et al., 2007a: ERA-Interim: New ECMWF reanalysis products from 1989 onwards. ECMWF Newsletter, 110, 25-35. |
| [28] | Simmons, A., S. Uppala, and D. Dee, 2007b: Update on ERA-Interim. ECMWF Newsletter, 111, 5. |
| [29] | Thompson, D. W. J., M. P. Baldwin, and J. M. Wal-lace, 2002: Stratospheric connection to Northern Hemisphere wintertime weather: Implications for prediction. J. Climate, 15, 1421-1428. |
| [30] | Yi Mingjian, Chen Yuejuan, Zhou Renjun, et al., 2013: Relationship between winter surface temperature variation in eastern Asia and stratospheric weak po-lar vortex. Chinese J. Atmos. Sci., 37, 668-678. (in Chinese) |