 2014, Vol. 28
The Chinese Meteorological Society
Article Information
- YANG Jing, LU Gaopeng, DU Jian, PAN Weilin. 2014.
- Ground-Based Observations of Unusual Atmospheric Light Emissions
- J. Meteor. Res., 28(4): 624-633
- http://dx.doi.org/10.1007/s13351-014-3086-7
Article History
- Received December 31, 2013;
- in final form April 21, 2014


2 State Key Laboratory of Space Weather, Chinese Academy of Sciences, Beijing 100190;
3 Collaborative Innovation Center on Forecast and Evaluation of Meteorological Disasters, Nanjing University of Information Science & Technology, Nanjing 210044
Transient luminous events(TLEs)are brief opti-cal emissions that occur above thunderstorms. Since the first TLE image was recorded on video by Franz et al.(1990),both ground- and aircraft-based obser-vations have been conducted to underst and the phe-nomenology and mechanisms of TLEs(Sentman et al., 1995; Lyons,1996; Su et al., 2002; Lyons et al., 2003; Hayakawa et al., 2004; Neubert et al., 2005; Ganot et al., 2007). The known types of TLEs include sprites,elves,halos,blue jets,blue starters, and gi-gantic jets(Sentman et al., 1995; Wescott et al., 1995,1996,2001; Fukunishi et al., 1996; vander Velde et al., 2007; Cummer et al., 2009; Soula et al., 2011; Lu et al., 2013). Yair et al.(2005)reported a single event known as Transient Ionospheric Glow Emission in Red(TIGER),with morphology substantially dif-ferent from common TLEs. In this paper,we report four events of unusual atmospheric light emissions ob-served from a station located in the midlatitude area of East China. The morphology of the events appears as bright spots,which differs from any TLEs that are well recognized in previous literature.2. Data description
Sprite observation was conducted in Zhan-hua County(37°49'42"N,118°05'06"E),Sh and ong Province of East China(Yang et al., 2008). The ob-servation system consists of a Watec 902H2 Supreme low-light-level camera(set to a high gain of 0.0003 lux × F1.4)equipped with a 12-mm f/0.8 computar lens; the field of view(FOV)of the imaging system is 31.1°(H)by 21.2°(V). Data from the camera are recorded at 25 frames(each with two interlaced fields)on the computer hard disk; thus,the time resolution of the image sequence is 20 ms. The time correspond-ing to the start of each image field is derived from the Global Positioning System(GPS). UFO(unidentified flying object)capture software is generally used for detecting events with brightness in excess of a certain threshold and for replaying the features of their spa-tial and temporal development.
Two types of data are used to provide time and location information of lightning activity,which in-clude local lightning location network in Sh and ong and Henan provinces and World Wide Lightning Lo-cation Network(WWLLN). Sh and ong Province Light-ning Detection Network provides lightning informa-tion for the selected storms in 2007 and on 20 July 2010. For the storm occurring on 25 July 2010,the lightning data were provided by Henan Province Light-ning Detection Network,which uses similar location technology as that of the United States National Light-ning Detection Network. The network consists of 10 very low-frequency sensors and one data processing center and uses combined time-of-arrival(TOA) and magnetic-direction-finding(MDF)technologies(Cum-mins et al., 1998). The data from this network were used for the analysis of lightning activity in the thun-derstorms of interest. The WWLLN data were used for real-time target selection to locate centers of elec-trical activity and determine the azimuth of camera pointing.
In addition,the meteorological satellite data of Japan Meteorological Agency(JMA)were downloaded from the JMA website(http://weather.is.kochi-u.ac.jp/archive-e.html)for analysis of cloud charac-teristics every hour at a spatial resolution of 0.05° × 0.05°. Detailed information of the storms was also ob-tained by using the Doppler radar data provided by Sh and ong Meteorological Bureau and Henan Meteo-rological Bureau. Moreover,space weather data have been checked as well on the dates of reported events to rule out the possibility that the observed events were caused by brief illuminations of Charge-Coupled De-vice(CCD)pixels due to impacts of energetic particles from solar events or geomagnetic activity.3. Results and discussion
In this section,we present the analysis of four atmospheric light emission events that were observed in 2007 and 2010. The event in 2007 is examined in Section 3.1 to show that the observed event was not re-lated to aircrafts,satellites,twinkling of stars,or mete-ors,suggesting that the observed spot-like events may likely be unusual atmospheric light emissions. Three more events recorded in 2010 are analyzed in Section 3.2 to demonstrate variability in the morphologies of these events. The possible mechanism associated with this type of spot-like events is investigated and dis-cussed in Section 3.3.3.1 Event on 2 August 2007
A thunderstorm developed to the southwest of the observation site during the late night of 1 August 2007. This storm displayed several features of mesoscale con-vective systems(MCSs),which are known as the most productive thunderstorm systems of sprites. These features include a relatively long lifetime(> 10 h) and a large spatial scale(around 200 km; Yang et al., 2013). Between 2130 BT(Beijing Time)1 and 0143 BT 2 August,16 sprites were recorded above the thun-derstorm(Yang et al., 2008),one of which is shown in Fig. 1a.
 |
| Fig. 1.(a)A columniform sprite observed at 21:30:10 BT 1 August 2007,for which no parental cloud-to-ground(CG)lightning was detected.(b)A spot-like event recorded at 03:34:12 BT 2 August 2007.(c,d)Cloud-top brightnesstemperature on 2 August 2007,with CG lightning within ± 30 min centered at 0300 and 0400 BT in(c) and (d),respectively . The red and white dots in(c) and (d)mark positive and negative CG flashes,respectively . The red linesrepresent the range of the line-of-sight extending from the observation site,i.e.,the field of view of the camera. Thecamera orientation in(c) and (d)was the same. The white lines in(c)denoted as L1 and L2 represent the near and faredges of the thunderstorm.(e) and (f)show the Doppler radar images at the times of interest. |
Approximately 2 h after the last sprite observa-tion on 2 August 2007,an additional triggering event was recorded at 03:34:12 BT(Fig. 1b). Figures 1c and 1d show the cloud-top brightness temperature with cloud-to-ground(CG)lightning within ±30 min cen-tered at 0300 and 0400 BT 2 August 2007,respectively. The red and white dots in Figs. 1c and 1d mark pos-itive and negative CG flashes,respectively. The red lines represent the range of the line-of-sight extending from the observation site,i.e.,the field of view of the camera. The camera orientation in Figs. 1c and 1d was the same. The event appeared as a bright spot that remained visible for nearly 200 ms,as shown by the time sequence images of this event(Fig. 2a).
 |
| Fig. 2.(a)Sequential image fields of the transient luminous event recorded at 03:34:12 BT 2 August 2007,in the regionof interest(ROI)in Fig. 1b. The frame rate is 25 frames s-1,with each frame further separated into even and odd image¯elds at 20-ms time interv als.(b)The center arbitrary brightness of the ROI versus time. |
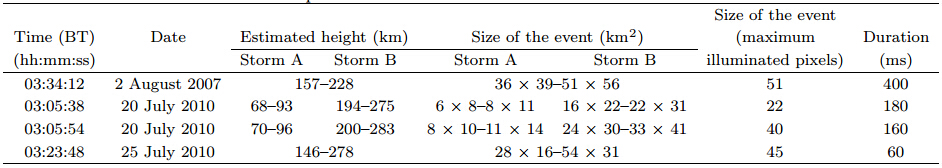
Assuming that the event in Fig. 2 was produced by a thunderstorm in the FOV of the camera,the altitude and dimension of the event could be estimated on the basis of the horizontal distance from the obser-vation site(the camera location)to the thunderstorm edge and camera viewing angle. By using the observa-tion site as a reference point,two horizontal distances from the storm are produced. The first is from the ob-servation site to the near edge of the storm,labeled L1 in Fig. 1c, and the second is to the far edge,labeled as L2 in Fig. 1c. According to this analysis,the altitude and dimension of this event are constrained to 157-228 km and (36 × 39)-(51 × 56)km2,re-spectively,based on the assumption that the spot-like event was produced above the storm. It should be noted,however,that if the event was not related to the storm,the location in the upper part of the image can indicate a very close-range event,which is not very high. The storm developed mainly above open water,according to the infrared satellite images(Figs. 1c and 1d). To obtain additional information,Doppler radar data with a scanning range of 230 km were used to determine storm characteristics,as shown in Figs. 1e and 1f. It can be seen that most of Storm B was out-side of the radar scanning range. Because only a very small part of Storm B was in the camera field view,the possibility of the event produced by this storm was ruled out,as will be discussed at the end of this section. Therefore,Storm B did not significantly af-fect the results. The Doppler radar images show that Storm A at the approximate distance was very weak at the time of the event occurrence,which was respon-sible for the very few lightning flashes in Figs. 1c and 1d. Storm A at 0400 BT was even weaker(figure omit-ted).
The event resulted in one trigger on the imag-ing system,which ruled out the possibility of an air-craft entering the FOV of the camera. Otherwise,the duration of observation would be at least a few sec-onds, and a series of triggers would have been present. Moreover,this event appeared as one bright spot that only remained visible for approximately 200 ms over the 1.26-s span of observation; thus,it did not ap-pear to be a star or a satellite flying in the FOV of the camera. To further rule out the possibility of an Iridium-class satellite,which has a unique property of reflecting surfaces manifested as flickering,observa-tions with the same camera and set-up were conducted for several days. During this period,no thunderstorms were present in the camera view field, and the sky was very clear with some stars clearly visible. During the observation,many videos of airplanes were recorded,the flight directions of which were also clearly visible. However,no similar events were recorded.
Moreover,we ruled out the possibility of a meteor flying parallel to the camera's line of sight because,as shown in Fig. 2,the event appeared in the first four fields(80 ms),then became invisible in the subsequent six fields(Fields 5-10; 120 ms) and appeared again in Fields 11-18. It should be noted that the location of the event in the camera view field did not change during Fields 1-18; a meteor would have been visible in Fields 5-10. The event was not likely blocked by clouds in the camera view field during Fields 5-10 be-cause the arbitrary brightness and size of the event in the camera field did not change substantially,as shown in Fields 2 and 11.
As shown in Figs. 1c and 1d,Storm B is much smaller compared with Storm A. Centered at approx-imately 34°N,123°E,Storm B was partially located inside the FOV of the camera during the observation of this event. It is not likely that the observed event was produced by this storm because otherwise,the event would have appeared near the left edge of the FOV of the camera. 3.2 Events in July 2010
Three additional events with similar features to that examined in Section 3.1 were recorded in July 2010,indicating that the occurrence of the event in 2007 was not accidental,which is true at least in the vicinity of our observation site. The analysis results of two events on 20 July and one event on 25 July,includ-ing the estimated altitude and duration,are shown in Table 1.
The two events occurring on 20 July were likely both over open water, and the event on 25 July was over l and ,provided that the events had relationships with the storms underneath. The altitudes of the events(Figs. 1,3-5)observed in this study were very similar because they appeared in the upper part of the camera view field. The possibility of meteors fly-ing parallel to the line of sight of the camera located at similar altitudes in the view field is very small. Inaddition,Fig. 5 shows that the event developed down-ward in Field 2 and that the lower part of the event resembled a tail,which further rules out the connec-tion of meteors with the observation reported here.
The center arbitrary brightness of the ROI(re-gion of interest)versus time was similar in the four events,as shown in Figs. 2-5. No unusual energetic events were reported on 20 and 25 July 2010. Al-though an energetic electron particle event related to a radiation belt occurred on 2 August 2007,it is nearly impossible for the energetic particles to reach such low altitudes because the electron mass is very small, and the particles reached geosynchronous orbit,which is much higher than 150 km. In addition,the illumina-tion on the CCD caused by energetic particles would be a bright dot and would not flicker. Therefore,the chances of the events being caused by energetic par-ticles are very small. The discussions above indicate that the observations reported here are not associated with aircraft,star,satellite,meteor,or energetic par-ticles; instead,they are likely the manifestation of a new phenomenon. 3.3 Possible mechanism of the observed events
We then attempted to determine whether these events were related to lightning or a thunderstorm. Figures 1c and 1d show the distribution of CG flashes superimposed on Multifunctional Transport Satellite(MTSAT)hourly cloud-top brightness temperature in the early morning of 2 August 2007. The red dots and white dots mark positive and negative CGs,respectively,within 1 h centered at the time shown in the figures. The figures show that few flashes occurred in the camera FOV; the flashes shown were obtained by combining return strokes into one single flash. That is,successive return strokes were considered to be one flash if their time intervals and horizontal distances were smaller than 0.5 s and 10 km,respectively. Con-sidering that the combining algorithm used here may be subject to some uncertainty,the return strokes(not flashes)were superimposed directly on the cloud-top brightness temperature maps(figure omitted). Few return strokes were still detected in the camera FOV.
By meticulously comparing this information with data from the lightning location network,one negative flash was detected 14.32 s prior to the event,although this flash was located in the direction opposite that of the camera orientation,or in the upper left-h and corner of the storm in Figs. 1c and 1d. Therefore,no parent CG was detected for the light emission event at 03:34:12 BT 2 August 2007. The discussions above indicate that the event may have occurred without a distinct relationship with tropospheric lightning activity. Similar analysis was made for the events recorded in July 2010. No return strokes occurred in the camera FOV in these cases either,which further indicates that the event may not have been associated with lightning. However,although both of the local lightning location systems and WWLLN have detection efficiency,the fact that no lightning detected by these two types of lightning location systems was found for the events does not absolutely mean that these events were not related to lightning.
To obtain more information,Doppler radar images with a scanning range of 230 km were used to determine the characteristics of the storms in July 2010. Figure 3c shows that comparatively strong radar echoes of Storm A and weak echoes of Storm B were in the camera view field; the two pink lines in Fig. 3c represent the camera FOV. The negative CG lightning flashes in Fig. 3b were associated with the strong radar reflectivity. For the event on 25 July 2010,Doppler radar images are shown in Figs. 5c and 5d with radar scanning ranges of 230 and 460 km,respectively. The camera FOV is not completely shown in Fig. 5c but is completely shown in Fig. 5d. The radar images show that only a small part of the strong radar echo was in the camera view field and that very few lightning flashes occurred,which may not indicate a strong cor-relation between the recorded events and the lightning activity in the area.
 |
| Fig. 3.(a)The event recorded at 03:05:54 BT 20 July 2010.(b)Cloud-top brightness temperature on 20 July 2010,with cloud-to-ground(CG)lightning within ± 30 min centered at 0300 BT(red dots,white dots, and red lines are thesame as those in Fig. 1c).(c)Doppler radar image of the storm.(d)Center arbitrary brightness of the ROI versus time. |
 |
| Fig. 4.(a)The event recorded at 03:05:38 BT 20 July 2010 and (b)center arbitrary brightness of ROI versus time. |
 |
| Fig. 5.(a)The event recorded at 03:23:48 BT 25 July 2010.(b)Cloud-top brightness temperature on 25 July 2010,with cloud-to-ground(CG)lightning within ± 30 min centered at 0300 BT(red dots,white dots, and red lines are thesame as those in Fig. 1c).(c) and (d)Doppler radar images of the storm.(e)Center arbitrary brightness of the ROIversus time. |
Yair et al.(2005)reported an event known as TIGER with morphology that differed from common TLEs. The TIGER event was almost horizontal in image,while three of the four events in this paper were like a spot and one of the events even had some vertical development. Yair et al.(2005)pointed out that the possible generation mechanism for TIGER may include the conjugated sprite hypothesis caused by light-ning at the magnetic mirror point,lightning-induced electron precipitation, and an extraterrestrial source. Our observations of the spot-like events do not resemble any known class of TLEs found in previous literature,including the TIGER event in Yair et al.(2005). The lightning activity determined by using the WWLLN data and the particle beams in the magnetic conjugate points were also checked for the four events in this paper,although neither phenomenon was de-tected.
Cohen et al.(2010)reported that a beam of relativistic electrons could produce a lightning discharge. Whether the events reported here were atmospheric optical radiation induced by electron beams is an open question that requires further investigation with both coordinated observations and numerical simulations. Because the detection efficiency of WWLLN is not very high,electron beams caused by lightning may not be detected. Moreover,the mechanism in which millisecond-scale electron beams can induce optical emissions of more than ten to hundreds of millisec-onds remains unknown. The events reported here are not linked to thunderstorms or flashes. Therefore,fur-ther observations are desired to accumulate additional cases for revealing the mechanism of this phenomenon. 4. Conclusions
Four unusual atmospheric light emission events were analyzed in this paper. The morphologies of these events differed from any known types of TLEs described in previous literature. Possibilities of these events being aircraft,satellite,stars,or meteors were excluded. A comparison between the observed events and the data from lightning detection networks do not indicate a correlation of these events with CG light-ning in the same region. The events may be a phe-nomenon with an underlying physical mechanism to be revealed with further coordinated lightning and thun-derstorm observations.
Acknowledgment: The first author is grateful to the support provided by Nanjing University of In-formation Science & Technology.
| [1] | Cohen, M. B., U. S. Inan, R. K. Said, et al., 2010: A lightning discharge producing a beam of relativistic electrons into space. Geophys. Res. Lett., 37, doi: 10.1029/2010GL044481. |
| [2] | Cummer, S. A., J. B. Li, F. Han, et al., 2009: Quantification of the troposphere-to-ionosphere charge transfer in a gigantic jet. Nature Geosci., 2, 617-620. |
| [3] | Cummins, K. L., M. J. Murphy, E. A. Bardo, et al., 1998: A combined TOA/MDF technology upgrade of the U. S. National Lightning Detection Network. J. Geophys. Res., 103(D8), 9035-9044. |
| [4] | Franz, R. C., R. J. Nemzek, and J. R. Winckler, 1990: Television image of a large upward electrical discharge above a thunderstorm system. Science, 249, 48-51. |
| [5] | Fukunishi, H., Y. Takahashi, M. Kubota, et al., 1996: Elves: Lightning-induced transient luminous events in the lower ionospohere. Geophys. Res. Lett., 23, 2157-2160. |
| [6] | Ganot, M., Y. Yair, C. Price, et al., 2007: First detection of transient luminous events associated with winter thunderstorms in the eastern Mediterranean. Geophy. Res. Lett., 34, doi: 10.1029/2007GL029258. |
| [7] | Hayakawa, M., T. Nakamura, Y. Hobara, et al., 2004: Observation of sprites over the sea of Japan and conditions for lightning-induced sprites in winter. J. Geophys. Res., 109(A01312), doi: 10.1029/2003JA009905. |
| [8] | Lu, G., S. A. Cummer, J. B. Li, et al., 2013: Coordinated observations of sprites and in-cloud lightning flash structure. J. Geophys. Res., 118, 6607-6632, doi: 10.1002/jgrd.50459. |
| [9] | Lyons, W. A., 1996: Sprite observations above the U. S. High Plains in relation to their parent thunderstorm systems. J. Geophys. Res., 101, 29641-29652. |
| [10] | Lyons, E. R. Williams, S. A. Cummer, et al., 2003: Charac-teristics of sprite-producing positive cloud-to-ground lightning during the 19 July 2000 STEPS mesoscale convective systems. Mon. Wea. Rev., 131, 2417-2427. |
| [11] | Neubert, T., T. H. Allin, E. Blanc, et al., 2005: Coordinated observations of transient luminous events during the EuroSprite 2003 campaign. J. Atmos. Sol.-Terr. Phys., 67, 807-820. |
| [12] | Sentman, D. D., E. M. Wescott, D. L. Osborne, et al., 1995: Preliminary results from the Sprites94 aircraft campaign. 1: Red sprites. Geophy. Res. Lett., 22, 1209-1212. |
| [13] | Soula, S., O. Van der Velde, J. Montanya, et al., 2011: Gigantic jets produced by an isolated tropical thunderstorm near R'union Island. J. Geophys. Res., 116(D19103), doi: 10.1029/2010JD015581. |
| [14] | Su, H. T., R. R. Hsu, A. B. Chen, et al., 2002: Observation of sprites over the Asian continent and over oceans around Taiwan. Geophys. Res. Lett., 29, doi: 10.1029/2001GL013737. |
| [15] | Van der Velde, O. A., W. A. Lyons, T. E. Nelson, et al., 2007: Analysis of the first gigantic jet recorded over continental North America. J. Geophys. Res., 112, doi: 10.1029/2007JD008575. |
| [16] | Wescott, E. M., D. D. Sentman, D. Osborne, et al., 1995: Preliminary results from the Sprites 94 aircraft campaign. 2: Blue jets. Geophys. Res. Lett., 22, 1209-1212. |
| [17] | Wescott, E. M., D. D. Sentman, M. J. Heavner, et al., 1996: Blue starter: Brief upward discharges from an intense Arkansas thunderstorm. Geophys. Res. Lett., 23, 2153-2156. |
| [18] | Wescott, E. M., H. C. Stenbaek-Nielsen, D. D. Sentman, et al., 2001: Triangulation of sprites, associated halos and their possible relation to causative lightning and micrometeors. J. Geophys. Res., 106, 10467-10477. |
| [19] | Yair, Y., C. Price, B. Ziv, et al., 2005: Space shuttle observation of an unusual transient atmospheric emission. Geophy. Res. Lett., 32, doi: 10.1029/2004GL021551. |
| [20] | Yang Jing, Qie Xiushu, Zhang Guangshu, et al., 2008: Red sprites over thunderstorms in the coast of Shandong Province, China. Chinese Sci. Bull., 53, 1079-1086. |
| [21] | Yang Jing, Qie Xiushu, and Feng Guili, 2013: Characteristics of one sprite-producing summer thunderstorm. Atmos. Res., 127, 90-115, doi: 10.1016/j.atmosres.2011.08. 001. |