 2014, Vol. 28
The Chinese Meteorological Society
Article Information
- Tim LI. 2014.
- Recent Advance in Understanding the Dynamics of the Madden-Julian Oscillation
- J. Meteor. Res., 28(1): 1-33
- http://dx.doi.org/10.1007/s13351-014-3087-6
Article History
- Received December 14, 2013;
- in final form January 6, 2014


2 Key Laboratory of Meteorological Disaster and College of Atmospheric Science, Nanjing University ofInformation Science & Technology, Nanjing 210044, China
The Madden-Julian oscillation(MJO; ak a Intraseasonal Oscillation(ISO))is the most prominentmode of intraseasonal variability in the tropics1. Firstidentified by Madden and Julian(1971)using singlestation data from Canton Isl and , MJO is characterized by a zonal wavenumber one structure with a thermal direct vertical cell propagating eastward alongthe equator(Madden and Julian, 1972). Later analyses with satellite, reanalysis, field campaign(suchas Asian Monsoon Experiment, MONEX), and modeldata confirmed the planetary zonal scale of MJO and showed that the oscillation is more broadb and thanthe original 40-50-day period identified by Madden and Julian(1971) and can span a range of 10-90days(Krishnamurti and Subrahmanyam, 1982; Weickmann, 1983; Krishnamurti, 1985; Murakami and Nakazawa, 1985; Weickmann et al. , 1985; Lau and Chan, 1986; Knutson and Weickmann, 1987; Chen and Murakami, 1988; Chen et al. , 1988; Hartmann and Michelsen, 1989; Sperber et al. , 1997; Ding, 2007).
Early studies on the mechanism of MJO suggestthat this oscillation is a Kelvin wave forced by convective heating through the wave-CISK(conditionalinstability of the second kind)mechanism, but the soderived MJO modes prefer the shortest wavelength(Wang, 1988) and the speed of propagation is toofast. The introduction of cumulus friction(Chang, 1977), conditional heating(Lau and Peng, 1987), and the inclusion of the wind-induced surface heat exchange(WISHE)feedback(Emanuel, 1987; Neelin et al. , 1987; Li et al. , 2002)slow down the speed in idealized models. However, climate model simulations stillproduce shorter periods and weaker signals of MJOthan observ ations(Lau and Lau, 1986; Slingo et al. , 1996, 1999; Lin et al. , 2006). Further inclusion of aboundary layer frictional effect(Wang, 1988; Wang and Li, 1994)results in a vertical structure similarto the observed(Hendon and Salby, 1994; Jones and Weare, 1996; Maloney and Hartmann, 1998, Chao and Chen, 1999; Moskowitz and Bretherton, 2000; Sperber, 2003). Studies also pointed out the role ofair-sea interactions(e. g. , Li and Liao, 1996; Flatau et al. , 1997; Hendon and Glick, 1997; Lau and Sui, 1997; Shinoda and Hendon, 1998; Wang and Xie, 1998; Waliser et al. , 1999; Kemball-Cook and Wang, 2001; Fu et al. , 2003; Stephens et al. , 2004; Maloney and Sobel, 2004; Zheng et al. , 2004; Lin et al. , 2011) and multi-scale interactions(e. g. , Nakazawa, 1988; Grabowski, 2001; Majda and Biello, 2004; Moncrieff, 2004; Biello and Majda, 2005; Khouider and Majda, 2006; Biello et al. , 2007)in the MJO.
MJO exhibits pronounced seasonality in its intensity(Madden, 1986), frequency(Hartmann et al. , 1992), and movement(Wang and Rui, 1990a; Wu et al. , 2005). In boreal winter, MJO is dominatedby eastward propagation along the equator, but inboreal summer the eastward propagating mode substantially weakens, whereas northward propagationprevails in the Indian monsoon region(Yasunari, 1979, 1980; Hartmann and Michelsen, 1989; Gadgil and Srinivasan, 1990; Gautier and DiJulio, 1990) and the northwestward propagation prevails over the western North Pacific(WNP)(Murakami, 1980; Lau and Chan, 1986; Knutson and Weickmann, 1987; Nitta, 1987; Chen and Murakami, 1988; Hsu and Weng, 2001; Kemball-Cook and Wang, 2001). Nowadays, MJO mainly refers to oscillations along the equator, while ISO contains a wider range of frequency and includes oscillations propagating along and off the equator(Salby et al. , 1994; Annamalai et al. , 1999; Matthews, 2000; Mo, 2000; Annamalai and Slingo, 2001; Myers and Waliser, 2003; Jones et al. , 2004a, b, c; Lau and Waliser, 2005). In this paper, we will referto both, following the literatures cited.
MJO exhibits a multi-scale characteristic. Nakazawa(1988)showed that MJO is organized byclouds with scales from individual cumulus, mesoscaleconvective systems(MCS), to super cloud clusters(SSC). As it propagates eastward from the IndianOcean(IO)to the western Pacific, MJO interactswith many weather and climate systems(Liebmann et al. , 1994; Mo, 2000; Vecchi and Harrison, 2002; Jones et al. , 2004a, b). The tropical IO and WNP are regions of enhanced MJO variability in boreal summer. These regions, not by coincidence, are also regionswith most active synoptic-scale variability(SSV)including synoptic wave train and tropical cyclone(TC)activity(Lau and Lau, 1990; Liebmann et al. , 1994; Hartmann and Maloney, 2001; Maloney and Dickinson, 2003; Straub and Kiladis, 2003; Batstone et al. , 2005). It is well known that MJO exerts a largescale control on SSV(Hendon and Liebmann, 1994; Maloney and Hartmann, 1998, 2000a, b; Straub and Kiladis, 2003). Some diagnostic studies suggested thatbarotropic energy conversion between the MJO flowfield and higher-frequency eddies was responsible forlatter's growth(Sobel and Maloney, 2000; Hartmann and Maloney, 2001; Maloney and Hartmann, 2001; Maloney and Dickinson, 2003). Maloney and Hartmann(1998, 2000a, b)suggested that MJO westerliesmay set up favorable conditions for TC developmentby inducing cyclonic low-level vorticity and near-zerovertical wind shear. Using wave accumulation as a precondition for TC genesis, Sobel and Maloney(2000)found a relationship between TC genesis and MJO. They concluded that the wave activity convergenceassociated with tropical depression-type disturbancesis stronger during the active phase of MJO.
Compared with the MJO impact on SSV, thesynoptic-scale feedback to MJO has received less attention(Batstone et al. , 2005). While MJO exerts alarge-scale control on SSV, it is not clear how and towhat extent the integrated effect of synoptic-scale(including TC)activity may further feed back to MJO. Krishnamurti et al. (2003)speculated that about30%-50% of the total surface heat flux on the MJOtimescale might come from the interaction of MJOwith other timescales. Biello and Majda(2005), Biello et al. (2007), and Majda and Stechmann(2009)suggested that the synoptic-scale momentum and temperature flux convergences may modulate the large-scaleMJO circulation.
Currently, there is a gap in forecast skill betweenshort-range(less than a week)weather and long-range(monthly or seasonally)climate prediction. MJO isa major predictability source for extended-range(10-30-day)forecast. Accurate prediction of MJO and associated intraseasonal variability in the tropics and extratropics is crucial for bridging the gap. Most ofcurrent operational models, however, have low skillsin predicting MJO(Kim et al. , 2009). It is not clearto what extent this is attributed to shortcomings inmodel physics, or the unpredictable component thatis determined to a large extent by atmospheric chaoticbehaviors(Sperber and Palmer, 1996; Goswami, 1998; Waliser et al. , 2003). Our current knowledge in underst and ing MJO dynamics is limited. Revealing thedynamics of MJO including its propagation and initiation mechanisms will not only adv ance our currentunderst and ing of the tropical low-frequency dynamics but also on a long run improve our capability ofprediction of intraseasonal variations of the global atmosphere and ocean so that the current gap betweenshort-range weather forecast and seasonal climate prediction will be bridged.
This review paper describes what advancementwe have made in recent years in underst and ing MJOdynamics, with a special focus on mechanisms relatedto MJO eastward propagation, planetary zonal scaleselection, seasonality, initiation, and multi-scale interactions. The rest of the paper is organized as follows. In Section 2, the structure and physical processes relev ant to MJO eastward propagation are described. InSection 3, a modeling result related to MJO planetaryscale selection is presented. In Section 4, key processes responsible for the summer-winter contrast inMJO propagation behavior are discussed. In Section5, observed precursor signals and physical processesresponsible for MJO convection initiation in the western IO are described. In Section 6, MJO multi-scaleinteraction processes are discussed. Finally, a summary is given in Section 7. 2. MJO eastward propagation
The most striking feature in term of MJO structure is that it has a horizontal pattern of KelvinRossby wave couplet(Wang and Rui, 1990b; Hendon and Salby, 1994; Wang and Li, 1994) and a verticaltilting in specific humidity and vertical motion fields(Sperber, 2003; Kiladis et al. , 2005). Consistent withthe tilting of vertical motion is the phase leading ofplanetary boundary layer(PBL)convergence with respect to MJO convection(e. g. , Wang and Li, 1994; Maloney and Hartmann, 1998). While the previousstudies have identified the zonal asymmetry of PBLmoisture and convergence, the quantitative examination of causes of the phase leading and its role in eastward propagation remained absent until recently . 2. 1 Observed three-dimensional structure ofMJO
Using the ECMWF reanalysis(ERA-40), Hsu and Li(2012) examined the structure and evolution characteristics of the MJO over the tropical Indian Oceanwestern Pacific warm pool region. Figure 1 illustratesthe composite zonal-vertical distribution of 20-80-dayfiltered moisture field and its phase relationship withthe MJO convection(when it is located in the eastern equatorial Indian Ocean). While in the mid troposphere the maximum moisture anomaly is co-locatedwith the MJO convection, in the PBL there is a clearzonal asymmetry in the perturbation moisture field; that is, a positive(negative)center is located to theeast(west)of the OLR center. Because of this asymmetry, the maximum moisture content line tilts eastward and downward. This moisture tilting feature isconsistent with previous studies(e. g. , Sperber, 2003; Kiladis et al. , 2005).
 |
| Fig. 1. (a)Zonal-vertical distributions averaged over 0° -10° S of 20-80-day filtered specific humidity(contour; 10-4kg kg-1) and specific humidity tendency(shading; 10-10kg kg-1s-1). (b)Zonal distributions along 0° -10° S of20-80-day filtered OLR(blue dashed line; W m-2), OLRtendency(blue solid line; 10-6W m-2s-1), and columnintegrated specific humidity tendency(red line; 10-7kgm-2s-1)during the active phase of MJO in the EIO. FromHsu and Li(2012). |
The circulation anomalies at 200 and 850 hPa associated with the MJO convection over the eastern equatorial Indian Ocean(EIO)are displayed in Fig. 2. It generally shows a baroclinic Rossby-Kelvin wavecouplet structure in response to the MJO heating, similar to that described in Hendon and Salby(1994) and Salby et al. (1994). To the west of the MJO convection, there are two large-scale anticyclonic(cyclonic)Rossby wave gyres in the upper(lower)troposphereon both sides of the equator, accompanied with pronounced easterly(westerly)flows near the equator. Tothe east of the MJO convection, westerly(easterly)flows associated with the Kelvin wave response appear in the upper(lower)troposphere. Both the OLRcenter and the wave couplet structure shift slightly tothe south of the equator, as the seasonal mean precipitation center in the region is primarily confined tothe south of the equator(Li and Wang, 1994a). Thecirculation anomalies at 1000 hPa(figure omitted)ingeneral resemble those at 850 hPa.
 |
| Fig. 2. Composites of 20-80-day filtered OLR(shading; W m-2), geopotential(contour; m2 s-2), and wind fields(vector; m s-1)at(a)200 and (b)850 hPa during the active phase of MJO in the EIO(green boxes). From Hsu and Li(2012). |
The zonal-vertical distributions of MJO circulations show a dominant first baroclinic mode verticalstructure in the zonal and meridional wind fields(Fig. 3). At and to the west of the MJO convection, thewesterly is pronounced in the lower-to-middle troposphere, while the easterly appears above 300 hPa. Themaximum westerly appears around 850 hPa, and thezonal wind tilts westward with height. A similar tilting is found to the east of the MJO convection(Fig. 3a). A northerly(southerly)flow is observed in thevicinity of the MJO convection in the lower(upper)troposphere(Fig. 3b). As shown in the following, this meridional wind plays a role in anomalous moisture advection. While the strongest upward motionappears in the middle troposphere and is in phasewith the OLR minimum center(90° -100° E), at topof the PBL the ascending anomaly tends to prevailto the east of the MJO convection(Fig. 3c). As aresult, the vertical motion associated with MJO alsotilts eastward as height decreases. The asymmetry ofthe vertical motion at top of the PBL is dynamicallyconsistent with the divergence field at the PBL, whichalso reveals a remark able zonal asymmetry with a convergence(divergence)appearing to the east(west)ofthe MJO convection(Fig. 3d).
 |
| Fig. 3. Zonal-vertical distributions averaged along 0° -10° S of 20-80-day filtered(a)zonal wind(m s-1), (b)meridionalwind(m s-1), (c)vertical velocity(Pa s-1), and (d)divergence(10-6s-1)during the MJO active phase in the EIO. The triangles indicate the center of MJO convection. From Hsu and Li(2012). |
To reveal the cause of the moisture asymmetry, a vertical(1000-700 hPa)integrated MJO moisturebudget analysis is performed over the PBL moistening region. The moisture tendency is determined bythe sum of horizontal and vertical moisture advections and the atmospheric apparent moisture sink, Q2(Yanai et al. , 1973).
where q is the specific humidity, t is the time, V is thehorizontal wind vector, ▽ is the horizontal gradientoperator, p is the pressure, ω is the vertical pressurevelocity, Q2 is the atmospheric apparent moisture sink, and L is the latent heat of condensation. Each term inEq. (1)is applied with a 20-80-day filtered operator, averaged from 1000 to 700 hPa. Figure 4 shows thecontribution from each of the moisture budget terms. The largest positive contribution is the vertical moisture advection term. The cause of the positive verticaladvection is primarily due to the advection of the meanmoisture by anomalous ascending motion, the latter ofwhich is associated with the PBL convergence. In addition to the convergence effect, the horizontal moisture advection also contributes to the PBL moistening, although its magnitude is five times smaller than the vertical moisture advection term. The Q2 term tendsto reduce the moistening in the lower troposphere. The negative value of the Q2 term in PBL(1000-700hPa)results from the shallow convection induced pre-cipitation and the reduction of the surface ev aporationahead of MJO convection.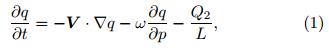
 |
| Fig. 4. PBL(1000-700 hPa)integrated intraseasonalmoisture budget terms over PBL moistening region(0° -10° S, 130° -150° E). From left to right: observed specifichumidity tendency, horizontal moisture advection, verticalmoisture advection, latent heating, and sum of the advection and heating terms. Unit is 10-7kg m-2s-1. FromHsu and Li(2012). |
The leading term in the MJO moisture advectionis the advection of the mean moisture by the MJOflow. The second leading term in the moisture advection is the anomalous moisture advection by the mean flow. 2. 3 Mechanism for the eastward propagation
Figure 1 illustrates that while the midtropospheric moisture anomaly is approximately inphase with the MJO convection, there is a clear zonalasymmetry in the PBL moisture field. A positive(negative)specific humidity center is located to the east(west)of the OLR center.
To demonstrate how the PBL moisture asymmetry affects the MJO growth and evolution via atmospheric destabilization, the vertical profile of the intraseasonal equiv alent potential temperature was examined. The equiv alent potential temperature depends on both the specific humidity and temperatureprofiles of actual atmosphere. If a layer of air massis initially moist but unsaturated and within the layer  < 0, we call the layer of the atmosphere being potentially(or convectively)unstable. If such alayer is brought to saturation by suffcient lifting, thewhole layer becomes actually unstable(Holton, 1992; Emanuel, 1994). The occurrence of deep convection(such as thunderstorm)is often preceded by a periodwhen the atmosphere is potentially unstable(Houze, 1993).
It is noted that a significant increase of low-levelequiv alent potential temperature occurs, consistentlywith PBL moistening to the east of the MJO convection. If defining a convective instability parameter asthe difference of equiv alent potential temperature between the PBL(850-1000 hPa) and the mid troposphere(400-500 hPa), one may find that the atmosphere is more(less)potentially unstable to the east(west)of the MJO convective center. Therefore, aphase leading of a positive low-level moisture anomalymay set up a relatively unstable stratification and generate a favorable environment for potential development of new convection to the east of the MJO center.
The westward tilting of moisture with height tothe east of the convection implies that for an observerat a fixed location, the moisture precursor signal firstappears at the low level, and then moves upward. This is consistent with the fact that shallow convection and cumulus congestus clouds appear prior toMJO deep convection(Johnson et al. , 1999; Kikuchi and T ak ayabu, 2004; Benedict and R and all, 2007). The shallow convection transports moisture upwardto moisten the mid troposphere, leading to the onsetof deep convection. 2. 4 Processesresp onsible for phase leading ofPBLc onvergence
The moisture budget diagnosis above shows thata dominant moistening process in the PBL is the vertical advection of mean moisture by anomalous ascending motion. Since the anomalous ascending motion isrelated to PBL convergence, a key question becomeswhat causes the phase leading of the PBL moistureahead of the MJO convection?
Figure 5 is a schematic diagram illustrating keyprocesses that contribute to the phase leading ofthe boundary-layer convergence. Firstly, the midtropospheric heating associated with MJO deep convection induces a baroclinic free-atmosphere response, with a Kelvin(Rossby)wave response to the east(west)of the convective center. The anomalous lowpressure at top of the PBL associated with the Kelvinwave response may induce a convergent flow in theboundary layer, while a PBL divergence may occur tothe west of the convective center between two Rossbywave gyres. Thus, the first convergence-generationprocess is associated with the mid-tropospheric heating and equatorial wave responses to the heating. Thesecond generation process is associated with the SST Aforcing. As a warm SST A is generated to the eastof the MJO convection, the warm SST A may driveboundary layer flows through induced hydrostatic effect on sea level pressure(Lindzen and Nigam, 1987). Therefore, the convergence in the atmospheric boundary layer may be connected to the underlying positiveSST anomaly and associated SST A gradients to theeast of the MJO convection.
 |
| Fig. 5. Schematic diagram illustrating how the boundarylayer convergence is controlled by free-atmospheric heating induced wave response and a warm SST anomaly induced by air-sea interaction. Cloud st and s for the MJOconvection. Solid(dashed)gyres with HK(LK) and HR(LR)indicate the high(low)pressure anomaly associatedwith Kelvin and Rossby wave response to the convection, bottom shadings denote the positive and negative SSTanomalies respectively, solid arrows indicate the anomalousascending motion, dashed arrows represent the boundarylayer convergence, and ps and pe are pressure levels at thebottom and top of the PBL respectively . From Hsu and Li(2012). |
To examine quantitatively the relative roles of theSST A gradient induced pressure gradient force and the heating induced free-atmospheric wave dynamics in determining the PBL convergence, we diagnosethe boundary-layer momentum budget equation developed by Wang and Li(1993). The PBL momentumequation(2. 21)in Wang and Li(1993)states
where a prime denotes the MJO-scale variable, fis the Coriolis parameter, k is the unit vector in thevertical direction, V Bdenotes the vertically averagedhorizontal wind in the boundary layer, ▽ is the horizontal gradient operator, Φe denotes the geopotentialat the top of the boundary layer, R is the gas constantof air, ps and peare pressures at the bottom and top ofthe PBL, respectively, Ts is the surface temperature, and E is the friction coeffcient and is equal to 10-5 s-1. The first term on the right h and side of Eq. (2)represents the free-atmospheric wave effect. The second term on the right h and side of Eq. (2)representsthe SST A forcing effect. To test the sensitivity of theresult to the boundary layer depth, two different PBLdepths, 1000-850 hPa and 1000-700 hPa, are applied.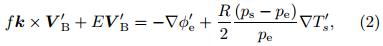
The diagnosis of each term in Eq. (2)usingthe ERA40 reanalysis data shows that the free atmospheric wave effect in response to the MJO heatingplays a major role in determining the boundary-layerconvergence. It accounts for 90% and 75% of the total boundary layer convergence in the case of pe= 850 and pe= 700, respectively . The warm SST anomalyinduced by decreased latent heat flux(LHF)aheadof MJO convection, on the other h and , also plays arole. It contributes about 10%-25% to the observedboundary layer convergence. Since the PBL convergence is a major factor affecting the moisture asymmetry, the result above suggests that both the heatinginduced equatorial wave response and the underlyingSST A contribute to the eastward propagation of MJO. 2. 5 Discussion
Based on the diagnosis of an atmospheric generalcirculation model, Maloney(2009)(hereafter M09)found that the horizontal advection dominates the positive tendency of column-integrated moist statistic energy(MSE)ahead of the MJO precipitation. However, the positive MSE tendency induced by the horizontal moisture advection is to a large extent offsetby the surface LHF. Furthermore, the MSE or moisture budget analysis performed in M09 was based onthe vertical integration in atmospheric column. However, as shown in Hsu and Li(2012), the columnintegrated moisture tendency primarily reflects themoisture change in the middle troposphere, which isapproximately symmetry to the convection. In thiscase, mid-tropospheric perturbation moisture cannotcause the eastward propagation. Given that the major asymmetry occurs in the PBL moisture field and that the PBL moistening occurs prior to the midtropospheric moistening, it is conceiv able that thePBL moisture asymmetry is critical for preconditioning of subsequent development of atmospheric convection.
M09 also pointed out that a weakening of transient eddy moisture transport is a major contributorof moistening ahead of the MJO precipitation center. However, this model result is not supported by theobserv ational analysis of Hsu and Li(2012). In a theoretical work by Sobel and Maloney(2013), a verti-cally integrated moist static energy quantity was used, which neglected the effect of vertically tilted moisture structure. They emphasized the role of horizontal moisture advection(including eddy moisture transport)in the eastward propagation. As one can seefrom Fig. 4, horizontal advection does play a role. However, its magnitude is much smaller than the vertical advection. Some argued that the vertical advection should not be counted because it partially cancelsout with the diabatic term. Such an argument is unphysical, because both the horizontal and vertical advection terms are adiabatic processes and they shouldbe treated equally .
The critical role of the vertical advection in causing the moisture asymmetry and the eastward propagation can be clearly demonstrated from an aquaplanet simulation(with use of MRI AGCM)under aspecified zonally uniform SST distribution. In a control simulation, MJO-like variability is reproduced ina world with pronounced background easterly flowsat the equator. A diagnosis of the model outputshows that PBL specific humidity leads to the MJOconvection as it propagates eastward. A further diagnosis of the PBL moisture budget shows that themoisture leading is attributed to the vertical advection associated with PBL convergence. The horizontalmoisture advection contributes negatively to the MJOpropagation as the mean flows advect the perturbation moisture westward. The aqua-planet simulationclearly demonstrates the critical role of the verticalmoisture advection( and associated anomalous PBLconvergence)in causing the eastward propagation ofMJO.
To demonstrate the importance of the moistureasymmetry, we carried out a sensitivity experimentusing the aqua-planet model in which we force themodel specific humidity toward a zonal mean background moisture field while allowing the divergencebeing asymmetric. The sensitivity experiment resultshows that the MJO-like variability disappears in thisidealized setting. This indicates that the moistureasymmetry, not the convergence asymmetry, is critical for MJO propagation.
The sensitivity experiment above and the observational study of Hsu and Li(2012)emphasized importance of zonal asymmetry of the perturbation moisture. One may wonder why the eastward propagation of MJO existed in the 2. 5-layer model of Li and Wang(1994a)in which a perturbation moisture fieldwas not considered(in the model only the backgroundmean specific humidity was specified). We believethat the eastward propagation in the model is attributed to an idealized convective heating scheme. Inthe model the heating is proportional to vertically integrated moisture convergence, which consists of thelower-tropospheric moisture convergence and the PBLmoisture convergence. The former is in phase withthe MJO convection and primarily responsible for reducing the atmospheric stratification. The latter leadsthe MJO convection and thus is responsible for boththe propagation and growth of the low-frequency perturbation. Given that a parameterized heating alwaysappears to the east of the MJO convection, such aheating would drag the system eastward. 3. MJO planetary-scale selection
An outst and ing question for MJO is why theoscillation prefers a planetary zonal scale. Therehave been a number of theoretical studies aimed ataddressing this scale selection issue. Chang(1977)proposed that the MJO can be represented by convectively driven equatorial Kelvin waves. However, the wave-CISK mechanism prefers the most unstablegrowth at a shorter zonal wavelength. Lau and Peng(1987) and Chang and Lim(1988)demonstrated innumerical models that the Kelvin wave with a zonalwavenumber-1 structure is selectively amplified whena positive-only condensational heating is applied. Using a linear 2. 5-layer model that consists of a two-levelfree atmosphere and a well mixed PBL, Wang(1988)showed that the instability of MJO may arise fromthe boundary layer friction-induced moisture convergence. A preferred planetary zonal wavelength maybe derived when a low-frequency(40-50-day)periodis specified. This did not solve the scale selectionproblem because the temporal and spatial scales arerelated. Goswami and Rao(1994)presented a mechanism for selective excitation of the equatorial Kelvinwave at the period of 30-50 days when a time lag be-tween the convection and the heating is assumed.
While many numerical studies pointed out the importance of the nonlinear positive-only heating in theMJO scale selection, it is not clear how the nonlinearheating leads to the planetary scale selection. Thismotivates us to address this issue in the current study .
The model used in this study is the 2. 5-layer atmosphere model of Li and Wang(1994a) and Wang and Li(1994). The governing equations may be written as:
where V and VBdenote the lower-tropospheric and boundary-layer winds, Φ denotes the lowertropospheric geopotential height, f, C0, and E are theCoriolis parameter, first-baroclinic mode gravity wavespeed, and Ekman frictional coeffcient, and I and Bare convective heating coeffcients contributed by thewave convergence and boundary layer frictional convergence, respectively(Wang, 1988). The condensational heating rate in the middletroposphere is proportional to the vertically integratedmoisture convergence, where ff is a SST-dependent conditional heating coeffcient(Wang and Li, 1993); q1, q2, and qedenotethe mean specific humidity field in the upper troposphere, lower troposphere, and PBL, respectively; thebackground humidity field is the function of the surface humidity and decays exponentially with height(Wang, 1988);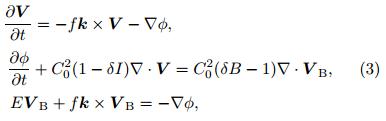
 and
and  are the MJO-scale verticalvelocities in the middle troposphere and at the topof PBL, respectively . The model covers a domain of(40° S-40° N, 0° -360° )with a horizontal resolution of5° longitude by 2° latitude. A constant SSTof 29is specified, and the heating is separated into a nonlinear and linear heating. For the nonlinear heating(i. e. , conditional positive-only heating), ff is unity atthe vertically integrated moisture convergence region and zero at the vertically integrated moisture divergence region.
 The role of the nonlinear heating on MJO scaleselection is revealed by conducting two sets of numerical simulations from the two- and -half layer model. Inthe first set of experiments, a linear heating( )isspecified. In the second set, a nonlinear, positive-onlyheating is specified. For each set of experiments, 15runs are conducted, each of which has the same initialKelvin wave structure but a different zonal wavenumber of 1, 2, . . . , and 15, respectively . Each initial perturbation has the same amplitude and the same first baroclinic mode vertical structure. 3. 1 Simulations with a line ar heating
As predicted from a linear eigenvalue analysis, thenumerical simulations from the first set of experimentsshow the exponential growth of the MJO perturbationas it propagates eastward along the equator. For thelinear heating case, the model is integrated for fivedays. Because different wave components do not interfere with each other in a linear system, the perturbation keeps its initial wavenumber. Since the evolution and propagation of the perturbations bear similarfeatures for all wavenumbers, only the model simulation from the initial wavenumber 5 perturbation caseis shown. Figure 6a shows the time evolution of thelower tropospheric zonal wind along the equator. Theperturbation moves eastward and grows while keeping the initial wavenumber 5 structure. There is no generation of the planetary zonal scale perturbation.
 |
| Fig. 6. Time-longitude cross-section of the equatorialzonal winds from the 2. 5-layer model under the(a)linear and (b)nonlinear heating. An initial wavenumber 5 perturbation is specified. In(a), the contour interv al is 1 ms-1, with solid and dashed contours denoting the westerly and easterly, respectively . In(b), the contour interv al is 5m s-1 and the shading corresponds to the westerly wind. F rom Li and Zhou(2009). |
To calculate the growth rate for each wavenumber, a F ourier decomposition is applied to the modelzonal wind field. Note that the perturbation alwaysretains its initial wavenumber under the linear heating. Although all initial perturbations grow underthe linear heating, the growth rates at different zonalwavenumbers are different. The growth rate at eachwavenumber is calculated based on the time seriesof the F ourier coeffcient of the corresponding zonalwavenumber. Figure 7a shows the dependence of thegrowth rate on the wavenumber. Note that the maximum growth rate appears at wavenumber 6. Weakergrowth rates in higher wave number were attributedto use of diffusion terms in the model, which suppress mostly short wavelength perturbations. The numerical result indicates that the most unstable mode doesnot appear in the planetary zonal scale under the linear heating. 3. 2 Simulations with a nonlinear heating
For the nonlinear, positive-only heating experiments, 15 runs with initial wavenumbers from 1 to 15have been carried out, and for each run the model isintegrated for 30 days. Figure 6b shows the simulatedzonal wind field at the equator for the initial wavenumber 5 case. During the first 10 days, the perturbation remains the initial wavenumber 5 structure, whilepropagating eastward along the equator. After this adjustment period, the amplitude of the wavenumber 5perturbation decays, while a wavenumber-1 perturbation starts to develop. By day 20, the equatorial zonalwind field is dominated by the planetary zonal scale.
The experiments with other initial wavenumbersshow a similar result, this is, no matter what initialzonal wavenumbers are given, the nonlinear heatingleads to a planetary zonal scale selection at the finalstage. Figure 6b shows the growth rates at each runwith different initial wave numbers. The wavenumber1 perturbation grows fastest, indicating a planetaryscale selection. The horizontal structure of the mostunstable mode has a Kelvin-Rossby wave couplet pattern, similar to the observed(e. g. , Hendon and Salby, 1994). The propagation speed of the couplet is slightlyfaster than the observed. The time to circulate aroundthe globe is around 30-50 days, indicating the intraseasonal periodicity of the mode.
An additional experiment is carried out in whichall the 15 wavenumbers with equal strength are input initially under the nonlinear heating. The evolution of the model zonal wind(figure omitted)shows afaster growing wavenumber-one component comparedto that in Fig. 7b. For example, at day 30, the amplitude of the zonal wind is about 6 times greater. Thisexperiment again demonstrates that given the equalstrength wavenumbers 1-15 initially, the model favorsthe most unstable growth of the planetary zonal scale.
 |
| Fig. 7. Growth rates as a function of wavenumber derivedfrom the 2. 5-layer model simulations under the(a)linear(from Li and Zhou(2009)) and (b)non-linear heating. |
How does the nonlinear heating cause the planetary scale selection? Figure 8 is a schematic diagramillustrating how the scale selection process happens in the model. It is primarily attributed to the distinctive phase speeds between the dry Kelvin wave and the moist Kelvin-Rossby wave couplet under the nonlinear heating. According to Gill(1980), convectiveheating at the equator may excite eastward-travelingKelvin waves to its east. In the presence of the linearheating(i. e. , ), the phase speed of the equatorial Kelvin waves, which is proportional to  (Wang, 1988), remains the same for both the dry(suppressed convective) and wet(enhanced convective)regions. As a result, the dry and moist Kelvin wavespropagate at the same speed so that dry and wet regions do not interfere with each other, no matter whatthe initial zonal wavenumber is. In the presence ofthe nonlinear, positive-only heating, the phase speedsof the dry Kelvin wave and the moist Kelvin-Rossbywave couplet are different since ff takes different values in the dry and wet regions. The phase speed ofthe dry Kelvin waves associated with descending motion(where δ = 0)is much larger than that of the wetKelvin-Rossby wave couplet associated with ascendingmotion(or low-level convergence where δ = 1)(Wang and Li, 1994). Therefore, dry Kelvin waves, once excited by one convective branch, may "catch up" and suppress another convective branch to its east, as longas the zonal distance between the two neighboring convective branches is less than a critical distance.
 |
| Fig. 8. Schematic diagram illustrating the role of the nonlinear heating in the MJO planetary zonal scale selection. From Li and Zhou(2009). |
This critical distance measures how far a dryKelvin wave may propagate away from a forcing region under a realistic atmospheric dissipation/friction. According to Gill(1980), a maximum impact distancefor the Kelvin waves depends on the phase speed ofthe dry Kelvin wave(50 m s-1)divided by a Rayleighfriction/Newtonian damping coeffcient. With a realistic dissipation coeffcient, Gill(1980)showed a criticaldistance of about 160 longitude degrees. This impliesthat for perturbations with a wavelength shorter thanthe critical distance, the fast dry Kelvin wave may interfere and suppress the wet Kelvin-Rossby wave couplet convective branch ahead of it. Through this special "scale selection" process, shortwave perturbationsare dissipated or "cut-off", while the planetary scaleperturbations grow. 4. Winter-summer contrast in MJO propagation
The MJO exhibits distinctive propagation characteristics between boreal summer and winter(Wang and Rui, 1990a; Madden and Julian, 1994). WhileMJO in boreal winter is characterized by eastwardpropagation with maximum amplitude shifting slightlysouth of equator(Hendon and Salby, 1994; Maloney and Hartmann, 1998; Sperber, 2003; Kiladis et al. , 2005; Hsu and Li, 2012), major convective branchesassociated with the MJO in boreal summer have anorthward bifurcation over eastern IO before reachingthe maritime continent(Lawrence and Webster, 2002; Jiang et al. , 2004). Figure 9 shows the st and ard deviation of 20-80-day filtered rainfall anomalies and MJOpropagation vectors in boreal winter and summer. Here, the propagation vectors are calculated based onthe lead-lag correlation maps of localized intraseasonalrainfall centers. F ocusing on strong MJO variance regions, one can see that major convective branches associated with MJO in northern winter are confined southof the equator and propagate eastward, whereas majorconvective activity associated with MJO in northernsummer is confined north of the equator and propagate northward in northern IO and northwestward inWNP.
 |
| Fig. 9. The st and ard deviation of 20-80-day filteredCMAP rainfall anomalies(shaded)during 1979-1998 and propagation vectors for boreal(a)summer(May-October) and (b)winter(December-April). |
To examine how the maritime continent(MC)contributes to the MJO northward bifurcation, Zhu ea al. (2010)
conducted a set of idealized ECHAM5T159 experiments. In the control experiment(CTL), the model is integrated for 11 yr with realistic l and -seamask. To examine the role of the MC on the MJO, a sensitivity experiment was designed in which themodel setup was kept the same as CTL except that theMC l and (10° S-10° N, 90° -160° E)was replaced by theocean. SST in the original maritime continent grid isinterpolated from the surrounding ocean points. Thissimulation is referred to as the no-maritime continent experiment(NOMC).
To focus on the northward propagation in themonsoon sector, Zhu et al. (2010)conducted a meridional wavenumber-frequency analysis between 10° S and 30° N, averaged for 10 boreal summers(from Mayto October)over the longitudinal domain of 65° -160° E. Figure 10 shows the wavenumber-frequencyspectrum for the meridional propagating MJO modesbased on the rain rate fields in the CMAP observ ation, CTL, and NOMC, respectively . In CTL, thenorthward-propagating ISO variance is considerablylarger than that of the southward-propagating mode. The maximum spectrum appears at the period of 30-50 day and the wavelength of 4000 km. The corresponding northward phase propagation speed is about1. 2 m s-1. The model simulation is consistent withthe observation(Fig. 10a). Although a little weakerin MC, the gross pattern of MJO spectrum in NOMCis quite similar to that in CTL, implying that the existence of the maritime continent is not critical fornorthward bifurcation of MJO convection in borealsummer.
 |
| Fig. 10. The wavenumber-frequency spectrums for themeridional propagation mode averaged along 65° -160° E, calculated based on the rain rate fields from the(a)CMAPobservation, (b)CTL, and (c)NOMC experiments, respectively . The contour interv al is 2. 0(mm day-1)2 . |
It is hypothesized that a key to the northwardbifurcation of MJO convection in northern summerlies in the equatorial asymmetry of a thermal equator in the MC longitudes. In other words, it is themean state asymmetry that controls MJO propagation. As we know, maximum mean ascending branchof local Hadley circulation lies over the warmest water at 15° N in northern summer(where the monsoontrough locates), while the descending branch of the local Hadley Cell appears at and south of the equator. This is in a great contrast to northern winter when themaximum convective branch of the local Hadley Cellappears at and slightly south of the equator. Sucha mean state difference reflects clearly in PBL divergence and rainfall fields(Fig. 11).
 |
| Fig. 11. Northern winter(DJF; a, b) and summer(JJA; c, d)mean PBL(averaged from 1000 to 850 hPa)divergence(×10-6s-1)(a, c; derived from ERA40 reanalysis) and mean precipitation(b, d; derived from CMAP)fields. |
How does the mean state affect the MJO propagation? Consider MJO as a convectively coupled KelvinRossby wave couplet. In boreal winter, because maximum mean ascending motion and moisture are nearthe equator(within one Rossby radius of deformation), atmospheric moist Kelvin waves are unstable and growfaster than Rossby waves. As a result, Kelvin waves dominate and MJO convection is confined near the equator. In boreal summer, because maximum meanascending motion and moisture are located more thanone Rossby radius of deformation away from the equator, atmospheric moist Kelvin waves stabilize due tothe mean descending motion near the equator whileRossby waves become unstable. The suppressed convection near the equator causes the Kevin-Rossbywave couplet decoupled, and Rossby waves are emanated from the wave packet. Maximum convectionappears off the equator, co-locating with Rossby gyres.
To demonstrate the mean flow effect, an eigenvalue analysis with use of the 2. 5-layer model(shownin Eq. (3))was conducted. For simplicity, atmosphericintraseasonal heating is assumed to be proportional toPBL moisture convergence, that is,
where nonlinear heating coeffcient ff is set to be 1 where the background SST is greater than 27 and there is background PBL convergence, and to be 0 otherwise. The background surface air specific humidityin the model is determined from the SST according toan empirical formula shown in Li and Wang(1994b).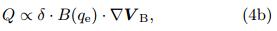
Figures 12a and 12b show the meridional distribution of specified background SST in boreal winter and summer. For simplicity, the boreal winter SST isassumed to be symmetric about the equator, while theboreal summer SST has a maximum amplitude rightat one Rossby radius of deformation(non-dimensional y = 1). The influence of the mean flow convergenceon the heating is not considered in the idealized SSTdistribution cases. Figures 12c-f show the eigenvalueanalysis result. It is interesting to note that the equatorially asymmetric summer mean state leads to thedecay of equatorial Kelvin waves but the growth ofRossby waves, whereas the equatorially symmetricwinter mean state favors the growth of the Kelvinwaves but the decay of Rossby waves.
 |
| Fig. 12. Idealized background meridional SST distributions as a function of non-dimensional y in boreal(a)winter and (b)summer specified in a theoretic 2. 5-layer model. Background surface air specific humidity iscalculated based on the SST according to Li and Wang(1994b). Also shown are(c, d)non-dimensional frequency and (e, f)non-dimensional growth rate as a function ofnon-dimensional zonal wavenumber derived from the 2. 5-layer model for boreal(c, e)winter and (d, f)summer. |
Figures 13c and 13d illustrate the nondimensional growth rate of the equatorial Kelvin and Rossby waves in the presence of realistic PBL moisture and divergence distributions averaged over theMC longitudes(shown in Figs. 13a and 13b). Similar to the above idealized cases, the equatorial Kelvinwaves are unstable under the boreal winter mean state while the Rossby waves become unstable under the boreal summer mean state. The theoretical model resultsprove the hypothesis that the marked northward shiftof the thermal equator in northern summer is essentialfor the meridional bifurcation of MJO convection offSumatra.
In addition to the northward shift of the thermal equator, the background easterly shear and meridionalmoisture distributions also contribute to the northward propagation of MJO convection in boreal summer over northern Indian Ocean and South China Sea(Jiang et al. , 2004). The northward propagation c and irectly affect rainfall variability over the monsoon regions. In addition, MJO heating over the WNP and Indian monsoon regions can remotely affect midlatitudes through teleconnection(Kawamura et al. , 1996; Ding and Wang, 2007; Pan and Li, 2008; Wang et al. , 2013).
 |
| Fig. 13. Observed background(a)specific humidity(g kg-1)at 900 hPa and (b)PBL divergence(×10-6)fields averaged over 110° -140° E in boreal winter(the curvewith dots) and summer(the curve with circles). Nondimensional growth rate as a function of non-dimensionalzonal wavenumber in the presence of the observed meridional distributions of background SST, specific humidity, and PBL divergence in boreal(c)winter and (d)summer. |
An open question regarding its life cycle is howMJO is initiated over the western equatorial IndianOcean(WIO). A widely accepted hypothesis is thatMJO convection initiation arises from the circumnavigation of a preceding MJO event that travels aroundthe global tropics(e. g. , Lau and Peng, 1987; Wang and Li, 1994; Matthews, 2000, 2008; Seo and Kim, 2003). The promise behind the circumnavigating hypothesis is that the eastward-propagating MJO wavemay trigger deep convection over moist and warm Indian Ocean after it passes the African continent, with possible topographic lifting effect(Hsu and Lee, 2005). In this scenario, the forcing from the upstream(westof the initiation region)holds a key for triggering newconvection over the WIO. As demonstrated by Zhao etal. (2013), this circumnavigating process is not crucialfor the initiation of most MJO events.
In addition to tropical forcing processes, MJOconvection may be triggered by extratropical or midlatitude processes. For example, case studies by Hsu et al. al. (1990) and Ray et al. (2009)suggested thatthe midlatitude perturbations may propagate into thetropics and trigger MJO initiation over the WIO. However, large samples are needed in order to derive statistically robust signals. 5. 1 Observed precursor signals associated withMJO initiation
Using 20-yr(1982-2001)observed OLR and ERA40 reanalysis data, Zhao et al. (2013)examinedprecursor signals associated with MJO convection initiation over the WIO. Figure 14 illustrates the composite evolution of OLR from day -9 to day 0 at a3-day interv al. Day 0 is referred to a time when MJOconvection appears in the central equatorial IO. TheOLR evolution maps reveal that the MJO convectionwas firstly initiated in the southwestern Indian Ocean, and then it propagates eastward. During its eastwardjourney, the convection is strengthened and shifts moretoward the equator.
 |
| Fig. 14. Evolution of the composite OLR(W m-2)pattern from day -9 to day 0 at a 3-day interv al. The negative OLR represents enhanced MJO convection. Day 0corresponds to a time when maximum MJO convectionis located in the eastern equatorial IO. From Zhao et al. (2013). |
Based on the composite OLR evolution maps, theregion of(20° S-0° N, 50° -70° E)is defined as the MJOconvection initiation region. To reveal precursor signals associated with the convection initiation, Zhao et al. (2013)examined the time evolution of severalkey variables averaged over the region. Figure 15apresents the time evolution of the intraseasonal(20-90-day)OLR anomaly averaged over the initiation region. Note that the OLR anomaly transitions froma positive to a negative value at day -15. Consistentwith the OLR transition is the switch of sign of themid-tropospheric vertical motion, from an anomalousdescending motion to an anomalous ascending motion(Fig. 15b). Thus, day -15 is regarded as the initiationdate.
 |
| Fig. 15. Evolutions of(a)the composite intraseasonal OLR anomaly(W m-2) and (b-f)vertical profiles of intraseasonalvertical velocity(w; 10¡3Pa s-1), specific humidity(q; g kg-1), temperature(T ; K), equiv alent potential temperature(µe; K), and moist static energy(MSE; K J kg-1)fields averaged over the MJO initiation region(20° S-0° N, 50° -70° E). |
It is interesting to note that 7 days prior tothe initiation date, a marked sign change of the specific humidity and temperature fields appears in thelower troposphere(Figs. 15c and 15d), that is, thelower-tropospheric specific humidity and temperatureanomalies transition from a negative value to a positive value one week prior to the initiation date. Thespecific humidity perturbation is initially confined atlow level and gradually penetrates into the middle troposphere. At day -15, the positive moisture anomalyhas extended up to 500 hPa. The temperature perturbation, on the other h and , is primarily confined below 700 hPa till day -8.
The marked increase of both the lowertropospheric specific humidity and temperature leadsto an increase of equiv alent potential temperature(θe) and moist static energy(MSE)in the lower troposphere, as shown in Figs. 15e and 15f. The verticaltime cross-section of θeshows that about one weekprior to the initiation date, a positive θeperturbationappears in the lower troposphere. This positive perturbation intensifies rapidly while extending upward, closely following the specific humidity evolution.
The observ ational data analysis above indicatesthat lower-tropospheric moistening and warming priorto the convection initiation is crucial for the establishment of a convectively more unstable stratification. What physical processes contribute to the lowertropospheric moistening and warming? To addressthis question, a vertically integrated(1000-700 hPa)intraseasonal moisture budget is diagnosed.
Figure 16 shows the moisture budget diagnosisresult. It is clear that the positive moisture tendencyduring the initiation period(from day -25 to -15)ismainly attributed to the horizontal advection, whilethe vertical advection(due to subsidence and associ-ated divergence)is against the lower-troposphericmoistening. The result indicates that the lowertropospheric moistening process during the MJO initiation is very different from that during its eastward propagation phase. In the latter case the lowertropospheric moistening is primarily attributed to thevertical advection associated with PBL convergence(Hsu and Li, 2012).
 |
| Fig. 16. (a)1000-700 hPa integrated intraseasonal moisture budget terms averaged during the period of day -25 to day-15 over 20° S-0° N, 50° -70° E. From left to right: observed specific humidity tendency, horizontal moisture advection, vertical moisture advection, apparent moisture source, and sum of the last three terms. (b)Individual components ofthe horizontal moisture advection term. From Zhao et al. (2013). |
The apparent moisture source term(-Q2=L)playsa minor but positive role in the low-troposphericmoistening. This is because anomalous descendingmotion during the initiation period reduces the meanprecipitation, leading to less condensational heating and thus more moisture retained in the atmosphere. The surface latent heat flux anomaly, on the otherh and , does not contribute to the moistening duringthe initiation period(figure omitted).
To examine specific horizontal advection processes that contribute to the lower-tropospheric moistening, both the specific humidity and wind fields aredecomposed into three components, the low-frequencybackground state(LFBS; with a period longer than 90days), the intraseasonal(20-90-day)component, and the high-frequency(with a period less than 20 days)component. Figure 16b shows the contributions fromeach of nine horizontal advection terms. The largestterm comes from the advection of the mean moistureby the MJO flow. The second largest term is the advection of anomalous moisture by the LFBS flow.
Figure 17a presents the horizontal patterns of theLFBS specific humidity field and the MJO wind perturbation field. Both the background specific humidity and anomalous wind fields were derived based on thetime average from day -25 to -15 and vertical integration from 1000 to 700 hPa. The maximum LFBSspecific humidity is located along 10° S, where the seasonal mean convection is also strongest. Note that the MJO flow during the initiation period is dominatedby anomalous easterlies and two anticyclonic Rossbygyres over the tropical Indian Ocean. Such a windanomaly resembles the Gill(1980)pattern and is typically observed when the suppressed MJO convectionis located in the EIO. A further examination of the intraseasonal OLR field confirms that a maximum positive OLR center associated with MJO is indeed located over the EIO during the period. The anomalouswinds advect the background high moisture in such away that they increases the lower-tropospheric moisture over the initiation region(20° S-0° N, 50° -70° E).
 |
| Fig. 17. Vertically integrated(1000-700 hPa)intraseasonal wind(vector; m s-1) and LFBS specific humidity(shading; g kg-1)fields averaged during the initiation period(day -25 to -15). From Zhao et al. (2013). |
The moisture budget analysis above reveals thatthe low-tropospheric moistening prior to the MJO initiation is primarily attributed to the anomalous easterly wind over the equatorial Indian Ocean. Whatcauses the anomalous wind? There are two possiblesources in generating the anomalous wind. Firstly, the anomalous easterlies may be a direct Kelvin waveresponse to a positive MJO heating over western Pacific(see a schematic diagram in Fig. 18a). This ispossible as the preceding MJO convection travels eastward along the equator after initiated over the WIO. This represents an upstream forcing of the circumnavigating MJO mode. Secondly, the anomalous windover the tropical Indian Ocean may be a direct Rossbywave response to a negative MJO heating over the EIO(see a schematic diagram in Fig. 18b). This is possible because a suppressed-phase MJO emerges in theWIO after a convective-phase MJO moves to the EIO; the suppressed-phase MJO then intensifies and moves eastward. This scenario represents a downstream forcing of an opposite-phase MJO in the EIO.
By examining the composite OLR and 850-hPawind evolution maps during the initiation period, Zhao et al. (2013)noted that the anomalous easterlies overthe equatorial Indian Ocean from day -25 to day -15were primarily driven by the negative heating anomalyover the EIO, not the preceding convective MJO phasein the western equatorial Pacific. Thus the initiationof new convection over WIO is a direct Rossby wave response to the preceding suppressed MJO heating overthe EIO.
 |
| Fig. 18. Schematic diagrams illustrating(a)an upstreamforcing scenario in which a positive MJO heating in thewestern Pacific may induce an anomalous easterly over theWIO through Kelvin wave response, and (b)a downstreamforcing scenario in which a negative heating anomaly associated with suppressed-phase MJO may induce twin-gyrecirculation in the tropical Indian Ocean through Rossbywave response. From Zhao et al. (2013). |
To obtain the statistically robust signal of themidlatitude impact, Zhao et al. (2013)examinedthe upper tropospheric(200 hPa)geopotential heightanomaly pattern and associated wave activity fluxduring the initiation period for all cases(Fig. 19). Note that the geopotential height anomaly displays awave train pattern, with high pressure centers locatedsoutheast of South America and southeast of Africa, and low-pressure centers in between and to the east ofMadagascar.
 |
| Fig. 19. 20-90-day filtered observed geopotential heightanomaly(contour; m2 s-2), Rossby wave activity flux(vector; m2 s-2), and wave flux divergence(shading; 10-5 m s-2; only negative values are shaded over the IndianOcean)at 200 hPa during the initiation period from day-25 to day -15. From Zhao et al. (2013). |
To illustrate wave energy dispersion characteristics, a phase-independent wave activity flux was calculated following T ak aya and Nakamura(2001),
where a bar and a prime denote the LFBS and the intraseasonal anomaly, W represents the horizontal waveactivity flux, u and v are zonal and meridional windvelocity, and ψ denotes the streamfunction.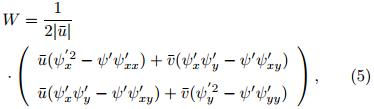
Figure 19 shows that there are pronounced eastward wave activity fluxes over midlatitude SouthernHemisphere, indicating that the Rossby wave energypropagates eastward. The eastward wave activityfluxes turn northward and converge onto the tropical Indian Ocean between 10° and 30° S. The waveflux convergence implies that the wave energy is accumulated over the region. A similar wave activityflux feature is also found in the lower-troposphericgeopotential height anomaly field(figure omitted), indicating that the Rossby wave train has an equiv alentbarotropic structure. Thus, SH midlatitude Rossbywave perturbations may trigger MJO initiation in thetropical IO through wave energy accumulation. 5. 2 Idealized numerical experiments
The observ ational analysis above suggests that the circumnavigating signal around the globe is notcritical for MJO initiation in WIO. To further support this claim, we conduct idealized numerical experiments using ECHAM4. In a control experiment, the model is integrated for 20 yr with specified climatologic monthly SST. In a sensitivity experiment(named EXP_TA), the eastward-propagating intraseasonal signal is suppressed over the tropical Atlantic region(20° S-20° N, 60° W-20° E). Figure 20shows the power spectrum of simulated intraseasonalOLR fields from both the control experiment and theEXP_TA run based on a wavenumber-frequency analysis. The magnitudes of averaged 20-90-day OLRspectrum for zonal wavenumber 1 in both experimentsare quite similar. This points out that the overall eastward-propagating MJO variance has little change even though the circumnavigating mode is greatly suppressed.
 |
| Fig. 20. Wavenumber-frequency spectra(W2 m-4)of theintraseasonal OLR anomaly derived from the 20-yr simulation of the(a)Control, (b)EXP_TA, and (c)EXP_NS experiments. The spectrum analysis was done for a limiteddomain over 20° N-20° S, 40° E-180° . |
The role of the midlatitude forcing effect is examined through additional sensitivity experiments. InEXP_NS, a Newtonian damping is applied over twolatitudinal zones, 20° -30° S and 20° -30° N, to force themodel prognostic variables toward the controlled climatologic annual cycle in the two zones. By doingso, the intraseasonal and higher-frequency variability over the zones is greatly suppressed and tropics-midlatitude connection was broken. As a result, themidlatitude influence on the tropical MJO variabilitywas intentionally suppressed. By comparing the intraseasonal OLR spectrum in the control run and theEXP_NS run(Fig. 20c), one can see that the MJOvariability in the tropics weakens significantly . For example, the averaged spectrum for zonal wavenumber1 and 20-90-day period is reduced by 45%. Thus, thenumerical result confirms that the remote forcing frommidlatitudes is important in affecting the overall MJOvariance in the tropics.
To further underst and the relative role of the SH and NH midlatitude forcing effect, we conduct othertwo sensitivity experiments named as "EXP_SH" and "EXP_NH". In EXP_SH(EXP_NH)run, we blockthe equatorward propagation of SH(NH)midlatitude waves. Compared to the control run, the averaged spectrum for zonal wavenumber 1 and 20-90-day period in the EXP_SH(EXP_NH)is reduced by42%(7%)(figure omitted). The sensitivity experiments indicate that most of the spectrum reduction inEXP_NS is attributed to the SH wave effect. Therefore, the remote forcing from midlatitude SH is crucialfor triggering MJO convection in boreal winter. 5. 3 Discussion
The result presented by Zhao et al. (2013)differs from Kikuchi and T ak ayabu(2003; KT hereafter), who emphasized the role of circumnavigating signal inMJO initiation. Note that KT constructed the MJOsignal using EOF patterns in a global tropics domain. While this methodology( and RMM method proposedby Wheeler and Hendon, 2004)can capture dominantlarge-scale structure and propagation characteristics, it greatly underestimates(or smoothes out)regionalscale features associated with MJO convection initiation in WIO. For instance, according to KT's Fig. 5, the convection initiation appears at 60° E around t =4. Before this initiation time, low-level wind is a pronounced westerly anomaly, which is opposite to ourresult(we noted significant easterly anomaly signalsprior to the initiation). Secondly, total precipitablewater(TPW)used in KT is a vertically-integratedvariable, which is approximately in phase with the precipitation anomaly(see KT's Fig. 5); thus the TPWdoes not lead the convection. However, in Zhao etal. (2013), a key precursor signal is lower-troposphericspecific humidity, which leads the convection anomalyby 5-10 days.
One issue related to the MJO initiation is whetherthe local forcing in the tropics and the remote forcingfrom midlatitudes are independent. The compositestudy by Zhao et al. (2013)using 20-yr ERA-40 datashows that both the internal tropical process and the external midlatitude forcing process happened duringthe initiation period(day -25 to day -15). However, for each individual case, the two processes may occuron the same time and independently . Physical processes associated with the two processes are different. One emphasizes low-level moisture advection, and theother emphasizes upper-tropospheric Rossby wave energy accumulation. The former may trigger the convection through the gradual setup of a convectivelyunstable stratification, whereas the latter may triggerMJO through upper-tropospheric potential vorticity(PV)invasion.
A related issue is the cause of irregularity of MJO. The timing between MJO events is highly variable, whereas the postulated downstream tropical Rossbywave response would seem to have a more tightlybound periodicity . It is reasonable to assume thattropical forcing associated with downstream Rossbywave response is mostly responsible for successive events, while the midlatitude forcing plays a moreimportant role in causing primary events(Matthews, 2008). It is worth mentioning that convective(or potential)instability is a necessary but not suffcientcondition for convection to occur. This means thatthe horizontal advection of mean specific humidity byMJO flow keeps moistening the lower troposphere inthe WIO until a trigger(or a lifting)either from tropics or extratropics comes along. Any scale motion mayinterrupt the convection initiation process through induced subsidence in the region. It is also noted thatnot all individual MJO events have experienced a gradual moistening before initiation. Thus, a further studyis needed to identify the relative roles of the localmoistening and extratropical triggering processes in each of individual MJO events.
The downstream Rossby wave forcing process proposed by Zhao et al. (2013)is somewhat similar tothat of Jiang and Li(2005), who studied the MJO initiation in boreal summer. The main difference lies onthe fact that the background mean flow in boreal summer is more of equatorial asymmetry, and as a result, atmospheric response to a symmetric MJO heating inthe EIO is asymmetric. The initial moistening(drying) and PBL convergence(divergence)was causedby anomalous warm(cold)advection induced by anomalous cross-equatorial flow in the lower troposphere(Jiang and Li, 2005).
Li et al. (2008)suggested that MJO initiationarose from a delayed air-sea interaction mechanism. The major processes associated with this mechanismare summarized as following. A preceding suppressedconvective phase of MJO caused a warm SST anomalydue to enhanced shortwave radiation and reduced latent heat flux over the equatorial IO. The warming hada maximum center in the western IO thermocline dome and persisted after the dry-phase MJO had passed thebasin. This warm SST anomaly triggered a convectivephase of MJO. Thus, through this delayed air-sea interaction scenario, the preceding MJO may exert adelayed impact on the subsequent development of anopposite-phase MJO. 6. MJO interaction with high-frequency eddies
The MJO exhibits a multi-scale characteristic. Nakazawa(1988)showed that the MJO is organized by clouds with scales from individual cumulus, MCS, to SCC. The latter is often referred toas convectively coupled Kelvin waves. Within theMJO large-scale convective envelope, there are higherfrequency westward-propagating transient waves, including tropical depression(TD)-Mixed Rossby gravity wave(MRG)type perturbations(Tak ayabu and Nitta, 1993; Dickinson and Molinari, 2002; Aiyyer and Molinari, 2003; F rank and Roundy, 2006). AsMJO propagates eastward from the Indian Ocean tothe western Pacific, it interacts with higher-frequencyweather systems such as TCs and lower-frequencymodes such as ENSO(Liebmann et al. , 1994; Maloney and Hartmann, 2000a; V ecchi and Harrison, 2002; Straub and Kiladis, 2003; Jones et al. , 2004a, b; Batstone et al. , 2005).
Wang and Liu(2011)constructed a scale interaction model in which there are two-way interactionsbetween MJO and high-frequency eddies(includingSCC and westward-propagating inertial-gravity waves(WIG)or two-day waves). They assumed that thewestward tilted super cloud clusters are located in thewest part of the convection center of the MJO, whilethe enhanced eastward tilted two-day waves occur tothe east of the MJO convective center. Their numerical experiment showed that in such a scenario the eddy momentum transport would enhance the lowertroposphere westerly(easterly)in the rear(front)ofthe MJO, respectively, which presents a positive feedback for the MJO. Figure 21 illustrates a schematicdiagram for such positive feedback processes.
 |
| Fig. 21. Schematic diagram describing the multi-scalestructure associated with MJO. The red ellipse and thickarrows represent, respectively, the convective complex and planetary-scale zonal circulations associated withMJO. The blue ellipse and thin arrows denote verticallytilted meso-synoptic disturbances(SCCs and WIG waves) and associated convergence/divergence, respectively . Thethick blue arrows represent eddy-induced upscale easterly/westerly momentum transfer(UEMT/UWMT). Thered thin arrows represent the boundary layer Ekmanpumping(BLEP). From Wang and Liu(2011). |
It is worth mentioning that this scale interactionprocess is SCC/WIG location dependent. A negativefeedback can be obtained when SCC(WIG)prevailsin the front(back)of the MJO(Liu et al. , 2012). Theeastward tilted WIG or two-day waves also have positive eddy moisture transfer, which will moisten themiddle troposphere and enhance the MJO(Liu and Wang, 2012).
To examine the two-way interaction between thetropical ISO and SSV, Zhou and Li(2010)conductedan observ ational analysis. A 3-10-day b and -pass filter was employed to extract the synoptic-scale signalat different phases of MJO. Figure 22 shows that the strength of atmospheric synoptic-scale variability(SSV)differs markedly between MJO active and suppressed phases in the WNP(Zhou and Li, 2010). During the active phase, a well-organized synoptic-scalewave train with alternative cyclonic and anticyclonicflows occurs, consistent with the observed(Lau and Lau, 1990). The wave train propagates northwestwardat a phase speed of about 3 m s-1. In contrast, during the MJO suppressed phase, the wave train is muchweaker and loosely organized.
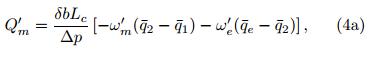
Most of previous studies emphasized the MJO in-fluence on SSV, and less attention was paid to thefeedback of SSV to MJO. Zhou and Li(2010)examined the feedback of SSV to MJO through nonlinearrectification of surface LHF. The surface LHF may bewritten as:
where L = 2. 5×10⁶ J kg-1is the latent heat of condensation, ρ = 1. 225 kg m3is the air density at thest and ard sea level, CEis an exchange coeffcient, |V| isthe 10-m wind speed(derived from 6-hourly ECMWFdata), qs is the sea surface specific humidity(derivedfrom 6-hourly interpolated TMI SST and 6-hourly sealevel pressure from the ECMWF TOGA analysis), and qa is the specific humidity at 10 m(derived from 6-hourly sea-level pressure and dew point temperaturefrom the ECMWF TOGA analysis).
 |
| Fig. 22. Time evolution of the 3-10-day filtered QuikSCAT surface wind(vector; m s-1) and vorticity(contour; interv al: 0. 3×10⁻⁵ s-1)fields from day -2 to day 2 during the ISO active(a, b, c) and suppressed(d, e, f)phases. Day0 corresponds to a time when the maximum synoptic disturbance appears in the reference(red)box. After Zhou and Li(2010). |
To examine to what extent SSV contributes tothe intraseasonal surface LHF, zonal and meridionalwind components(u, v) and air-sea humidity difference(△q)fields are separated into three components, a low-frequency(greater than 90 days)backgroundmean state(LFBS), a synoptic-scale component, and an intraseasonal(20-90-day)component.
Firstly, the LHF is calculated based on the sumof all the three components(which is approximately equal to the total field). The so-calculated LHF isthen sub ject to a 20-90-day b and -pass filtering. Secondly, the LHF is calculated based on the sum of theLFBS and the synoptic-scale component only(withoutinvolving the ISO component). The same 20-90-dayfilter is then applied to this LHF field.
By comparing the st and ard deviation of both theintraseasonal LHF fields, one may reveal what percentage of the intraseasonal LHF comes from the SSVmean flow interaction. Figure 23 shows the ratio ofthe st and ard deviation of the two intraseasonal LHFfields. Note that the ratio exceeds 30% over most ofthe tropical Indian Ocean, western Pacific, and eastern North Pacific, indicating a great upscale feedbackof SSV to the intraseasonal surface LHF in the region. Maximum SSV feedback may exceed 50% in some regions of the western and northeastern Pacific. In general, the strong upscale feedback occurs in the regionwhere both the MJO and synoptic-scale variabilitiesare large.
 |
| Fig. 23. Ratio of the st and ard deviations of the nonlinearly rectified intraseasonal latent heat flux(calculatedbased on synoptic-scale and LFBS fields) and the total intraseasonal latent heat flux(calculated based on synopticscale, MJO, and LFBS fields). From Zhou and Li(2010). |
SSV may also feed back to MJO through nonlinear rectification of atmospheric apparent heating(HsuFig. 23. Ratio of the st and ard deviations of the nonlinearly rectified intraseasonal latent heat flux(calculatedbased on synoptic-scale and LFBS fields) and the total intraseasonal latent heat flux(calculated based on synopticscale, MJO, and LFBS fields). From Zhou and Li(2010). and Li, 2011). According to Yanai et al. (1973), theatmospheric apparent heat source(Q1) and apparentmoisture sink(Q2)may be computed as residuals ofthe thermodynamic and moisture equations respectively:
where cp denotes the specific heat at constant pressure, T the temperature, t the time, ω the verticalp-velocity,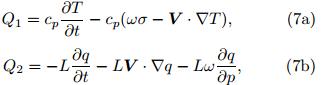 the static stability, Rthe gas constant, p the pressure, V the horizontal velocity, ▽ the horizontal gradient operator, L the latentheat of condensation, and q the specific humidity . Q1represents the total diabatic heating including radiation, latent heating, surface heat flux, and sub-gridscale heat flux convergences. Q2represents the latentheating due to condensation or ev aporation processes and sub-grid scale moisture flux convergence(Yanai et al. , 1973).
 The feedback of SSV to intraseasonal apparentheat and moisture sources is estimated through thefollowing methods. Firstly, all the variables(u, v, ω, T, q)are partitioned into the LFBS, intraseasonal and synoptic-scale components. Then, Q1 and Q2 fieldsare calculated based on the sum of the LFBS, intraseasonal(10-90-day) and synoptic-scale(3-10-day)components. The so-calculated Q1 and Q2 fields arethen sub ject to a 10-90-day b and -pass filter to reveal the overall strength of the intraseasonal Q1 and Q2variabilities. Figure 24 shows the st and ard deviation of 1000-100 hPa averaged 10-90-day heatingrate(Q1/cp)calculated based on the total fields above. Note that three maximum variability centers are identified, and they are located in the Indian monsoonregion(10° -20° N, 70° -100° E), the Philippine SeaWNP sector(10° -20° N, 120° -150° E) and the tropical eastern Pacific(5° -15° N, 90° -120° W), as shownin Fig. 24a. The spatial pattern of the 10-90-day diabatic heating corresponds well to the gross features ofthe intraseasonal precipitation shown in Li and Wang(2005), reflecting the diabatic heating source for the summer ISO. The vertical profiles of the apparent heatsources averaged over the tropical Indian Ocean and western and eastern North Pacific show a maximumvalue near 400-500 hPa, with a heating rate of 2-2. 5K day-1(Fig. 24d).
 |
| Fig. 24. Standard deviations of 10-90-day vertically averaged heating rates (Q1=cp; K day-1) calculated based on (a) the total fields, (b) the LS components, and (c) the T-LI method (see text). Panels (d)-(f ) show the vertical profiles of (a)-(c) averaged over the Indian monsoon region (10° -20° N, 70° -100° E; dashed line), the WNP sector (10° -20° N, 120° -150° E; solid line); and the tropical eastern Pacific (5° -15° N, 90° -120° W; dotted line). From Hsu and Li (2011). |
Secondly, the effects of eddy-eddy and eddy-mean flow interactions on the intraseasonal apparent heatsource are estimated. Two methods are developed forthis purpose. One is to calculate the Q1 and Q2 fieldsbased on the sum of the LFBS and synoptic(hereafterLS)components(without involving the MJO flow). The so-calculated Q1 and Q2 fields are then sub jectto a 10-90-day b and -pass filter. This calculation, however, does not include the effect of the eddy-MJO interaction. The st and ard deviation of vertically averaged 10-90-day heating rate(Q1/cp)calculated basedon the LS components is displayed in Fig. 24b. Theamplitude of the nonlinearly rectified heating over thetropical Indian Ocean and western Pacific regions is0. 2-0. 25 K day-1(Fig. 24b). The vertical profiles ofthe nonlinearly rectified heating fields averaged overthe three active ISO regions show a maximum in themid troposphere(Fig. 24e).
The second method has the following procedure:1)calculating Q1 and Q2with the sum of the LFBS and ISO(hereafter LI)components, 2)applying a 10-90-day b and -pass filter to the resulting Q1 and Q2fields, 3)subtracting the time series of the Q1 and Q2fields above from the time series of the Q1 and Q2fields calculated based on the total components. Theso-calculated intraseasonal Q1 and Q2 fields reflect theinteractions of SSV with both the LFBS and ISO flows. The second method is called the T-LI method.
The amplitude of the nonlinearly rectified Q1fieldderived by the T-LI method is a little weaker(Fig. 24c), compared with that derived based on the LScomponents(Fig. 24b), even though their spatial distributions are similar. The same methods are appliedto the Q2 field. The overall horizontal patterns ofthe calculated intraseasonal Q2 fields(figure omitted)are quite similar to the corresponding Q1 fields. Themajor difference lies in the vertical profiles. The maximum amplitudes of the total and nonlinearly rectifiedintraseasonal Q2 fields all appear in the lower troposphere(between 700 and 850 hPa). Figure 25 shows the ratios of st and ard deviationsof the nonlinearly rectified Q1 and Q2 fields calculatedbased on the two methods to st and ard deviations ofthe total intraseasonal Q1 and Q2 fields. The nonlinearly rectified Q1 and Q2based on both the methods account for 10%-30% of the total intraseasonal Q1 and Q2variabilities, indicating that high-frequency eddiescan significantly modulate the intraseasonal diabaticheating in the active MJO and SSV regions.
 |
| Fig. 25. Vertical distributions of ratios of st and ard deviations of the nonlinear rectified 10-90-day Q1 field calculated based on the(a)LS components and (b)T-LI methodvs the st and ard deviations of the total intraseasonal Q1over the three box regions shown in Fig. 24a. (c, d)As(a, b), but for Q2. From Hsu and Li(2011). |
The role of scale interactions in the maintenanceof eddy kinetic energy(EKE)during the MJO wet and dry phases was examined through the construction ofa new eddy energetic diagnostic tool that separatesthe effect of MJO and LFBS(Hsu et al. , 2011). Asthe summer LFBS always contributes positively toward the EKE, the synoptic eddies extract energy fromMJO during its active phase. This positive barotropic energy conversion occurs when the synoptic eddies interact with low-level cyclonic and convergent MJOflows. This contrasts to the MJO dry phase duringwhich the synoptic eddies lose kinetic energy to theMJO flow. The anticyclonic and divergent MJO flowduring the dry phase is responsible for the negativebarotropic energy conversion.
In addition, SSV may exert an upscale feedbackto MJO through eddy momentum transport(Ma jda and Stechmann, 2009; Hsu and Li, 2011) and themodulation of intraseasonal SST variations(Li et al. , 2008). 7. Summary and discussion
In this review paper, some of the recent progressin underst and ing MJO dynamics is described, including mechanisms for MJO eastward propagation, planetary-scale selection, seasonality, initiation, and multi-scale interaction.
The moisture dynamics responsible for the eastward propagation of MJO were examined through amoisture budget diagnosis based on the ERA-40 reanalysis during DJF of 1979-2001(Hsu and Li, 2012). A positive moisture anomaly appears at the PBL(1000-700 hPa)to the east of MJO convection. Thiseast-west moisture asymmetry leads to a convectivelyunstable stratification in the lower troposphere and triggers shallow convection. The shallow convectionfurther transports water vapor upward, leading to theonset of deep convection. This stepwise developmentof MJO shallow-to-deep convection agrees well withprevious studies(e. g. , Kemball-Cook and Weare, 2001; Kikuchi and T ak ayabu, 2004; Benedict and R and all, 2007). Therefore, a key element for MJO eastwardpropagation is its zonal moisture asymmetry .
Amoisture budget analysis was performed to underst and the cause of the moisture asymmetry(Hsu and Li, 2012). The diagnosis result indicated thatthe vertical advection of mean moisture by anomalous ascending motion associated with PBL convergence dominated the low-level moistening ahead ofMJO convection. A diagnosis of the PBL momentum budget further showed that the contribution tothe PBL convergence by the heating-induced freeatmospheric wave dynamics was dominant and it accounted for 75%-90% of the total boundary layer convergence. The contribution by anomalous SST dueto SST-gradient-induced pressure gradient(Lindzen and Nigam, 1987)accounted for 10%-25% of the totalboundary layer convergence. The result suggests thatboth the internal atmospheric dynamics and air-seainteractions contribute to the PBL convergence and the moisture asymmetry and thus are responsible forthe eastward propagation of MJO.
The cause of the planetary scale selection of theMJO was investigated through a 2. 5-layer atmosphericmodel(Li and Zhou, 2009). Initially, a Kelvin waveperturbation with zonal wavenumbers 1-15 was speci-fied respectively . In the presence of a frictional boundary layer, the most unstable mode prefers a shortwavelength under a linear heating; but with a nonlinear heating, the zonal wavenumber-one grows fastest. Thus the numerical simulations point out the crucialimportance of the nonlinear heating in the MJO planetary scale selection.
The cause of this scale selection under the nonlinear heating is attributed to the distinctive phasespeeds between the dry Kelvin wave and the wetKelvin-Rossby wave couplet. The faster dry Kelvinwave triggered by a convective branch may "catch up" and suppress another convective branch, which travelsat the phase speed of the wet Kelvin-Rossby wave couplet, ahead of it, if the distance between the two neighboring convective branches is smaller than a criticaldistance(about 16000 km). The interference betweenthe dry Kelvin wave and the wet Kelvin-Rossby wavecouplet eventually dissipates and "filters out" shorterwavelength perturbations, leading to a longwave selection. The distinctive MJO propagation feature betweenboreal winter and summer was investigated throughan eigenvalue analysis. It was found that atmosphericmoist Kelvin waves are unstable while Rossby wavesare stable in boreal winter when maximum mean ascending motion and moisture are near the equator; atmospheric moist Kelvin waves stabilize while Rossbywaves become unstable in boreal summer, when maximum mean ascending motion and moisture are morethan one Rossby radius of deformation away fromthe equator. The theoretical study suggests that themarked northward shift of the thermal equator in boreal summer is an essential cause of meridional bifurcation of the MJO convection off Sumatra.
The precursor signals of MJO convection initiation in boreal winter were investigated through thediagnosis of 20-yr ERA-40 reanalysis data(Zhao et al. , 2013). The western equatorial Indian Ocean is akey region of the MJO initiation. A marked increaseof low-level specific humidity appeared 5-10 days priorto the convection initiation. The increased moisturecaused convective instability, leading to the onset ofthe convection.
A diagnosis of lower-tropospheric moisture budgets showed that the moisture increase was causedprimarily by the horizontal advection of the meanspecific humidity by anomalous flows induced dueto downstream Rossby wave response to a precedingsuppressed-phase MJO over the eastern Indian Ocean.
The midlatitude wave activity flux prior to theMJO initiation was diagnosed(Zhao et al. , 2013). Itwas found that SH midlatitude Rossby waves contributed to MJO initiation over the western IndianOcean through wave energy accumulation. Idealizednumerical experiments confirmed the importance ofSH midlatitude wave perturbations in affecting theMJO variance in the tropics.
Two-way interactions between the MJO and high-frequency motion were investigated. By constructing a theoretical model, Wang and Liu(2011)showed that convectively coupled Kelvin waves and westward-propagating inertial-gravity waves couldfeed positively back to MJO flow through eddy momentum transport, provided that the higher-frequencyKelvin waves(inertial-gravity waves)were placedto the west(east)of the MJO convective center.
Through the analysis of observ ational data, Zhou and Li(2010)showed that MJO significantly modulatedthe synoptic-scale variability . For example, synopticwave trains in WNP were stronger(weaker)during theMJO active(suppressed)phase. The synoptic-scalemotion can exert an upscale feedback to MJO throughthe nonlinear rectification of the surface latent heatflux, atmospheric apparent heat source(Q1) and moisture sink(Q2), and eddy momentum transport(Zhou and Li, 2010; Hsu and Li, 2011). The nonlinearlyrectified LHF and diabatic heating due to eddy-meanflow interactions account for 30%-50% and 10%-30%, respectively, of their total intraseasonal variabilities inthe WNP.
Over the past decades, the improvements of numerical weather forecast model physics, data assimilation methodology and computing technology havesignificantly advanced 3-7-day medium range weatherforecasts(Saha et al. , 2006). Climate prediction hasalso shown capability in seasonal range(Wang et al. , 2009). However, the extended range(10-30 days)forecast has so far received less attention and is consideredas a forecast gap between short-range weather and long-term climate predictions(Shukla et al. , 2010). How to improve the extended range forecast of highimpact events remains a challenge in both weather and climate services.
The major predictability source at extended rangelies in the atmospheric MJO. Numerous studies haveindentified the modulations of the MJO on monsoonactivity and the occurrence of heavy monsoon rainfall(e. g. , Y asunari, 1979; Lau and Chan, 1986). The ISOregulates the genesis, frequency, track, and strengthof tropical cyclones(e. g. , Liebmann et al. , 1994; Maloney and Hartmann, 2000a, b). Hence the MJO hassignificant impacts on the skill of medium-to-extendedrange weather forecasts(Hendon et al. , 2000; Jones et al. , 2000). In Southeast China, extreme floodsoccurring in pre-monsoon and summer monsoon seasons were often associated with the MJO activities(Zhu et al. , 2003; Yang and Li, 2003; Mao and Wu, 2006; Mao et al. , 2010; Yang et al. , 2010). Significantnorthward-propagating 30-60-day ISO from the tropics was observed in the 1998 Y angtze River floodingevent(Zhu et al. , 2003). Thus, the connection betweenthe MJO activities and heavy rainfall events providespredictability sources for predicting low-frequency precipitation events at 10-30-day leads.
One way to achieve extended-range forecast isto rely on dynamic models. Most of current operational models, however, have low skills in predictingthe MJO(Kim et al. , 2009). Another way is to reply on empirical model(e. g. , Lo and Hendon, 2000; Jones et al. , 2004a; Jiang et al. , 2008). Most of thesestatistical models are based on the empirical orthogonal function(EOF)analysis or the regression method. Different from the above approach, we proposed aspatial-temporal projection model(STPM). The special feature of this new model is the use of extended singularity value decomposition(E-SVD)technique. In other words, the model utilizes the spatial and temporal information of predictor-predict and coupledpatterns. A preliminary application of this methodto 10-30-day forecast of rainfall over South China for2008-2012 indicates that the ensemble prediction ofthe STPM achieves a useful skill(with a temporalcorrelation coeffcient exceeding the 95% confidencelevel)up to a 30-day lead. Currently we are applyingthis methodology to other parts of China and to theglobal tropics.
Acknowledgments: Contributions by Drs. Pangchi Hsu, Xianan Jiang, Fei Liu, Chongbo Zhao, Chunhua Zhou, Jianyun Gao, and Dejun Gu aregreatly appreciated.
| Aiyyer, A. R., and J. Molinari, 2003: Evolution of mixed Rossby-gravity waves in idealized MJO environ-ments. J. Atmos. Sci., 60(23), 2837-2855. |
| Annamalai, H., J. M. Slingo, K. R. Sperber, et al., 1999: The mean evolution and variability of the Asian summer monsoon: Comparison of ECMWF and NCEP-NCAR reanalyses. Mon. Wea. Rev., 127(6),1157-1186. |
| —-, and —-, 2001: Active/break cycles: Diagnosis of the intraseasonal variability of the Asian summer monsoon. Climate Dyn., 18(1-2), 85-102. |
| Batstone, C. P., A. J. Matthews, and D. P. Stevens, 2005: Coupled ocean-atmosphere interactions between the Madden-Julian oscillation and synoptic-scale vari-ability over the warm pool. J. Climate, 18(12),2004-2020. |
| Benedict, J., and D. A. Randall, 2007: Observed charac-teristics of the MJO relative to maximum rainfall. J. Atmos. Sci., 64(7), 2332-2354. |
| Biello, J. A., and A. J. Majda, 2005: A new multi-scale model for the Madden-Julian oscillation. J. Atmos. Sci., 62(6), 1694-1721. |
| —-, —-, and M. W. Moncrieff, 2007: Meridional mo-mentum flux and super-rotation in the multi-scale IPESD MJO model. J. Atmos. Sci., 64(5), 1636-1651. |
| Chang, C. P., 1977: Viscous internal gravity waves and low-frequency oscillations in the tropics. J. Atmos. Sci., 34(6), 901-910.. |
| Chen, T.-C. and M. Murakami, 1988: The 30-50-dayvariation of convective activity over the western Pa-cific Ocean with the emphasis on the northwestern region. Mon. Wea. Rev., 116(4), 892-906. |
| —-, R. Y. Tzeng, and M. C. Yen, 1988: Development and life cycle of the Indian monsoon: Effect of the 30-50-day oscillation. Mon. Wea. Rev., 116(11),2183-2199. |
| Dickinson, M., and J. Molinari, 2002: Mixed Rossby-gravity waves and western Pacific tropical cycloge-nesis. Part Ⅰ: Synoptic evolution. J. Atmos. Sci.,59(14), 2183-2195. |
| Ding, Q. H., and B. Wang, 2007: Intraseasonal telecon-nection between the summer Eurasian wave train and the Indian monsoon. J. Climate, 20(15), 3751-3767. |
| Ding, Y. H., 2007: The variability of the Asian summer monsoon. J. Meteor. Soc. Japan, 85B, 21-54. |
| Emanuel, K. A., 1987: An air-sea interaction model ofintraseasonal oscillations in the tropics. J. Atmos. Sci., 44(16), 2324-2340. |
| —-, 1994: Atmospheric Convection. Ox ford Univ. Press,New York, 580 pp. |
| Flatau, M. K., P. Flatau, P. Phoebus, et al., 1997: The feedback between equatorial convection and local radiative and evaporative processes: The implica-tions for intraseasonal oscillations. J. Atmos. Sci.,54(19), 2373-2386. |
| Frank, W. M., and P. E. Roundy, 2006: The role of tropi-cal waves in tropical cyclogenesis. Mon. Wea. Rev.,134(9), 2397-2417. |
| Fu, X., B. Wang, T. Li, et al., 2003: Coupling between northward propagating ISO and SST in the Indian Ocean. J. Atmos. Sci., 60, 1733-1753. |
| Gadgil, S., and J. Srinivasan, 1990: Low frequency varia-tion of tropical convergence zones. Meteor. Atmos. Phys., 44(1-4), 119-132. |
| Gautier, C., and B. DiJuli, 1990: Cloud effect on air-seainteractions during the 1979 Indian summer mon-soon as studied from satellite observations. Meteor. Atmos. Phys., 44, 119-132. |
| Gill, A. E., 1980: Some simple solutions for heat-induced tropical circulation. Quart. J. Roy. Meteor. Soc.,106(449), 447-462. |
| Goswami, B. N., 1998: Interannual variations of Indian summer monsoon in a GCM: External conditions versus internal feedback. J. Climate, 11(4), 501-522. |
| Goswami, P., and R. K. Rao, 1994: A dynamical mecha-nism for selective excitation of the Kelvin mode at timescale of 30-50 days. J. Atmos. Sci., 51(19),2769-2779. |
| Grabowski, W. W., 2001: Coupling cloud processes with the large-scale dynamics using the cloud-resolving convection parameterization (CRCP). J. Atmos. Sci., 58(9), 978-997. |
| Hartmann, D. L., and M. L. Michelsen, 1989: Intrasea-sonal periodicities in Indian rainfall. J. Atmos. Sci.,46(18), 2838-2862. |
| —-, and E. D. Maloney, 2001: The Madden-Julian oscil-lation, barotropic dynamics, and North Pacific tropical cyclone formation. Part Ⅱ: Stochastic barotropic modeling. J. Atmos. Sci., 58(17), 2559-2570. |
| —-, M. L. Michelsen, and S. A. Kelein, 1992: Seasonal variations of tropical intraseasonal oscillations: A20-25-day oscillation in the western Pacific. J. At-mos. Sci., 49(14), 1277-1289. |
| —-, and M. L. Salby, 1994: The life cycle of Madden-Julian oscillation. J. Atmos. Sci., 51, 2207-2219. |
| —-, and J. Glick, 1997: Intraseasonal air-sea interaction in the tropical Indian and Pacific oceans. J. Cli-mate, 10(4), 647-661. |
| —-, B. Liebmann, M. Newman, et al., 2000: Medium-range forecast errors associated with active episodes of the Madden-Julian oscillation. Mon. Wea. Rev.,128(1), 69-86. |
| Holton, J. R., 1992: An Introduction to Dynamic Meteo-rology (Third Edition). Academic Press, San Diego,511 pp. |
| Houze, R. A., Jr., 1993: Cloud Dynamics. AcademicPress, San Diego, 573 pp. |
| Hsu, H. -H., and C.-H. Weng, 2001: Northwestward prop-agation of the intraseasonal oscillation in the western North Pacific during the boreal summer: Structure and mechanism. J. Climate, 14(18), 3834-3850. |
| —-, and M. Lee, 2005: Topographic effects on the east-ward propagation and initiation of the Madden-Julian oscillation. J. Climate, 18(6), 795-809. |
| —-, B. J. Hoskins, and F.-F. Jin, 1990: The 1985/86 intraseasonal oscillation and the role of the extrat-ropics. J. Atmos. Sci., 47(7), 823-839. |
| Hsu, P.-C., and T. Li, 2011: Interactions between boreal summer intraseasonal oscillations and synoptic-scale disturbances over the western North Pacific. Part II: Apparent heat and moisture sources and eddy momentum transport. J. Climate, 24(3), 942-961. |
| —-, and —-, 2012: Role of the boundary layer moisture asymmetry in causing the eastward propagation of the Madden-Julian oscillation. J. Climate, 25(14),4914-4931. |
| —-, —-, and C.-H. Tsou, 2011: Interactions between bo-real summer intraseasonal oscillations and synoptic-scale disturbances over the western North Pacific. Part I: Energetics diagnosis. J. Climate, 24(3), 927-941. |
| Jiang, X., and T. Li, 2005: Re-initiation of the boreal summer intraseasonal oscillation in the tropical In-dian Ocean. J. Climate, 18(18), 3777-3795. |
| —-, —-, and B. Wang, 2004: Structures and mecha-nisms of the northward propagating boreal summer intraseasonal oscillation. J. Climate, 17(5), 1022-1039. |
| —-, D. E. Waliser, M. C. Wheeler, et al., 2008: Assessing the skill of an all-season statistical forecast model for the Madden-Julian oscillation. Mon. Wea. Rev.,136(6), 1940-1956. |
| Jones, C., and B. C. Weare, 1996: The role of low-level moisture convergence and ocean latent heat fluxes in the Madden and Julian oscillation: An observational analysis using ISCCB data and ECMWF analyses. J. Climate, 9, 3086-3104. |
| —-, D. E. Waliser, J.-K. E. Schemm, et al., 2000: Pre-diction skill of the Madden and Julian oscillation in dynamical extended range forecasts. Climate Dyn.,16(4), 273-289. |
| —-, D. E. Waliser, K. M. Lau, et al., 2004a: The Madden-Julian oscillation and its impact on Northern Hemi-sphere weather predictability. Mon. Wea. Rev.,132(6), 1462-1471. |
| —-, —-, —-, et al., 2004b: Global occurrences of ex-treme precipitation and the Madden-Julian oscilla-tion: Observations and predictability, J. Climate,17(23), 4575-4589. |
| —-, L. M. V. Carvalho, W. Higgins, et al., 2004c: Clima-tology of tropical intraseasonal convective anoma-lies: 1979-2002. J. Climate, 17(3), 523-539. |
| Johnson, R. H., T. M. Rickenbach, S. A. Rutledge, etal., 1999: Trimodal characteristics of tropical con-vection. J. Climate, 12(8), 2397-2418. |
| Kawamura, R., T. Murakami, and B. Wang, 1996: Trop-ical and midlatitude 45-day perturbations over the western Pacific during the northern summer. J. Me-teor. Soc. Japan, 74(6), 867-890. |
| Kemball-Cook, S. R., and B. Wang, 2001: Equatorialwaves and air-sea interaction in the boreal summer intraseasonal oscillation. J. Climate, 14(13), 2923-2942. |
| —-, and B. C. Weare, 2001: The onset of convection in the Madden-Julian oscillation. J. Climate, 14(5),780-793. |
| Khouider, B., and A. J. Majda, 2006: A simple mul-ticloud parameterization for convectively coupled tropical waves. Part Ⅰ: Linear analysis. J. Atmos. Sci., 63(4), 1308-1323. |
| Kikuchi, K., and Y. N. Takayabu, 2003: Equatorial cir-cumnavigation of moisture signal associated with the Madden-Julian oscillation (MJO) during boreal winter. J. Meteor. Soc. Japan, 81(4), 851-869. |
| —-, and —-, 2004: The development of organized con-vection associated with the MJO during TOGA COARE IOP: Trimodal characteristics. Geophys. Res. Lett., 31, L10101. |
| Kiladis, G. N., K. H. Straub, and P. T. Haertel, 2005:Zonal and vertical structure of the Madden-Julian oscillation. J. Atmos. Sci., 62(8), 2790-2809. |
| Kim, D., K. W. Sperber, D. Stern, et al., 2009: Ap-plication of MJO simulation diagnostics to climate models. J. Climate, 22(23), 6413-6436. |
| Knutson, T. R., and K. M. Weickmann, 1987: 30-60 dayatmospheric oscillations: Composite life cycles of convection and circulation anomalies. Mon. Wea. Rev., 115(7), 1407-1436. |
| Krishnamurti, T. N., 1985: Summer monsoon experi-ment—A review. Mon. Wea. Rev., 113(9), 1590-1626. |
| —-, and D. Subrahmanyam, 1982: The 30-50-day mode at 850 mb during MONEX. J. Atmos. Sci., 39(9),2088-2095. |
| —-, D. R. Chakraborty, N. Cubukcu, et al., 2003: A mechanism of the MJO based on interactions in the frequency domain. Quart. J. Roy. Meteor. Soc.,129(593), 2559-2590. |
| Lau, N.-C., and K.-M. Lau, 1986: The structure and propagation of intraseasonal oscillation appearing in a GFDL general circulation model. J. Atmos. Sci.,43(19), 2023-2047. |
| Lau, K.-H., and N.-C. Lau, 1990: Observed structure and propagation characteristics of tropical summer-time synoptic-scale disturbances. Mon. Wea. Rev.,118(9), 1888-1993. |
| Lau, K.-M., and P. H. Chan, 1986: Aspects of the 40-50-day oscillation during the northern summer as inferred from outgoing longwave radiation. Mon. Wea. Rev., 114(7), 1354-1367. |
| —-, and L. Peng, 1987: Origin of low frequency (in-traseasonal) oscillation in the tropical atmosphere. Part I: The basic theory. J. Atmos. Sci., 44(6),950-972. |
| —-, and C.-H. Sui, 1997: Mechanisms of short-term sea surface temperature regulation: Observations dur-ing TOGA-COARE. J. Climate, 10(3), 465-472. |
| —-, and D. E. Waliser, 2005: Intraseasonal Variability of the Atmosphere-Ocean Climate System. Springer, Heidelberg, Germany, 474 pp. |
| Lawrence, D. M., and P. J. Webster, 2002: The bo-real summer intraseasonal oscillation: Relationship between northward and eastward movement of con-vection. J. Atmos. Sci., 59(9), 1593-1606. |
| Li Chongyin and Liao Qinghai, 1996: Behavior of cou-pled modes in a simple nonlinear air-sea interaction model. Adv. Atmos. Sci., 13(2), 183-195. |
| —-, Cho Han-Ru, and Wang Jough-Tai, 2002: CISK Kelvin wave with evaporation-wind feedback and air-sea interaction—A further study of tropical in-traseasonal oscillation mechanism. Adv. Atmos. Sci., 19(3), 379-389. |
| Li, T., and B. Wang, 1994a: The influence of sea surface temperature on the tropical intraseasonal oscilla-tion: A numerical study. Mon. Wea. Rev., 122(10),2349-2362. |
| —-, and —-, 1994b: A thermodynamic equilibrium cli-mate model for monthly mean surface winds and precipitation over the tropical Pacific. J. Atmos. Sci., 51(11), 1372-1385. |
| —-, and —-, 2005: A review on the western North Pacific monsoon: Synoptic-to-interannual variabili-ties. Terrestrial, Atmospheric and Oceanic Sciences,16(2), 285-314. |
| —-, and C. Zhou, 2009: Planetary scale selection of theMadden-Julian oscillation. J. Atmos. Sci., 66(8),2429-2443. |
| —-, F. Tam, X. H. Fu, et al., 2008: Causes of the in-traseasonal SST variability in the tropical Indian Ocean. Atmosphere-Ocean Science Letters, 1, 18-23. |
| Liebmann, B., H. H. Hendon, and J. D. Glick, 1994: The relationship between tropical cyclones of the western Pacific and Indian oceans and the Madden-Julian oscillation. J. Meteor. Soc. Japan, 72, 401-412. |
| Lin, A.-L., T. Li, X. H. Fu, et al., 2011: Effects of air-sea coupling on the boreal summer intraseasonal oscilla-tions over the tropical Indian Ocean. Climate Dyn.,37(11-12), 2303-2322. |
| Lin, J.-L., G. N. Kiladis, B. E. Mapes, et al., 2006: Tropical intraseasonal variability in 14 IPCC AR4 climate models. Part I: Convective signals. J. Cli-mate, 19(12), 2665-2690. |
| Lindzen, R. S., and S. Nigam, 1987: On the role of sea surface temperature gradients in forcing low-level winds and convergence in the tropics. J. Atmos. Sci., 44(17), 2418-2436. |
| Liu, F., and B. Wang, 2012: A model for the interaction between the 2-day waves and moist Kelvin waves. J. Atmos. Sci., 69(2), 611-625. |
| —-, G. Huang, and L. C. Feng, 2012: Critical roles of convective momentum transfer in sustaining the multi-scale Madden-Julian oscillation. Theor. Appl. Climatol., 108(3-4), 471-477. |
| Lo, F., and H. H. Hendon, 2000: Empirical extended-range prediction of the Madden-Julian oscillation. Mon. Wea. Rev., 128(7), 2528-2543. |
| Madden, R. A., and P. R. Julian, 1971: Detection of a40-50 day oscillation in the zonal wind in the tropi-cal Pacific. J. Atmos. Sci., 28(5), 702-708. |
| —-, and —-, 1972: Description of global-scale circula-tion cells in the tropics with a 40-50-day period. J. Atmos. Sci., 29(6), 3138-3158. |
| —-, 1986: Seasonal variations of the 40-50-day oscillation in the tropics. J. Atmos. Sci., 43(24), 3138-3158. |
| —-, and P. R. Julian, 1994: Observations of the 40-50-day tropical oscillation—A review. Mon. Wea. Rev., 122(5), 814-837. |
| Majda, A. J., and J. A. Biello, 2004: A multiscale model for tropical intraseasonal oscillations. Proc. Natl. Acad. Sci., 101(14), 4736-4741. |
| —-, and S. N. Stechmann, 2009: A simple dynamical model with features of convective momentum trans-port. J. Atmos. Sci., 66(2), 373-392. |
| Maloney, E. D., 2009: The moist static energy budget of a composite tropical intraseasonal oscillation in a climate model. J. Climate, 22(3), 711-729. |
| —-, and D. L. Hartmann, 1998: Frictional moisture convergence in a composite life cycle of the Madden-Julian oscillation. J. Climate, 11, 2387-2403. . |
| —-, and —-, 2000b: Modulation of hurricane activity in the Gulf of Mexico by the Madden-Julian oscillation. Science, 287(5460), 2002-2004. |
| —-, and —-, 2001: The Madden-Julian oscillation, barotropic dynamics, and North Pacific tropical cyclone formation. Part I: Observations. J. Atmos. Sci., 58, 2545-2558. |
| —-, and M. J. Dickinson, 2003: The intraseasonal os-cillation and the energetics of summertime tropical western North Pacific synoptic-scale disturbances. J. Atmos. Sci., 60(17), 2153-2168. |
| —-, and A. H. Sobel, 2004: Surface fluxes and ocean coupling in the tropical intraseasonal oscillation. J. Climate, 17(22), 4368-4386. |
| Mao, J. Y., and G.-X. Wu, 2006: Intraseasonal variations of the Yangtze rainfall and its related atmospheric circulation features during the 1991 summer. Cli-mate Dyn., 27(7-8), 815-830. |
| —-, Z. Sun, and G.-X. Wu, 2010: 20-50-day oscillation of summer Yangtze rainfall in response to intraseasonal variations in the subtropical high over the western North Pacific and South China Sea. Climate Dyn.,34, 747-761. |
| Matthews, A. J., 2000: Propagation mechanism for the Madden-Julian oscillation. Quart. Roy. Meteor. Soc., 126(569), 2637-2651. |
| —-, 2008: Primary and successive events in the Madden-Julian oscillation. Quart. J. Roy. Meteor. Soc.,134(631), 439-453. |
| Mo, K. C., 2000: Intraseasonal modulation of summer precipitation over North America. Mon. Wea. Rev.,128(5), 1490-1505. |
| Moncrieff, M. W., 2004: Analytic representation of the large-scale organization of tropical convection. J. Atmos. Sci., 61, 1521-1538. |
| Moskowitz, B. M., and C. S. Bretherton, 2000: An analy-sis of frictional feedback on a moist equatorial Kelvin mode. J. Atmos. Sci., 57(13), 2188-2206. |
| Murakami, T., 1980: Empirical orthogonal function anal-ysis of satellite-observed outgoing longwave radia-tion during summer. Mon. Wea. Rev., 108(2),205-222. |
| —-, and T. Nakazawa, 1985: Tropical 45-day oscillations during the 1979 Northern Hemisphere summer. J. Atmos. Sci., 42(11), 1107-1122. |
| Myers, D., and D. E. Waliser, 2003: Three-dimensionalwater vapor and cloud variations associated with the Madden-Julian oscillation during Northern Hemi-sphere winter. J. Climate, 16, 929-950. |
| Nakazawa, T., 1988: Tropical super clusters within in-traseasonal variations over the western Pacific. J. Meteor. Soc. Japan, 66, 823-839. |
| Neelin, J. D., I. M. Held, and K. H. Cook, 1987:Evaporation-wind feedback and low-frequency vari-ability in the tropical atmosphere. J. Atmos. Sci.,44(16), 2341-2348. |
| Nitta, T., 1987: Convective activities in the tropical western pacific and their impact on the Northern-Hemisphere summer circulation. J. Meteorol. Soc. Japan, 65, 373-390. |
| Pan, L.-L., and T. Li, 2008: Interactions between thetropical ISO and midlatitude low-frequency flow.Climate Dyn., 31(4), 375-388. |
| Ray, P., C. D. Zhang, J. Dudhia, et al., 2009: A numerical case study on the initiation of the Madden-Julian oscillation. J. Atmos. Sci., 66(2), 310-331. |
| Saha, S., and Coauthors, 2006: The NCEP climate fore-cast system. J. Climate, 19, 3483-3517. |
| Salby, M. L., R. Garcia, and H. H. Hendon, 1994: Planetary-scale circulations in the presence of cli-matological and wave-induced heating. J. Atmos. Sci., 51, 2344-2367. |
| Seo, K.-H., and K.-Y. Kim, 2003: Propagation andinitiation mechanism of the Madden-Julian oscil-lation. J. Geo. Res., 108, NO. D13, 4384, doi:10.1029/2002JD002876. |
| Shinoda, T., and H. H. Hendon, 1998: Mixed layer mod-eling of intraseasonal variability in the tropical west-ern Pacific and Indian oceans. J. Climate, 11(10),2668-2685. |
| Shukla, J., T. N. Palmer, R. Hagedorn, et al., 2010: To-ward a new generation of world climate research and computing facilities. Bull. Amer. Meteor. Soc.,91(10), 1407-1412. |
| Slingo, J. M., K. R. Sperber, J. S. Boyle, et al., 1996: Intraseasonal oscillation in 15 atmospheric general circulation models: Results from an AMIP diagnos-tic subproject. Climate Dyn., 12(5), 325-357. |
| —-, D. P. Rowell, K. R. Sperber, et al., 1999: On the predictability of the interannual behaviour of the Madden-Julian oscillation and its relationship with El Niño. Quart. J. Roy. Meteor. Soc., 125, 583-609. |
| Sobel, A. H., and E. D. Maloney, 2000: Effect of ENSO and the MJO on western North Pacific tropical cy-clones. Geophys. Res. Lett., 27(12), 1739-1742. |
| —-, and —-, 2013: Moisture modes and the eastward propagation of the MJO. J. Atmos. Sci., 70(1),187-192. |
| Sperber, K. R., 2003: Propagation and the vertical struc-ture of the Madden-Julian oscillation. Mon. Wea. Rev., 131(12), 3018-3037. |
| —-, and T. N. Palmer, 1996: Interannual tropical rainfall variability in general circulation model simulations associated with the atmospheric model intercompar-ison project. J. Climate, 9, 2727-2750. |
| —-, J. M. Slingo, P. M. Inness, et al., 1997: On the maintenance and initiation of the intraseasonal os-cillation in the NCEP/NCAR reanalysis and in the GLA and UKMO AMIP simulations. Climate Dyn.,13(11), 769-795. |
| Stephens, G. L., P. J. Webster, R. H. Johnson, et al.,2004: Observational evidence for the mutual regu-lation of the tropical hydrological cycle and tropical SST. J. Climate, 17(11), 2213-2224. |
| Straub, K. H., and G. N. Kiladis, 2003: Interactions be-tween the boreal summer intraseasonal oscillation and higher-frequency tropical wave activity. Mon. Wea. Rev., 131(5), 945-960. |
| Takaya, K., and H. Nakamura, 2001: A formulation of a phase-independent wave-activity flux for stationary and migratory quasigeostrophic eddies on a zonally varying basic flow. J. Atmos. Sci., 58(6), 608-627. |
| Takayabu, Y. N., and T. Nitta, 1993: 3-5 day period dis-turbances coupled with convection over the tropical Pacific Ocean. J. Meteor. Soc. Japan, 71, 221-246. |
| Vecchi, G. A., and D. E. Harrison, 2002: Monsoon breaks and subseasonal sea surface temperature variability in the Bay of Bengal. J. Climate, 15(12), 1485-1493. |
| —-, K.-M. Lau, and J.-H. Kim, 1999: The influence of coupled sea surface temperatures on the Madden-Julian oscillation: A model perturbation experi-ment. J. Atmos. Sci., 56, 333-358. |
| —-, R. Murtugudde, and L. E. Lucas, 2003: Indo-Pacific Ocean response to atmospheric intrasea-sonal variability. Part Ⅰ: Austral summer and the Madden-Julian oscillation. J. Geophys. Res-Oceans,108(C5), 3160, doi: 10.1029/2002JC001620. |
| Wang, B., 1988: Dynamics of tropical low-frequency waves: An analysis of the moist Kelvin wave. J. Atmos. Sci., 45(14), 2051-2065. |
| —-, and H. Rui, 1990a: Synoptic climatology of transienttropical intraseasonal convection anomalies, 1975-1985. Meteor. Atmos. Phys., 44(1-4), 43-61. |
| —-, and —-, 1990b: Dynamics of the coupled moist Kelvin-Rossby wave on an equatorial β-plane. J. Atmos. Sci, 47(4), 397-413. |
| —-, and T. Li, 1993: A simple tropical atmosphericmodel of relevance to short-term climate variation.J. Atmos. Sci., 50, 260-284. |
| —-, and T. Li, 1994: Convective interaction with boundary-layer dynamics in the development of a tropical intraseasonal system. J. Atmos. Sci.,51(11), 1386-1400. |
| —-, and X. Xie, 1998: Coupled modes of the warm pool climate system. Part I: The role of air-sea interac-tion in maintaining Madden-Julian oscillation. J. Climate, 11(8), 2116-2135. |
| —-, J.-Y. Lee, J. Shukla, et al., 2009: Advance andprospectus of seasonal prediction: Assessment of the APCC/CliPAS 14-model ensemble retrospec-tive seasonal prediction (1980-2004). Climate Dyn.,33(1), 93-117. |
| —-, and F. Liu, 2011: A model for scale interaction in the Madden-Julian oscillation. J. Atmos. Sci.,68(11), 2524-2536. |
| Wang, L., T. Li, T. Zhou, et al., 2013: Origin of the intraseasonal variability over the North Pacific in boreal summer. J. Climate, 26(4), 1211-1229. |
| Weickmann, K. M., 1983: Intraseasonal circulation andoutgoing longwave radiation modes during North-ern Hemisphere winter. Mon. Wea. Rev., 111(9),1838-1858. |
| —-, G. R Lussky, and J. E. Kutzbach, 1985: Intrasea-sonal (30-60 day) fluctuations of outgoing longwave radiation and the 250-mb streamfunction during northern winter. Mon. Wea. Rev., 113(6), 941-961. |
| Wheeler, M., and H. H. Hendon, 2004: An all-season real-time multivariate MJO index: Development of an index for monitoring and prediction. Mon. Wea. Rev., 132, 1917-1932. |
| Wu, M. L. C., S. D. Schubert, M. J. Suarez, et al., 2005: Seasonality and meridional propagation of the MJO. J. Climate, 19(10), 1901-1921. |
| Yanai, M., S. Esbensen, and J.-H. Chu, 1973: Determi-nation of bulk properties of tropical cloud clusters from large-scale heat and moisture budgets. J. At-mos. Sci., 30, 611-627. |
| Yang Hui and Li Chongyin, 2003: The relation between atmospheric intraseasonal oscillation and summer severe flood and drought in the Changjiang-Huaihe River basin. Adv. Atmos. Sci., 20(4), 540-553. |
| Yang, J, B. Wang, B. Wang, et al., 2010: Biweekly and 21-30-day variations of the subtropical summer monsoon rainfall over the lower reach of the Yangtze River basin. J. Climate, 23(5), 1146-1160. |
| Yasunari, T., 1979: Cloudiness fluctuation associated with the Northern Hemisphere summer monsoon. J. Meteor. Soc. Japan, 57, 227-242. |
| —-, 1980: A quasi-stationary appearance of 30-40 day period in the cloudiness fluctuation during summer monsoon over India. J. Meteor. Soc. Japan, 58,225-229. |
| Zhang, C., 2005: Madden-Julian oscillation. Rev. Geo-phys., 43, RG2003, doi: 10.1029/2004RG000158. |
| Zhao, C.-B., T. Li, and T. Zhou, 2013: Precursor signals and processes associated with MJO initiation over the tropical Indian Ocean. J. Climate, 26, 291-307. |
| Zheng, Y., D. E. Waliser, W. Stern, et al., 2004: The role of coupled sea surface temperatures in the sim-ulation of the tropical intraseasonal oscillation. J. Climate, 17, 4109-4134. |
| Zhou C., and T. Li, 2010: Upscale feedback of tropi-cal synoptic variability to intraseasonal oscillations through the nonlinear rectification of the surface latent heat flux. J. Climate, 23(21), 5738-5754. |
| Zhu, C. W., T. Nakazawa, J. Li, et al., 2003: The 30-60 day intraseasonal oscillation over the western North Pacific Ocean and its impacts on summer flooding in China during 1998. Geophys. Res. Lett., 30(18),1952, doi: 10.1029/2003GL017817. |
| Zhu, W., T. Li, X. Fu, et al., 2010: Influence of the mar-itime continent on the boreal smmer intraseasonal oscillation. J. Meteor. Soc. Japan, 88, 395-407. |
| Chang, and H. Lim, 1988: Kelvin-wave CISK: A possible mechanism for the 30-50-day oscillation. J. Atmos. Sci., 45(11), 1709-1720.. |
| Chao, W. C., and B. Chen, 1999: On the role of sur-face friction in tropical intraseasonal oscillation. Preprints, 23-d Conf. on Hurricanes and Tropical Meteorology, Vol. Ⅱ, Dallas, TX, Amer. Meteor. Soc., 815-818. |
| Maloney , and Hartmann, 2000a: Modulation of eastern North Pa-cific hurricanes by the Madden-Julian oscillation. J. Climate, 13(9), 1451-1460. |
| Hendon, and M. L. Salby, 1994: The life cycle of Madden-Julian oscillation. J. Atmos. Sci., 51, 2207-2219. |
| Waliser, 2006: Intraseasonal Variability. Asian Monsoon, B. Wang, Ed., Springer, Heidelberg, Germ, 787 pp. |