 2013, Vol. 28
The Chinese Meteorological Society
Article Information
- WU Hui, ZHAI Panmao. 2013.
- Changes in Persistent and Non-Persistent Flood Season Precipitation over South China During 1961-2010
- J. Meteor. Res., 28(6): 788-798
- http://dx.doi.org/10.1007/s-13351-013-0613-x
Article History
- Received June 20, 2013
- in final form September 22, 2013


2 State Key Laboratory of Severe Weather, Chinese Academy of Meteorological Sciences, Beijing 100081
Changes in climate extremes have attracted increasing attention during recent decades because extreme events often exert a greater influence on natural and human ecosystems than mean climate(Katz and Brown, 1992; Aguilar et al., 2009). Daily temperature and precipitation data have been widely usedto study changes in regional climate extremes sincethe late 1990s. Analysis of these daily observationshas revealed important trends(Karl and Easterling, 1999; Zhai et al., 1999). Alexander et al.(2006)recently analyzed changes in temperature and precipitation extremes on global scale. IPCC(2007)reportedthat precipitation increased significantly between 1900 and 2005 over the eastern parts of North and SouthAmerica, northern Europe, and northern and centralAsia, while decreased over the Sahel, the Mediterranean, southern Africa, and parts of southern Asia. The frequency of heavy precipitation events has likelyincreased over most areas during the last 50 years, ashas the proportion of total rainfall that occurs in heavyprecipitation events.
China is located in the East Asian monsoon region, where the characteristics of changes in precipitation vary greatly by location. Many previous studies have discussed the possible causes of precipitationchanges in China(e. g., Yu et al., 2004; Yu and Zhou, 2007; Zhou et al., 2009). Yu et al.(2004)ascribedsome changes in precipitation over China to a weakening of the summer monsoon over East Asia, including changes in the three-dimensional large-scale tropospheric circulation and upper troposphere temperature. Yu and Zhou(2007) and Zhou et al.(2009)pointed out that this weakening of the East Asiansummer monsoon is part of an interdecadal variationin climate. This interdecadal signal exists throughout the year but is most robust in spring and summer. Changes in extreme precipitation are substantially different between northern and southern China(Zhai et al., 1999, 2005, 2007; Yan and Yang, 2000; Qian et al., 2007; Ren et al., 2010). Although the trend intotal precipitation over all of China was small from1951 to 2000, precipitation decreased significantly overthe southern part of Northeast China, North China, and Sichuan basin, while it increased significantly overwestern China, the Yangtze River valley, and alongthe southeastern coast. The number of rainy days hasdecreased substantially in most parts of China, eventhough the precipitation intensity has increased(Zhai et al., 2005).
Studies on changes in precipitation events of different intensities indicate that the increase in total precipitation from 1960 to 2003 was mainly attributableto an increase in extreme precipitation, while the decrease in the number of rainy days was due to a reduction in the occurrence frequency of very light rain. The ratio of extreme precipitation to total precipitation increased over most areas of China(Min and Qian, 2008). A significant increase in heavy precipitation was the primary driver of the increase in totalprecipitation between 1957 and 2004(Wang and Zhai, 2008). Bai et al.(2007)showed significant decreasesin the number of days during wet spells in NorthChina, central China, and Southwest China between1953 and 2003. Meanwhile, the amount of annual precipitation occurring during wet spells decreased significantly in North China, eastern Northeast China, and eastern Southwest China. Huang et al.(2011)reported that the number of precipitation events withdurations longer than 5 days has reduced significantlysince 2000, while continuous precipitation events withdurations of 2 or 3-4 days have become more frequentduring the Meiyu season in the Yangtze-Huai Rivervalley.
The Yangtze River valley and South China arethe parts of China most affected by persistent heavyprecipitation. In the Yangtze River valley, these persistent heavy precipitation events occur mostly duringthe Meiyu season from mid June to mid July(Chen, 2004; Ding et al., 2007). In South China, the flood season lasts long enough that it can be divided into twosub-periods: the early flood season(EFS; April-June) and the late flood season(LFS; July-September). Precipitation during the EFS is strongly related to largescale westerly frontal systems, low-level jet, and southern trough. Rainfall during the LFS is principally attributable to tropical weather systems such as the Intertropical Convergence Zone(ITCZ) and tropical cyclones(Wu et al., 1990). Changes in the climatologyof extreme precipitation events over South China havebeen noticed. The results of recent studies have indicated that five out of six sub-regions of South Chinahave experienced significant increases in the frequencyof extreme precipitation during summer(Lu et al., 2010). The number of torrential rain days in SouthChina has also increased slightly during both the EFS and the LFS(Wu et al., 2011).
Persistent precipitation(PP)represents precipitation that occurs during wet spells. Non-persistentprecipitation(NPP)represents all other precipitation, and provides an additional perspective on changes inthe water cycle. It is therefore helpful to analyze bothmetrics to more fully underst and changes in the climatological features of extreme precipitation and precipitation as a whole. This study provides an analysis ofthe changes in PP and NPP events over South Chinaduring the flood season using by daily rainfall data. It will help to underst and how and why extreme precipitation has changed in South China. The paperis organized as follows. We introduce the data and methodology in Section 2, present the features of and changes in the climatologies of PP and NPP in Section3, and discuss the implications of the results in Section4. 2. Data and methods2. 1 Data
The precipitation data used in this study come from observations of daily rainfall at 756 surface sta-tions in China. These data were collected and screenedfor quality by the National Meteorological Information Center of the China Meteorological Administration(CMA). The analysis is based on data taken between 1961 and 2010 at 63 stations spaced approximately uniformly across South China in GuangdongProvince, Hainan Province, Guangxi Region, and theareas of Fujian Province south of 26°N. Atmosphericreanalysis data(including relative humidity, temperature, and winds at 500 and 850 hPa)are taken fromthe NCEP/NCAR reanalysis from 1968 to 2010. TheNCEP/NCAR reanalysis data are currently availablefrom January 1948; however, we have chosen to limitthe focus period because the quality of the reanalysisover Asia may be low prior to 1968(Yang et al., 2002). 2. 2 Methods
Precipitation events are classified as either PP orNPP based on the definitions applied by Martin-Vide and Gomez(1999) and Tolika and Maheras(2005). APP event is defined as any event with daily rainfall≥ 0. 1 mm over duration of at least 3 days. All otherrainfall events are classified as NPP events. The earlyflood season(EFS)is defined as the period from Aprilto June, while the late flood season(LFS)is definedas the period from July to September(Li et al., 2002). The ratio of the precipitation amount during a givenperiod to the total precipitation amount over the floodseason(April-September)is referred to as the contribution of this period.
The climate change signals in precipitation areevaluated as linear trends using Kendall's tau(Sen, 1968; Zhai et al., 2005). Possible autocorrelation inthe time series is removed using an iterative procedure introduced by Zhang et al.(2000) and refinedby Wang and Swail(2001). Trends are assessed forstatistical significance at the 5% level.
The Morlet wavelet analysis technique(Torrence and Compo, 1998)is used to analyze the characteristics of variations in the time series of both types ofprecipitation during the flood season. The abrupt climatic change test for precipitation is conducted withboth Mann-Kendall and Student's t-test. The lattertest is applied to 11 shorter time series of length 5-15yr(Fu and Wang, 1992).
Vertical gradients in pseudo-equivalent potentialtemperatures between lower(850 hPa) and upper(500hPa)levels over South China are used to define theatmospheric instability. The atmosphere is consideredconvectively unstable when Δθse = θse850 - θse500 isgreater than 0. 3. Climatology and trends of persistent and non-persistent precipitation in flood season3. 1 Climatology
Most of the rainfall over South China occurs asPP(Fig. 1), with contributions to total monthlyprecipitation ranging from 67%(December)to 88. 5%(June). The PP during the EFS represents 42. 4% ofthe total flood season precipitation, while PP duringthe LFS contributes 41. 3%.
 |
| Fig. 1. Monthly variations of total precipitation(TP), persistent precipitation(PP), and non-persistent precipitation(NPP)over South China. The ratios of PP and NPP to TP are also shown. |
As in many monsoon regions, there is a sharppeak in the annual cycle of total precipitation(Zhou et al., 2008), but monthly mean PP and NPP amountsboth peak twice during the year over South China. The main peak of PP occurs in June while that ofNPP occurs in May. The secondary peaks of bothtypes of precipitation occur in August. The annualcycle of precipitation over South China is similar tothe annual cycle of wet spells presented by Bai et al.(2007). 3. 2 Climate variations3. 2. 1 Interannual variability
Wavelet analysis reveals not only the local features of precipitation but also its periodic variations. This is useful for underst and ing the detailed characteristics of how and why precipitation varies. Bothtypes of precipitation principally vary on periods of2-5 yr during flood season in South China, but theirchanges are not necessarily consistent. PP oscillatedon a quasi-2-yr cycle during the early and mid 1970sbut on a quasi-4-yr cycle after the 1990s(Fig. 2a). NPP oscillated on a quasi-2-yr cycle from the mid1960s to the mid 1970s and a quasi-5-yr cycle afterthe 1990s(Fig. 2c). This latter oscillation was accompanied by an increase in the NPP amount after the1990s(Fig. 2b). The synoptic systems affecting precipitation are different during the EFS and the LFS inSouth China, so we have also applied the wavelet analysis technique to both types of precipitation duringdifferent sub-periods of the flood season(figure omitted). The oscillations in PP and NPP averaged overthe full flood season were more similar to those duringthe EFS. Variations in these two types of precipitationduring the flood season in South China were influencedprimarily by variability on interannual timescales, especially the variability that affected precipitation dur-ing the EFS.
 |
| Fig. 2.(a, c)Wavelet power spectra and (b)time series of PP(top) and NPP(bottom)amounts during flood seasonin South China. In the wavelet power spectrum maps(a, c), contours indicate the wavelet power spectra and shadingindicates areas significant at the 95% confidence level; dotted lines mark the areas of the spectra in°uenced by edgeeffects. |
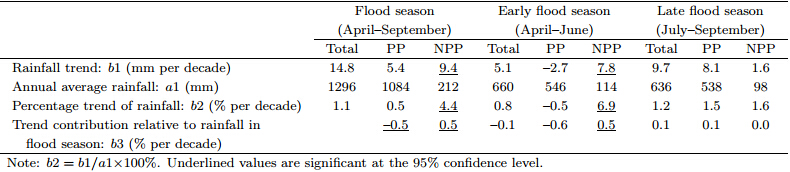
Trends in both types of precipitation amount havebeen calculated and are presented in this section. Thearea-averaged amount of PP during flood season inSouth China increased weakly at a rate of 5. 4 mm(approximately 0. 5%)per decade between 1961 and 2010. The amount of NPP increased more substantially, at arate of 9. 4 mm(approximately 4. 4%)per decade. Table 1 lists the characteristics of the trends in PP and NPP for the full flood season, EFS, and LFS.
Area-averaged PP during the EFS in South Chinadecreased slightly at a rate of -2. 7 mm(approximately-0. 5%)per decade, while NPP during the EFS increased significantly at a rate of 7. 8 mm(approximately 6. 9%)per decade. Precipitation during EFS and LFS varied on both interannual and interdecadaltimescales(Fig. 3). PP during EFS was generallysmaller in the early 1960s and between the mid 1980s and the early 2000s. These periods include particularly dry years such as 1963 and 1995(the lowest valuewas 257. 7 mm in 1963). PP was relatively abundantfrom the mid 1970s to the early 1980s and in the mid and late 2000s, with very wet years in 1973 and 2008(the peak value was 766. 4 mm in 1973). NPP duringthe EFS was relatively small during the early 1960s tothe early 1990s, and then increased substantially afterthe 1990s.
 |
| Fig. 3. Time series of area-averaged PP(filled circles) and NPP(empty circles)during the early flood season(EFS)inSouth China from 1961 to 2010. The thin solid and thickdash-dotted lines represent binomial 11-point smoothing ofthe PP and NPP time series, respectively. |
Both types of rainfalls increased weakly duringthe LFS in South China since 1961(Fig. 4), withPP increasing at a rate of 8. 1 mm(about 1. 5%)perdecade and NPP increasing at a rate of 1. 6 mm(approximately 1. 6%)per decade. PP was relatively lightfrom the early 1960s to the early 1970s and from theearly 1980s to the early 1990s(with a minimum of338. 8 mm in 1989), and was relatively abundant fromthe mid 1970s to the early 1980s and from the mid1990s to the early 2000s(with a maximum of 844. 7mm in 1994). NPP was relatively abundant in theearly and mid 1960s and after the 1980s, with a deficitfrom the late 1960s to the early 1980s(with a minimum in 1976 and a maximum in 2008).
 |
| Fig. 4. As in Fig. 3, but for the late flood season(LFS). |
Analysis using the Mann-Kendall test and Student's t-test indicates that abrupt climate changepoints occurred in 1992 for NPP over the full floodseason and during the EFS. No abrupt climate changepoints were identified for NPP during the LFS or forPP during any sub-period of the flood season.
The significant increase in precipitation associated with NPP events during the flood season since1992 was mainly due to an increase in NPP duringthe EFS. By contrast, the slight increase in precipitation associated with PP events during the flood seasonresulted from a weak increase in PP during the LFS.
Trends in the two types of precipitation overSouth China between 1961 and 2010 had distinct spatial patterns. PP during the EFS had not changedmuch over most areas of South China(Fig. 5a). NPPduring the EFS changed significantly at nearly 20% ofobservation stations, particularly in the coastal areasof Guangdong and Fujian provinces. PP during theLFS increased significantly along part of the southerncoast of Fujian Province, but decreased in some areasof Guangxi Region(Fig. 5b). Significant increases inNPP during the LFS occurred at only 8% of stations, mainly along the Guangxi coast, in the mountainouscentral district of Hainan, and in southern GuangdongProvince.
 |
| Fig. 5. Spatial distribution of trends in PP(black) and NPP(red)over South China during the(a)EFS and (b)LFS.Empty circles indicate the lack of a significant trend. Solid circles indicate a significant increasing trend and solid squares indicate a significant decreasing trend. |
Changes in the relative contributions of each typeof precipitation to the total precipitation amount areshown in Fig. 6. The relative contribution of PP tototal flood season precipitation has decreased significantly since 1961, at a rate of approximately -0. 5% perdecade(Table 1). The relative contribution of NPPhas accordingly increased at a rate of approximately0. 5% per decade. The contribution of EFS PP to totalflood season precipitation decreased weakly over thisperiod, while that of EFS NPP increased significantlyat a rate of approximately 0. 5% per decade(Fig. 6a). Changes in the relative contributions of both types ofLFS precipitation were small during this period(Fig. 6b).
 |
| Fig. 6. Relative contributions of persistent and non-persistent precipitation to total flood season precipitation duringthe(a)EFS and (b)LFS from 1961 to 2010. Linear trends in the relative contributions of PP and NPP are shown assolid and dotted lines, respectively. |
 |
The above analysis indicates that EFS NPP increased substantially over South China during 1961-2010. This change is one of the most important components of the change in total flood season precipitation over South China and is examined further in thissection.
Precipitation over South China during the EFS ismainly frontal precipitation in origin before the outbreak of the South China Sea Monsoon(SCSM). Thissituation changes after the outbreak of the SCSM, when the dominant form of precipitation in SouthChina is convective precipitation associated with thesummer monsoon. The mean climatological onset datefor summer monsoon rainfall over South China hasbeen derived as 24 May(Zheng et al., 2006). Wetherefore speculate that the significant increase in EFSNPP over South China has been caused primarily byan increase in frontal and /or convective precipitationduring the EFS.
Frontal rainfall is associated with the convergenceof cold air from higher latitudes and warm air fromlower latitudes. We select northerly wind as an indicator of cold air incursions following Yang et al.(2002) and Yao and Yu(2005). As discussed in Section 3. 2. 2, abrupt climate change point occurred in 1992 for NPPduring the EFS. We therefore divide the analysis period into two sub-periods: 1968-1991 and 1992-2010. Figure 7a shows differences in the average EFS meridional winds between these two periods(later minusearlier). It is found that the regions with negativedifferences cover areas from South China to the SouthChina Sea, and the regions with significant changes aremainly over the western part of South China. This result indicates an increase in the supply of cold air fromhigher latitudes and a decrease in the supply of warmair from lower latitudes since 1992. Examination ofa time-latitude cross-section of mean meridional windat 850 hPa averaged over 100°-120°E(figure omitted)also supports the conclusion that northerly windsstrengthened and southerly winds weakened duringthis period, leading to weaker convergence betweencold and warm air over South China. This decreasein convergence was unfavorable for PP, and thereforeenhanced the relative importance of NPP over SouthChina during the EFS.
 |
| Fig. 7.(a)Difference in mean meridional wind(m s-1)at 850 hPa between 1992-2010 and 1968-1991;(b)timeseries of EFS NPP(mm) and 850-hPa meridional wind(m s-1)averaged over South China;(c)spatial distribution ofthe correlation between NPP observed at each station and 850-hPa meridional wind averaged over South China;(d)difference in atmospheric stratification(×10-2 K hPa-1)between 1992-2010 and 1968-1991 in EFS over South China;(e)time series of EFS NPP(mm) and atmospheric stratification(×10-2 K hPa-1)averaged over South China; and (f)spatial distribution of the correlation between NPP observed at individual stations and atmospheric stratificationaveraged over South China. Shaded areas in(a) and (d)indicate statistically significant differences. Red and black dotsin(c) and (f)indicate statistically significant negative and positive correlations, respectively, while empty circles indicateno significant correlation. |
Figure 7a suggests that an increased relative contribution from NPP is associated with a stronger supply of cold, dry air and a weaker supply of warm, moistair to the east of 100°E. By contrast, the years with anincreased relative contribution from PP tend to havea weaker supply of cold, dry air from the north and a stronger supply of warm, moist air from the south(figure omitted). The relative contribution of EFSNPP to total flood season precipitation over SouthChina therefore appears to be closely related to lowlevel meridional winds over South China. The correlation coe°cient between EFS NPP and area-averaged(20. 0°-27. 5°N, 100°-117. 5°E)meridional winds at 850hPa is large(-0. 46) and statistically significant, supporting this conclusion. Linear trend analyses identifysignificant decreases in meridional winds at 850 hPaover South China(Fig. 7b), further confirming thatthe supply of warm, moist air from the south has weakened over this period. Meridional winds over SouthChina and simultaneous NPP at stations in SouthChina are also negatively correlated during the EFS. These correlations are most significant at stations inFujian and Guangdong provinces(Fig. 7c); with aspatial pattern similar to the spatial pattern of trendsin EFS NPP(Fig. 5a).
Convective precipitation is tied to atmosphericstability. Figure 7d shows the spatial distribution ofdifferences in atmospheric stability during the EFS between 1992-2010 and 1968-1991. The atmosphericinstability Δθse(see Section 2. 2)was larger during1992-2010 than during 1968-1991 over most parts ofSouth China. This result suggests that the atmospherewas more convectively unstable after the early 1990s. These differences were most significant(at the 95%confidence level)over the southeastern coast of SouthChina and the South China Sea. During the entireperiod of 1968-2010(Fig. 7e), the area-averaged atmospheric stratification over South China in the EFSbecame significantly less stable(at the 99% confidence level). Atmospheric instability and EFS NPPaveraged over South China were indistinctive positively correlated during this period. The relationshipbetween changes in NPP and the intensification ofconvective instability over the southeastern coast ofSouth China is also reflected in the map of correlationcoe°cient between regionally-averaged Δθse and observed EFS NPP at individual stations in South China(Fig. 7f).
In summary, the significant increase in the importance of NPP during the EFS in South China between1961 and 2010 is mainly attributable to a stronger supply of cold air to South China from the north and aweaker supply of warm, moist air from the south. A reduction in atmospheric stability over South China alsoestablished a favorable background for the increase inNPP. 4. Conclusions and discussion
Precipitation events during the flood season inSouth China have been classified into two types: persistent precipitation(PP) and non-persistent precipitation(NPP). The trends in these two types of precipitation and their relative contributions to total floodseason precipitation have been calculated and presented. Differences in these trends between the earlyflood season(EFS) and late flood season(LFS)havealso been investigated. The characteristics of changesin flood season precipitation over South China between 1961 and 2010 are concluded as follows.
PP is the primary type of precipitation during theflood season in South China; however, PP amountsincreased only slightly over the analysis period, whileNPP amounts increased significantly over the past 50years. These changes are attributable to a significantincrease in NPP amounts during the EFS and a weakincrease in PP amounts during the LFS. The relativecontribution of EFS NPP to total flood season precipitation has increased significantly while the relativecontribution of EFS PP has declined. The relativecontributions of both types of rainfall during LFS tototal flood season precipitation have remained approximately steady. A preliminary investigation into thecauses of the significant increase in EFS NPP overSouth China suggests that the increase was mainlydue to an increased supply of cold air from the north and a reduced supply of warm, moist air from thesouth. A reduction in the stability of the atmosphereover South China also established a favorable background for the increase in NPP.
Precipitation in South China is also strongly affected by tropical cyclone activity. The volume oftropical cyclone precipitation(TCP), the annual frequency of torrential TCP events, and the relativecontribution of TCP to annual precipitation in Chinahave all decreased in recent years(Ren et al., 2006). The number of the tropical cyclones l and ing on thecoastal areas of South China also shows a decreasingtrend(Zhang et al., 2012). The relationship betweenchanges in tropical cyclone activity and changes in PP and NPP over South China requires a further studyin the future.
Acknowledgments: The language editor forthis manuscript is Dr. Jonathon S. Wright.| [1] | Aguilar, E., A. A. Barry, M. Brunet, et al., 2009: Changes in temperature and precipitation extremes in western central Africa, Guinea Conakry, and Zimbabwe, 1955-2006. J. Geophys Res., 114(D2), doi: 10.1029/2008JD011010. |
| [2] | Alexander, L. V., X. Zhang, T. C. Peterson, et al., 2006: Global observed changes in daily climate extremes of temperature and precipitation. J. Geophys. Res., 111(D5), doi: 10.1029/2005JD006290. |
| [3] | Bai, A. J., P . M. Zhai, and X. D. Liu, 2007: Climatology and trends of wet spells in China. Theor. Appl. Climatol., 88, 139-148. |
| [4] | Chen, G. T. J., 2004: Research on the phenomena of Meiyu during the past quarter century: An overview. East Asian Monsoon. World Scientific, 560 pp. |
| [5] | Ding Yihui, Liu Junjie, Sun Ying, et al., 2007: A study of the synoptic-climatology of the Meiyu system in East Asia. Chinese J. Atmos. Sci., 31(6), 1082-1101. (in Chinese) |
| [6] | Fu Congbin and Wang Qiang, 1992: The definition and detection of the abrupt climatic change. Chinese J. Atmos Sci., 16(4), 482-492. (in Chinese) |
| [7] | Huang, D. Q., J. Zhu, and X. Y. Kuang, 2011: Decadal variation of di?erent durations of continuous Meiyu precipitation and the possible cause. Chinese Sci. Bull., 56(4-5), 424-431. |
| [8] | IPCC, 2007: Climate Change 2007: Synthesis Report. Contribution of Working Group I, II and III to the F ourth Assessment Report of the Intergovernmental Panel on Climate Change, Core Writing Team, Pachauri, R. K., and A. Reisinger, Eds., IPCC, Geneva, Switzerland, 104 pp. |
| [9] | Karl, T. R., and D. R. Easterling, 1999: Climate extremes: Selected review and future research directions. Climatic Change, 42, 309-325. |
| [10] | Katz, R. W., and B. G. Brown, 1992: Extreme events in a changing climate: Variability is more important than averages. Climatic Change, 21, 289-302. |
| [11] | Li Jiangnan, Wang Anyu, Meng Weiguang, et al., 2002: The climatological characteristics of precipitation of the presummer rainy reason and second rainy season in Guangdong Province. Acta Scientiarum Naturalium Universitatis Sunyatseni, 41(3), 91-94. (in Chinese) |
| [12] | Lu Hong, He Hui, and Chen Sirong, 2010: Spatiotemporal variation of extreme precipitation frequency in summer over South China in 1961-2008. Chinese Journal of Ecology, 29(6), 1213-1220. (in Chinese) |
| [13] | Martin-Vide, J., and L. Gomez, 1999: Regionalization of Peninsular Spain based on the length of dry spells. Int. J. Climatol., 19, 537-555. |
| [14] | Min Shen and Qian Yongfu, 2008: Trends in all kinds of precipitation events in China over the past 40 years. Acta Scientiarum Naturalium Universitatis Sunyatseni, 47(3), 105-111. (in Chinese) |
| [15] | Qian Weihong, F u Jiaolan, Zhang Weiwei, et al., 2007: Changes in mean climate and extreme climate in China during the last 40 years. Adv. Earth Sci., 22(7), 673-684. (in Chinese) |
| [16] | Ren, F. M., G. X. Wu, W. J. Dong, et al., 2006: Changes in tropical cyclone precipitation over China. Geophys. Res. Lett., 33(20), doi: 10.1029/2006GL027951. |
| [17] | Ren Guoyu, F eng Guolin, and Yan Zhongwei, 2010: Progresses in observation studies of climate extremes and changes in mainland China. Climatic Environ. Res., 15(4), 337-353. (in Chinese) |
| [18] | Sen, P . K., 1968: Estimates of the regression coe±-cient based on Kendall's tau. J. Am. Sat. Assoc., 63(324), 1379-1389. |
| [19] | Tolika, K., and P . Maheras, 2005: Spatial and temporal characteristics of wet spells in Greece. Theor. Appl. Climatol., 81, 71-85. |
| [20] | Torrence, C., and G. P . Compo, 1998: A practical guide to wavelet analysis. Bull. Amer. Meteor. Soc., 79, 61-78. |
| [21] | Wang, X. L., and V. R. Swail, 2001: Changes of extreme wave heights in Northern Hemisphere oceans and related atmospheric circulation regimes. J. Climate, 14(10), 2204-2221. |
| [22] | Wang Xiaoling and Zhai Panmao, 2008: Changes in China's precipitation in various categories during 1957-2004. J. Tr op. Meteor., 24(5), 459-466. (in Chinese) |
| [23] | Wu Hongyu, Du Yaodong, and Qin Peng, 2011: Climate characteristics and variation of rainstorm in South China. Meteor. Mon., 37(l0), 1262-1269. (in Chinese) |
| [24] | Wu Shangsen, Huang Chengchang, and Xue Huixian, 1990: On interannual variation of precipitation during the second rainy season in South China. J. Tr op. Meteor., 6(4), 348-356. (in Chinese) |
| [25] | Yan Zhongwei and Yang Chi, 2000: Geographic patterns of extreme climate changes in China during 1951-1997. Climatic Environ. Res., 5(3), 267-272. (in Chinese) |
| [26] | Yang, S., K. M. Lau, and K. M. Kim, 2002: Variations of the East Asian jet stream and Asian-PacificAmerican winter climate anomalies. J. Climate, 15, 306-325. |
| [27] | Yao Xiuping and Yu Yubin, 2005: Activity of dry cold air and its impacts on Meiyu rain during the 2003 Meiyu period. Chinese J. Atmos. Sci., 29(6), 973-985. (in Chinese) |
| [28] | Yu, R. C., B. Wang, and T. J, Zhou, 2004: Tropospheric cooling and summer monsoon weakening trend over East Asia. Geophys. Res. Lett., 31, L22212, doi: 10.1029/2004GL021270. |
| [29] | —-, and T. J. Zhou, 2007: Seasonality and threedimensional structure of interdecadal change in the East Asian monsoon. J. Climate, 20, 5344-5355. |
| [30] | Zhai, P . M., A. J. Sun, F. M. Ren, et al., 1999: Changes of climate extremes in China. Climatic Change, 42, 203-218. |
| [31] | —-, X. B. Zhang, H. Wan, et al., 2005: Trends in total precipitation and frequency of daily precipitation extremes over China. J. Climate, 18, 1096-1108. |
| [32] | —-, Wang Cuicui, and Li Wei, 2007: A review on study of change in precipitation extremes. Adv. Climate Change Res., 3(3), 144-148. (in Chinese) |
| [33] | Zhang, X. B., L. A. Vincent, W. D. Hogg, et al., 2000: Temperature and precipitation trends in Canada during the 20th century . Atmos.-Oc ean, 38(3), 395-429. |
| [34] | Zhang Junxiang, Liu Xulong, and Gong Qinghua, 2012: Tropical cyclones landing on the coastal areas of South China and related catastrophes over the past 60 years. Tropical Geography, 32(4), 357-363. (in Chinese) |
| [35] | Zheng Bin, Liang Jianyin, Lin Ailan, et al., 2006: F rontal rain and summer monsoon rain during pre-rainy season in South China. Part I: Determination of the division dates. Chinese J. Atmos. Sci., 30(6), 1207-1216. (in Chinese) |
| [36] | Zhou, T. J., L. X. Zhang, and H. M. Li, 2008: Changes in global land monsoon area and total rainfall accumulation over the last half century . Geophys. Res. Lett., 35, L16707, doi: 10.1029/2008GL034881. |
| [37] | —-, D. Y. Gong, J. Li, et al., 2009: Detecting and understanding the multi-decadal variability of the East Asian summer monsoon-Recent progress and state of a?airs. Meteor. Z., 18(4), 455-467. |