 2013, Vol. 28
The Chinese Meteorological Society
Article Information
- WANG Lijun, YIN Yan, YAO Zhanyu, SUN Anping. 2013.
- Microphysical Responses to Catalysis During a Stratocumulus Aircraft Seeding Experiment over the Sanjiangyuan Region of China
- J. Meteor. Res., 28(6): 849-867
- http://dx.doi.org/10.1007/s13351-013-0609-6
Article History
- Received August 31, 2013
- in final form November 6, 2013


2 Key Laboratory for Aerosol-Cloud-Precipitation of China Meteorological Administration, Nanjing University of Information Science & Technology, Nanjing 210044;
3 Laboratory of Weather Modification, Chinese Academy of Meteorological Sciences, Beijing 1000814 Qinghai Meteorological Bureau, Xining 810001
The Sanjiangyuan region is located in the centralQinghai-Tibetan Plateau and contains the headwatersof the Yangtze, Yellow, and Mekong Rivers. Ecologicalchanges in the Sanjiangyuan region have an importantinfluence on the climate and ecological environment ofChina and even the world(Li et al., 2006; Lian et al., 2009). Water vapor convergence and precipitationover the Sanjiangyuan region have decreased gradually in recent decades(Tang et al., 2007; Li et al., 2009). These changes in the hydrological cycle havebeen accompanied by desertification and the continuous increase of desert area in the region(Hu et al., 2011, 2012). The meteorological department of Qinghai Province started seeding clouds in the Sanjiangyuan region in 1997 in an effort to enhance precipitation and improve the ecological environment. In theautumn of 2003, a novel observational experiment inseeding stratiform clouds was conducted with the cooperation of multiple departments. This experimentincluded both an operational aircraft with a new AgIflare seeding generator(Wang et al., 2006; Yao, 2006) and an observational aircraft carrying a Particle Measuring System(PMS). A number of dedicated flightswere conducted during the experiment for operation and detection; however, the flight on 11 October 2003was the only one of these flights with ideal weather and safety conditions for data collection.
The high spatial resolution of the PMS allowsmonitoring of changes in the microphysical structureof clouds after cloud seeding(You, 1994). Internationally, the PMS has mainly been used to study thephysical effects of cloud seeding on cumulus clouds and winter orographic clouds. Experiments in seeding orographic clouds with AgI or dry ice in the Cascade Range(Washington, USA)have yielded good results(Hobbs and Radke, 1975). Stewart and Marwitz(1982)reported that the concentration of precipitationparticles in winter stratiform clouds near the SierraNevada Mountains(California, USA)tends to increasewith the diffusion of catalysts. An increasing numberof cold cloud seeding experiments based on the staticseeding conceptual model were conducted through the1980s. In the United States, experiments over the highplains in eastern Montana(Smith et al., 1984), theRocky Mountain region in western Montana(Super and Heimbach, 1988), and Gr and Mesa in Colorado(Super and Boe, 1988)have all detected evidence ofthe effects of cloud seeding. However, it is dificultto obtain a complete "physical event chain" that istotally identical to the hypothesis(Bruintjes, 1999).Only 2 out of 36 experiments in the Sierra NevadaMountains unequivocally demonstrated the effects ofcloud seeding(Deshler et al., 1990), while ground seeding experiments in the Tushar Mountains(Utah, USA)were unable to prove the physical event chain following seeding(Huggins and Sassen, 1990). Numerousstudies have shown that cloud seeding can only increase precipitation under certain favorable conditions(Reynolds and Dennis, 1986; Reynolds, 1988; Reinking and Meiten, 1989; Super, 1990). In summarizing 40 years of Australian cloud seeding experiments, Ryan and King(1997)concluded that cloud seedingis useless for increasing precipitation in plain environments; however, they also concluded that seeding ofstratiform clouds in mountain regions with updraftscan be effective under limited meteorological conditions. They further proposed that the physical effectiveness of such seeding programs could be best evaluated through the design of a detection plan to determine the area influenced by cloud seeding.
In China, observations of the microphysical effects of cloud seeding were first carried out during theNorthern Stratiform Cloud Rain Enhancement Experiment. Seeding of supercooled stratocumulus cloudsover Xinjiang with dry ice sharply increased the concentration of ice crystals and exhausted the supply ofsupercooled water in the cloud seeding area(Wang et al., 1987; You, 1994). During a cold cloud seeding experiment in Sh and ong Province, Wang and Lei(2003)observed that supercooled liquid water in the diffusionzone was consumed. At the same time, concentrationsof ice and snow crystals increased and the cloud particle spectrum widened. Jin et al.(2007)also observedsharp increases in the concentration of ice crystals and the diameter of raindrops after cloud seeding with liquid CO2, as well as reductions in the concentration ofsupercooled water.
These physical experiments have verified the effects of cloud seeding. On the other h and , it is di°cultto effectively differentiate supercooled water in clouds and underst and its temporal and spatial changes(Bruintjes, 1999). In particular, it is di°cult to distinguishthe phase states of cloud particles on small scales inthe measuring range of the Forward Scattering Spectrometer Probe(FSSP)(You, 1994; Hu, 2001). Mostdescriptions of natural clouds remain qualitative atpresent, and quantitative descriptions(especially accurate ones)remain rare(Guo et al., 2013).
This paper explores the microphysical responsesto cloud seeding in an effective influence area downwind of the cloud seeding aircraft. The cloud seedingoperation was accomplished using a zigzag flight pattern, while the subsequent detection flight followed abackward-forward path through a small area near thetop of a stratocumulus cloud in the Sanjiangyuan region on 11 October 2003. PMS data are used to differentiate the phase states of cloud particles along theflight path. The results provide evidence of the microphysical effects of cloud seeding in the Sanjiangyuanregion.2. Data and method2.1 Observational instrumentation and error analysis
Two new PMSs introduced by the ChineseAcademy of Meteorological Sciences in 2002(Liu et al., 2003)were installed below the wings of a Cheyenneaircraft for the experiment. All probes were systematically calibrated prior to the observation period. Theinstrumentation for the experiment included an FSSP100(abbreviated as FSSP), an OAP-2D-GA2(abbreviated as 2DC), and a King-LWC-5(abbreviated asKing). All instruments were operated with a samplingfrequency of 1 Hz. No precipitation particles were observed in this experiment, so no data were observedby the OAP-2D-GB2.
The FSSP has 15 channels for measuring the concentrations of cloud particles on small scales. The instrument used in this experiment is sensitive to particles with sizes from 2.0 to 47.0 μm with a resolutionof 3 μm. Accordingly, the median diameter Di measured by the FSSP varies from 3.5 μm(for channel i= 1)to 45.5 μm(for channel i = 15). Observations ofparticle size and particle number using the FSSP and 2DC are subject to certain characteristic errors(Zhao et al., 2010). Coelho et al.(2005)showed that errorsin observations of particle diameter using a new generation FSSP were within 3%-7% when particle concentrations did not exceed 500 cm-3. Errors in the FSSPobservations are therefore neglected in this paper.
The 2DC is an extension of the original OAP-2D-C(which had a measurement range of 25-800 μm).This instrument is used for measuring concentrationsof cloud and precipitation particles and obtaining two-dimensional image data. The 2DC has 62 channels and a particle diameter measurement range of 25-1550 μmwith a resolution of 25 μm. The median diameter Djmeasured by the 2DC varies from 30.12 μm(for channel j = 1)to 1550 μm(for channel j = 62). Theconcentrations of small particles(diameters less than125 μm)measured by the 2DC are subject to errors(Baumgardner and Korolev, 1997; Strapp et al., 2001).Korolev et al.(1998)studied the measurement accuracy of the same model as used in this paper, and showed that this probe may overestimate or underestimate the size and omit the concentration of smallparticles(diameters less than 100 μm). The omission rate of particles with a diameter of 25 μm(theminimum resolvable size)exceeded 70%. The theoretical measurement range of channel 1 on the 2DC(25-42.5 μm; D1 = 30.12 μm)overlaps the channels9 through 14 on the FSSP(Di = 27.5, …, 42.5 μm).Accordingly, observations of cloud particle concentrations within this diameter range are duplicated by theFSSP. Considering the deficiencies of the 2DC at smallparticle sizes and the data processing used by previousstudies(McFarquhar and Cober, 2004; McFarquhar et al., 2007), data obtained from channel 1 of the 2DCare ab and oned in this study when data observed bythe FSSP are available in this measurement range. Inother words, only data obtained from 2DC channelswith Dj ≥ 54.88 μm are processed. The concentrations of particles with diameters larger than 1300 μmmeasured by the 2DC are known to be uncertain(McFarquhar et al., 2007). No cloud particles in this sizerange were observed during this experiment, so theseuncertainties do not influence the following analysis.
The King probe is used for measuring cloud liquid water content(LWC), which is referred to below asLWCKing. The measurement range for this instrumentis 0.01-3 g m-3(Tessendorf et al., 2012), with a relative error of ±15%(King et al., 1985). The King probeis considered to be more accurate than other airborneinstruments for measuring LWC(Feind et al., 2000).Proper calibration of the King probe under clear airconditions is important for obtaining accurate measurements of LWC(Feind et al., 2000; Wang et al., 2004).
Comparisons of observations from a King probe and an FSSP in Canada indicate that temporalchanges in LWC observed by these two instrumentsare nearly identical when the FSSP observes only liquid water(Isaac, 1991). Feind et al.(2000)showedthat the King probe may respond to some ice crystalparticles when observing convective storms, resultingin overestimates of LWC. However, McFarquhar et al.(2007)showed that these effects are small in mixedphase clouds that contain mostly supercooled water.The results of a recent wind tunnel test showed thatthe King probe was very accurate for particles with diameters less than 50 μm, but severely underestimatedthe LWC in particles with diameters between 50 and 200 μm(Strapp et al., 2003). During this experiment, cloud particles with diameters exceeding 50 μm wereexclusively in the ice phase(see Section 4.2.1); accordingly, these issues should not influence observationsmade by the King probe during this experiment.2.2 Calculation of microphysical parameters
The total number concentration N and the me and iameter Dm are referred to as concentration and diameter, respectively. N1 and Dm1 represent the concentration and diameter measured by the FSSP, respectively. Similarly, N2 and Dm2 represent the concentration and diameter measured by the 2DC, and N2(>50) and Dm2(>5050)represent the concentration and diameter of particles with diameters greater than 50μm measured by the 2DC. In the latter case, data obtained from channel 1 of the 2DC(D1=30.12 μm)areab and oned, leaving only data obtained from measur-ing channels with Dj > 54:88 μm.
For the FSSP, the calculation of microphysical parameters is as follows(Miles et al., 2000):
N1 is expressed in unit of cm-3 and Dm1 is expressedin unit of μm. Di(also in μm)is the median diameterobserved by the ith measuring channel of the FSSP.ΔDi is the interval covered by each measuring channel, which has a value of 3 μm. n(Di)(unit: cm-3μm-1)is the distribution function of particle concentration across the 15 measuring channels. LWCFSSP isthe LWC as measured by the FSSP in units of g m-3, with ρl the density of liquid water in units of g cm-3.Liquid cloud particles observed within the measurement range of the FSSP are assumed to be sphericaldroplets.
The concentration N2(unit: L-1) and diameter(D2)(unit: μm)measured by the 2DC are calculatedusing formulae similar to Eqs.(1) and (2). Di isreplaced by Dj(unit: μm), the median diameter observed by the jth measuring channel of 2DC(j = 1, …, 62), and the distribution function of particle concentration n(Dj)is expressed in units of L-1 μm-1.The interval covered by each measurement channel(ΔDj)is approximately 25 μm for channels 1-16 and exactly 25 μm for channels 17-62. The concentrationN(> 50) and mean diameter Dm(> 50)are definedsimilarly, but with j = 2, …, 62.Ice Water Content(IWC)is calculated indirectlyusing the distribution function of ice-phase particleconcentrations(n(Dj)) and the median diameter(Dj)in each particle size bin(You et al., 1989; Brown and Francis, 1995; Mitchell, 1996; Heymsfield et al., 2002;McFarquhar et al., 2007):
where a and b are empirical regression coe°cients.2.3 Demarcation of cloud boundaries
The boundaries of the mixed-phase clouds observed in this experiment are defined accordingto the threshold value of LWCFSSP=10-4 g m-3.This threshold value is primarily based on macroobservations and instantaneous cloud particle spectrain the Sanjiangyuan region. It is also supported byobservations of dry layers in cloud systems over central and northern Gansu during the autumn season(Li et al., 2003) and the effective boundary identifiedfor precipitating stratiform clouds over Hebei Province(Zhang et al., 2012).3. Flight conditions and observations of the study area before and after cloud seeding
Examination of the meteorological conditions at500 hPa at 0800 BT(Beijing Time)11 October 2003indicates that the experiment domain was embeddedin a southwesterly flow of warm, moist air associatedwith a frontal groove. Moisture supply conditionsduring the experiment were good. The aircraft flewthrough a pre-selected strong echo zone in the afternoon of 11 October. The experimental domain waschosen based on meteorological radar observations ofthe sky 50 km northwest of Henan Station(34°44'N, 101°36'E; 3500-m elevation) and 60 km southwest ofZeku Station(35°2'N, 101°28'E; 3663-m elevation).The top of the stratocumulus cloud was sampled aftercompleting vertical profiles of the cloud system.
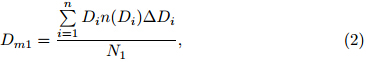
Figure 1 shows the trajectory of the aircraft according to Global Positioning System(GPS)measurements and the horizontal transport of the seeding lineat different times. The four flight path crossings B, D, F, and H are labeled "1" and "2" to indicate the moments when the aircraft passed for the first and secondtime, respectively. The aircraft started seeding usingan AgI flare at point A(16:30:11 BT). Cloud seedingwas conducted as the cloud was observed(the seedingdevice was installed at the end of each aircraft wingbehind the PMS systems, so the observed portion ofthe cloud was not affected by the seeding operation).The seeding flare was turned off at point I(16:47:30BT)after passing through points B1, C, D1, E, F1, G, and H1. The aircraft then commenced an eastwardtrack through the cloud from point H2. B10, C0, D10, F10, G0, and H10 indicate the positions of the air encountered during the original cloud seeding portion ofthe flight at the time the aircraft reached point H2(Fig. 1a) and point B2(Fig. 1b).
 |
| Fig. 1GPS(Global Positioning System)trajectory of the aircraft during the cloud seeding operation(red line) and thesubsequent observational portion of the °ight(blue line). The horizontal transport of air affected during cloud seeding is shown as gray dotted arrows, while the green line indicates the approximate position of that air at the time the aircraft reached(a)point H2 and (b)point B2.. BlackcarboninthefiveicecorescollectedovertheTibetan |
Physical investigation of cloud seeding by aircraftrequires that the detection area be su°ciently small and the time suficiently short. If these conditions arenot met, the interpretation of the observations may become unnecessarily complicated due to the complexityof the environmental wind field, the ice crystal growthrate, the terminal velocity of cloud particles, air massdiffusion, and other factors(Wang and Lei, 2003).These issues may be exacerbated by the large spatialvariability in particle concentrations and the characteristics of particle spectra within the natural cloud(You, 1994). This experiment was conducted within arelatively small area with a horizontal extent of about45£33 km to minimize the influences of "cloud inhmogeneity". The operational and observational phaseswere also conducted within a short time window(19minutes elapsed during the flight from point A to pointH2).
The test area was located in the unstable atmosphere along the leading edge of a cold front. Thecloud system was in a developmental stage with multiple cloud layers overlying the stratocumulus. Thealtitude of cloud seeding portion of the flight was5600 m, with air temperatures of -6.2 to -7.1°C. Encrypted sounding data indicate that the wind direction in this layer was 248° with a wind speed of 16 ms-1. Macroscopic observational data during the flightshow that the aircraft experienced intermittent turbulence with some ice accretion on the front window and wings. The cloud formation thinned with a rift inthe clouds near point E. This rift implies an unstableairflow and abundant supercooled liquid water insidethe cloud. Henan Station observed intermittent precipitation approximately 40 minutes after completionof the flight followed by cumulonimbus cloud precipitation at night. The cumulative precipitation was 6.6mm(including graupel, this converts to a snow depthof approximately 1.0 cm). Cumulative precipitationat Zeku Station was 2.2 mm.
A similar study of aircraft cloud seeding(Yu et al., 2002)indicated that horizontal transport of the AgIseeding agent was primarily dependent on the windfield. The mean diffusion rate observed during thatstudy was approximately 0.1 m s-1. A satellite remotesensing analysis of cloud seeding track showed 80 minof continuous diffusion for a seeding agent within a supercooled stratiform cloud(Rosenfeld et al., 2005; Dai et al., 2006). An indoor experiment(DeMott, 1995) and a numerical simulation study(Liu et al., 2005)indicated that cloud seeding using AgI affects stratiformclouds mainly through slow nucleation processes(suchas contact freezing and immersion freezing). Diffusionof the seeding agent, dose attenuation caused by nucleation, and other complex factors are therefore notconsidered in this paper. The extent and position ofthe affected area is determined solely by calculatinghorizontal transport due to the environmental windfield.
Figure 1 indicates that only a few intervals of theobservational track(point H2 to point J)were directlyaffected by cloud seeding conducted upwind. Whenthe aircraft commenced the observational leg at pointH2(Fig. 1a), the preset observational track betweenpoint H2 and point F2 was only directly affected bycloud seeding conducted along the interval from pointG to point H1. The air sampled between point F2 and point D2 was directly affected by cloud seeding conducted between point F1 and point G, while the airsampled between point D2 and point B2 was primarilyaffected by cloud seeding conducted during the F1-G and C-D1 legs of the operational flight. The air sampled during the observational leg after point B2 wassimilarly affected by the cumulative influence of cloudseeding conducted during the B1-C and C-D1 legs ofthe operational flight. By the time the aircraft reachedpoint B2(Fig. 1b), all of the air between point B2 and point J had experienced the effects of cloud seeding.Point J corresponds to the location at which the aircraft intersected the line segment CC0. The aircraftreached this location at 16:55:37 BT. PMS observations from the F2-D2-B2-J(F2-J for short)leg of theflight were therefore selected for evaluating the effectsof the cloud seeding operation. Cloud seeding conducted during the B1-C-D1(B1-D1 for short) and F1G-H1(F1-H1 for short)legs of the flight might haveaffected the air sampled during the F2-J leg.
According to the assumption that transport of theseeding agent was accomplished entirely by the horizontal wind field, the portions of the cloud observedalong the F2-J leg of the flight were approximatelythe same as those observed during the F1-G and B1-C-D1 legs of the flight. Most of the cloud observedduring the F1-G leg did not reach the observationalflight track before the aircraft. Considering "cloud inhomogeneity", observations of cloud conditions duringthe B1-D1 and F1-H1 legs were selected to representthe natural cloud before cloud seeding. The distancebetween the position of this background natural cloud and the portions of the cloud sampled after seedingwas 0-36 km, and the time interval was approximately2-23 min.4. Analysis4.1 Horizontal distribution of cloud microphy-sical parameters
Figure 2 shows the particle concentration, diameter, instantaneous spectrum, and LWC observed alongthe flight path between point A(16:30:11 BT) and point J(16:55:37 BT).
 |
| Fig. 2. Observations of(a)the particle concentration N1 and diameter Dm1 by the FSSP(Forward Scattering Spectrometer Probe), (b)liquid water content by the FSSP(LWCFSSP) and the King probe(LWCKing), (c)the instantaneousparticle spectrum(lg(n(Di)); cm-3 μm-1)by the FSSP, (d)particle concentration N2(>50) and diameter Dm2(>5050)bythe 2DC(Two Dimensional Grey Cloud Optical Array Probe)(D >50 μm), and (e)the instantaneous particle spectrum(lg(n(Di)); L-1 μm-1)by the 2DC(D >50 μm)during seeding and monitoring of the stratocumulus(Sc). See Fig. 1for the locations of points A through J. |
Figure 2a indicates that the cloud particle concentration N1 and diameter Dm1 measured by the FSSPdiffered substantially in the horizontal dimensionwithin the cloud. Differences in N1 reached 3-4 ordersof magnitude. The maximum observed value of N1was more than 100 cm-3, while observations of Dm1ranged from 3.5 to 36.5 μm. The logarithms of N1 and Dm1 were inversely correlated. Areas with high particle concentrations corresponded to areas with high water contents(LWCFSSP). Observed values of Dm1 weretypically smaller but LWCFSSP was typically largerwhen N1 exceeded 10 cm-3(e.g., areas L1-L13 inFigs. 2a and 2b). By contrast, the distribution of Dm1was scattered and the water content was typically lowwhen N1 was less than 1 cm-3. Only a few scatteredcloud particles were observed when the aircraft enteredsparse cloud fields(16:37:24-16:37:54 BT, 16:38:55-16:39:15 BT), with N1 generally less than 0.1 cm-3during these portions of the flight. No cloud particleswere observed in the measuring range of the FSSPwhen the aircraft passed through a rift in the clouds(16:37:55-16:38:54 BT). The instantaneous cloud particle spectrum observed by the FSSP differed substantially between high and low water content areas(Fig. 2c).
The value of the cloud particle concentrationN2(>50)observed by the 2DC was much more uniformthroughout the cloud(Fig. 2d). Values of N2(>50)were generally between 0.1 and 10 L-1. The distribution of Dm2(>5050)was scattered, with the maximumobserved diameter greater than 1000 μm. The rift inthe clouds contained scattered cloud particles withinthe measuring range of the 2DC(N2(>50)t 10-1 L-1;Dm2(>5050)6 125 μm). High values of the particleconcentration distribution function n(Dj)as observedby the 2DC(D > 50 μm)were concentrated in segments of the flight path with smaller median diameters(Dj t 54.88, 79.62, and 104.38 μm)(Fig. 2e). Theparticle concentration distribution function decreasedrapidly in other segments of the flight path(Dj >129.12 μm). The difference in magnitude was relatively small, indicating that N2(>50)was mainly determined by the minimum observable particle diameterDj .
Comparison of the cloud microphysical parameters from the time periods before(points B1-D1 and F1-H1) and after(points H2-J)the cloud seeding operation shows no significant changes in cloud particleconcentration(N1, N2(>50))or the diameter of largeparticles D2(>50). Although the diameter of small particles D1 was somewhat increased after the operation(compare time windows L10-L13 and L1-L7 in Fig. 2a), the magnitude of this change did not exceed natural fluctuations in this parameter within the area ofcloud observed before the operation(A-I).
Figure 2b indicates that variations in LWCFSSP and LWCKing were largely similar throughout thecloud before the operation. However, the peak values of LWCFSSP increased substantially after the operation, while the peak values of LWCKing decreasedsomewhat. The difference between LWCFSSP and LWCKing accordingly increased. This change may becaused by changes in the size distribution and concentration of liquid cloud particles within the cloud. Theseeding response must therefore be analyzed furtherby distinguishing the phase states of cloud particles.In this way, we can effectively distinguish supercooledwater within the cloud seeding area.4.2 Determining the phase states of cloud particles4.2.1 Distinguishing phase states of cloud particles within the measuring range of the 2DC
McFarquhar and Heymsfield(1996)determinedthe phase states of cloud particles with diameters exceeding 125 μm using the gray projection area ratio(AR)of images observed by a 2DC instrument. Theynoted that the AR of liquid cloud particle was greaterthan 0.8, and proposed that AR be used as an index of cloud particle state. Further inspection showedthat this index correctly determined the phase stateof 93% of cloud particles with D > 125 μm(McFarquhar et al., 2007). McFarquhar et al.(2007)further proposed that the phase states of the cloud particles with diameters between 53 and 125 μm observedduring the Mixed-Phase Arctic Cloud Experiment(MPACE)could be determined by assessing whether the2DC image was non-spherical(assuming the absenceof drizzle).
The shapes of 2DC images can be divided intofour categories: spherical, irregular, acicular(including columnar), and dendritic(Korolev and Sussman, 2000). Zhang et al.(2007)referred to large nonspherical particles generated by ice crystal or snowcrystal blooms with supercooled water as "ice and snow crystal blooms", while Fan et al.(2010)referredto large non-irregular solid particles as "ice and snowcrystal polymers".
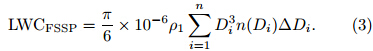
Figure 3 shows cloud particle images taken by the2DC at different times during the operation. Almostall cloud particles with D > 125 μm were irregular icecrystals, columnar ice crystals, dendritic ice crystals, ice and snow crystal polymers, or ice and snow crystalblooms.
 |
| Fig. 3. 2DC cloud particle images taken near the top of the Sc at different times during the operation. |
No spherical particles were identified among particles with 53 μm <D < 125 μm using the judgmentmethod proposed by McFarquhar et al.(2007). Wetherefore conclude that all cloud particles within thissize range were also ice crystals. All cloud particlesnear the top of the Sc with D > 50 μm(Dj > 54.88μm; i.e., within the measuring range of the 2DC)wereice phase particles.
Figure 3 also indicates no significant changes inthe shapes of cloud particle images taken by the 2DCfrom before the operation(Figs. 3a-e)to after theoperation(Figs. 3f-h). Columnar ice crystal particleswith large sizes(Figs. 3d and 3e) and ice and snowcrystal polymers and blooms with large sizes(Figs.3a-h)were observed both before and after operation.This lack of significant change indicates that the coagulation and blooming of ice crystals was relativelyconsistent throughout the operation.4.2.2 Distinguishing phase states of cloud particles within the measuring range of the FSSP
You(1994)used similarity in spectral lines to con-clude that particles with diameters greater than 5 μmin the snowfall ice clouds over Xinjiang during win-ter were ice crystal particles. Comprehensive field observations and research assessments of mixed-phaseclouds in recent years include the use of the Rosemount icing detector(RICE)(Cober et al., 2001; Korolev et al., 2003; McFarquhar and Cober, 2004; McFarquhar et al., 2007)or comprehensive ground radarobservations(Field et al., 2004; Lawson and Zuidema, 2009)to determine the phase states of clouds abovethe 0°C isotherm(e.g., liquid supercooled water cloud, ice-water mixed-phase cloud, and ice cloud). These determinations have then been used to assess the phasestates(liquid and ice phases)of cloud particles withinthe FSSP measuring range based on differences inthe distributions of FSSP spectra in clouds with predetermined phase states. Cober et al.(2001)showedthat ice crystal particles in mixed-phased clouds observed during the first and third Canadian FreezingDrizzle Experiments(CFDEs I and III)typically haddiameters greater than 30 μm. Observations of aCanadian frontal surface-layer cloud system by Korolev et al.(2003)indicated a mean volume diameterof 10-12 μm in liquid supercooled water clouds and 20-35 μm in ice water clouds. By contrast, Field etal.(2004)found mean volume diameters of more than30 μm in both mixed-phase and ice clouds in Britain.These results collectively indicate that the phase statesof cloud particles in different regions and cloud systemsvary greatly.
The optimal value of LWC in liquid or mixedphase ice-water clouds is the value observed by theKing probe(McFarquhar et al., 2007). The liquid water content detected by the FSSP is likely to be influenced by ice crystals within its measuring range(Hu, 2001). LWCFSSP is obtained according to Eq.(3). Itapplies only when all cloud particles within the measuring range of the FSSP are liquid(i.e., below the0°C isotherm). If ice crystals exist within the measuring range of the FSSP, the value of LWCFSSP will bean overestimate of the actual liquid supercooled water content in the cloud. When the concentration ofice crystals in the measuring range of the FSSP is relatively high, this overestimation will be exacerbated(i.e., a relatively large proportion of LWCFSSP will infact be ice). Moreover, even if all cloud particles withinthe measuring range of the FSSP are liquid, if thereare supercooled liquid particles beyond this measuringrange(e.g., within the measuring range of the 2DC), LWCFSSP only represents some of the liquid supercooled water content in part of the cloud. As a consequence, observations of LWCFSSP and LWCKing inactual clouds should differ in certain systematic ways, which may vary based on changes in the concentration and size distribution of liquid cloud particles. Previous studies have shown that these systematic differences exist in observed clouds(Qi et al., 2007).
When ice coexists with water, the size of waterdrops is small compared to the size of ice crystals(Hu, 2001). Time series of the instantaneous particle sizespectrum and changes in cloud particles can be usedto more comprehensively determine the status of cloudparticle distributions in different measurement channels and the information about real-time variations.Here, we determine the phase states of cloud particles in the measuring range of the FSSP from the coevolution of observations of the instantaneous particlespectrum, LWCFSSP and LWCKing.
Figure 2b suggests clear differences betweenLWCFSSP and LWCKing in areas of the cloud whereLWCFSSP is high. For instance, LWCFSSP is very closeto LWCKing in the L3 domain. The instantaneousspectrum observed by the FSSP(Fig. 2c)indicatesa continuous distribution of particles within the sizerange 3.5 μm ≤ Di ≤ 18.5 μm within this domain.LWCFSSP and LWCKing are also relatively close withinthe L4, L7, L1, and L13 domains. Cloud particles inthese domains are also continuously distributed withinthe size range 3.5 μm ≤ Di ≤ 18.5 μm inside the measuring range of the FSSP, but there are also scatteredparticles with Di > 21.5 μm. LWCFSSP is far greaterthan LWCKing in other domains with supercooled water(L2, L5, L6, and L8-L12), where the distributionof cloud particles is discontinuous and n(Di)is highin the Di > 21.5 μm measurement channel. Comparison of the instantaneous spectrums measured by theFSSP in areas with large amounts of supercooled water areas reveals that the differences between LWCKing and LWCFSSP are largely attributable to differencesin n(Di)outside of the 3.5 μm ≤ Di ≤ 18.5 μmmeasurement channels. We therefore speculate thatliquid supercooled water near the top of the Sc maybe distributed primarily within the size range 3.5 μm6 Di 6 18.5 μm.
The liquid water content observed by FSSP in th3.5 μm ≤ Di ≤ 18.5 μm measurement channels(expressed as LWCFSSP(3:5-18:5))can be calculated using Eq.(3). Figure 4 shows the comparison betweenLWCFSSP(3:5-18:5) and LWCKing. The lower limit ofthe King probe is 0.01 g m-3(Tessendorf et al., 2012);accordingly, the data shown in Fig. 4 are restricted tolocations for which LWCKing > 0.01 g m-3.
 |
| Fig. 4. Scatter diagram and linear correlation of LWCKing and LWCFSSP(3:5-18:5) at the top of Sc. |
The linear correlation coeficient betweenLWCFSSP(3:5-18:5) and LWCKing in the cloud areawith LWCKing > 0.01 g m-3 was R2 = 0.932(statistically significant at the ff = 0.05 confidence level). Thisresult indicates that LWCFSSP(3:5-18:5) and LWCKingare linearly correlated. Moreover, the slope of thelinear fit of LWCFSSP(3:5-18:5) to LWCKing is approximately 1, which also indicates a close relationshipbetween LWCFSSP(3:5-18:5) and LWCKing. The valueof LWCFSSP(3:5-18:5) in these areas of the cloud isgenerally within ±15% of LWCKing, comparable tothe error of the instrument.
The difference between LWCFSSP(3:5-18:5) and LWCKing is substantially larger in areas whereLWCKing < 0.01 g m-3(figure omitted). This difference may result from the detection threshold of theKing probe. Moreover, Figs. 2b and 2c indicate smalldifferences in n(Di) among various Di and slightlydiscontinuous distributions of cloud particles withinthe 3.5 μm ≤ Di ≤ 18.5 μm measurement channelsin these areas of the cloud. The phase states of cloudparticles within the measuring range of the FSSP inareas of the cloud with LWCKing < 0.01 g m-3 aretherefore uncertain.
The above analysis indicates that cloud particleswithin the measuring range of the FSSP at the top ofSc are generally liquid cloud particles within the sizerange 3.5 μm ≤ Di ≤ 18.5 μm and ice particles withinthe size range 21.5 μm ≤ Di ≤ 45.5 μm. The relativesizes of liquid and ice(or solid)phase cloud particleswere not affected by the seeding operation.4.3 Changes in the concentrations of liquid and ice cloud particles within the measuring range of the FSSP
Hobbs defined the cloud-water area as the areain which the concentration of particles with D largerthan 2 μm exceeds 10 cm-3(You, 1994; Zhang et al., 2012). High values of LWC at the top of the Sc inthis experiment correspond well to values of N1 thatexceed 10 cm-3. Taking into account the characteristics of changes in the concentration and instantaneousspectrum of cloud particles observed by the FSSP and the LWC observed by the King probe, we define thearea where both LWCFSSP and LWCKing(taken together as LWC)exceed 0.01 g m-3 as the "high su-percooled water area". Similarly, we define the cloudarea with 0.01 g m-3 > LWC > 10-4 g m-3 as the"low supercooled water area".
The area traversed by the flight legs before(B1D1 and F1-H1) and after(F2-J)the operation ismostly high supercooled water area(Fig. 2). Based onour assessment of the phase states of cloud particles inthe measuring range of FSSP(see Section 4.2.2), theconcentrations of cloud particles(N1w) and ice crystals(N1i)within the measuring range of the FSSP canbe expressed by the concentrations of cloud particlesin the 3.5 μm ≤ Di ≤ 18.5 μm and 21.5 μm 6 Di 645.5 μm, respectively. Here, we estimate N1w and N1iusing Eq.(1)as expressed below:
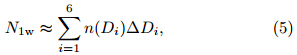
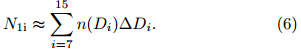
Figure 5 shows the changes of N1w and N1i withtime both before(B1-D1 and F1-H1) and after(F2J)the operation. The concentration of liquid cloudparticles N1w after the operation in the high supercooled water areas L10, L11, and L12 was substantiallysmaller relative the concentration of liquid cloud particles in the high supercooled water areas L1, L2, and L4-L8 before the operation. Conversely, N1i was substantially larger after the operation from before. Thisoverall change in the phase of cloud particles explainsthe lack of obvious changes in microphysical parameters such as concentration(N1) and mean diameter(Dm1)as measured by the FSSP before and after theoperation. The peak values of N1w in high supercooledwater areas before the operation were approximately102 cm-3. The values of N1w in high supercooled water areas(L10, L11, and L12)after the operation wereless than 10 cm-3, for a difference of approximatelyone order of magnitude. Values of N1i in high supercooled water areas before the operation were approximately 0.1-2 cm-3. These values increased toapproximately 1-6 cm-3 after the operation. Moreover, none of the high supercooled water areas observed after cloud seeding were similar to areas L2 orL4, where ice crystal particle concentrations were almost zero prior to the operation. These changes werenot observed in the high supercooled water area L13(close to point J). This lack of change may be relatedto the location of point J, which is located at the edgeof the seeding impact region(Fig. 1). Concentrationsof N1w and N1i within low supercooled water areas didnot change significantly after the cloud seeding operation.
 |
| Fig. 5. Concentrations of liquid cloud particles(N1w) and ice crystals(N1i)within the measuring range of the FSSP(a, b)before and (c)after the operation. See Fig. 2 for the definition of the high supercooled water areas L1-L2, L4-L8, and L11-L13. |
Changes in the cloud particle spectrum during a cloud seeding operation are the most direct metric forevaluating the effectiveness of seeding(Wang et al., 1987; Chen et al., 1992; Wang and Lei, 2003; Jin et al., 2007). The instantaneous spectra observed by theFSSP(Fig. 2c)indicate that the range of Di in areaswith high quantities of supercooled water before theoperation is relatively small. This range increases tosome extent after the operation in high supercooledwater areas, but no such change is observed in low supercooled water areas. The mean cloud particle spectra in high and low supercooled water area before and after the operation are shown in Fig. 6. Comparisonof these spectra allows us to evaluate the effects of thecloud seeding in cloudy areas with different concentrations of supercooled water. The mean distributionsbefore the operation(B1-D1 and F1-H1)are calculated based on 16 samples in high supercooled waterareas with LWC > 0.03 g m-3, 58 samples in high supercooled water areas with LWC > 0.02 g m-3, 271samples in high supercooled water areas with LWC >0.01 g m-3, and 372 samples in low supercooled waterareas with 0.01 g m-3 > LWC > 10-4 g m-3. Themean distributions after the operation(F2-J)are calculated based on 323 samples.
Figure 6a shows a distinct difference betweenmean cloud particle spectra in high supercooled water areas observed by the FSSP before and after theoperation. The mean spectrum observed in high supercooled water areas with LWC > 0.03 g m-3 beforethe operation is a ¡-type distribution with a singlepeak located at Di = 9.5 μm. The magnitude of n(Di)at this peak location increased with increasing liquidwater content. The distribution of the mean spectrumis much more uniform after the operation. The threemean spectra observed in high supercooled water areas before the operation intersect with the mean spectrum observed after the operation near the 18.5-21.5μm size bins. The difference in the magnitude of themean n(Di)observed after the operation in size bins tothe right and left of the intersection point is small, reflecting the uniformity of the distribution. Differencesbetween the mean cloud particle spectra observed inthe low supercooled water area before the operation and the total cloud area after the operation are alsosmall.
 |
| Fig. 6. Mean cloud particle spectra in high and low supercooled water areas before(B1-D1 and F1-H1) and after(F2-J)the cloud seeding operation based on observations using(a)the FSSP(2 μm < D < 47 μm) and (b)the 2DC(D > 50 μm). |
Figure 6b indicates that there is no distinct difference between the mean particle spectra in high and low supercooled water areas before or after the operation in the measuring range of the 2DC(D > 50 μm).Changes in these spectra after the operation do notexceed natural fluctuations in cloudy areas before theoperation.
These results support those presented in Section4.3. In particular, the concentration of liquid cloudparticles(3.5 μm ≤ Di ≤ 18.5 μm)decreases substantially and the concentration of small ice crystals(21.5 μm ≤ Di ≤ 45.5 μm)increases substantially after cloud seeding in areas directly downwind of locations where high concentrations of supercooled waterwere observed before the operation. Cloud seedingappears to have no effect on cloud particle spectra inareas downwind of locations where low concentrations of supercooled water were observed. These results alsoindicate that the supercooled water content in highsupercooled water areas is mainly determined by thewater content of cloud particles with Di t 9.5 μm.4.4.2 Cloud particle spectra at the flight track intersection points H1 and H2 before and after the operation
The time interval between the before and afterobservations of the flight track intersection points H1 and H2 is only 131 s. The vertical positions of theaircraft at points H1 and H2 are both located with inthe supercooled water area. H2 can only be impactedby catalyzed diffusion from the original position H1(Fig. 1a). The speed of the aircraft is one order ofmagnitude higher than the horizontal winds at the observing level, hence the movement of the cloud duringthis time interval can effectively be factored out. Thecloud particle spectra at this location before and afterthe operation are shown in Fig. 7. Changes in thesespectra indicate the catalytic response to cloud seeding at the original position. The GPS readings are updated at a rate of 0.2 s-1 and the sampling frequencyof the PMS is 1 s-1. Therefore, the PMS cloud particle spectrum at each flight track intersection pointis based on an average of five observational samplescentered on the GPS time.
 |
| Fig. 7. Cloud particles spectra at the flight track intersection points H1 and H2 observed by(a)the FSSP(2 μm < D <47 μm) and (b)the 2DC(D > 50 μm). |
Neither the particle spectrum observed by theFSSP nor the particle spectrum observed by the 2DCshow any significant changes between H1 and H2. Inparticular, we do not observe a catalytic response similar to that of the high supercooled water areas analyzed in Section 4.4.1. This result indicates that themicrophysical response to cloud seeding observed inhigh supercooled water areas does not appear solelyby rapid catalytic diffusion.4.5 Changes in the fraction of liquid water in high supercooled water areas after the operation
The fraction of liquid water fl is defined as theratio of LWC to total water content(TWC)(i.e., fl=LWC/TWC)(McFarquhar et al., 2007). TWCis defined as the sum of LWC and ice water content(IWC).
IWC can be calculated according to Eq.(4). Theresults presented in Sections 4.1 and 4.2 indicate thatthe microphysical characteristics of the autumn stratocumulus cloud observed during this campaign in theSanjiangyuan region are very similar to those of mixedlower cumulus clouds observed in Alaska(McFarquhar et al., 2007). However, the regression coe°cients defined during the Alaska campaign(a=1.07£10-10 gμm-1:7 and b=1.7)only apply to ice phase particleswith diameters(D)greater than 125 μm(Dj > 129.12μm; j > 5). For non-spherical ice crystal particles withdiameters between 53 and 125 μm(54.88 μm 6 Dj 6104.38 μm; j= 2, …, 4), we adopt the regression coefficients a=0.04 and b=3(the units are not converted).These regression coe°cients were derived by You etal.(1989)based on observations of winter stratiformclouds over Xinjiang. These clouds were also in the icephase, with cloud particle spectra and similar n(Dj)as the cloud we observed over Sanjiangyuan. We assume that ice crystal particles measured by the FSSP(Di between 21.5 and 45.5 μm)were spherical for easeof calculation. The IWC(unit: g m-3)can then becalculated as
where ρi is the density of ice water(unit: g m-3).IWCk(k=1, …, 60)represents IWC that was measured by the FSSP and 2DC within measurementchannels with central values ranging from Di=21.5 μmto Dj=1300 μm. LWC is taken as the value measuredby the King probe(McFarquhar et al., 2007). Thefraction of liquid water fl can then be expressed asFigure 8 shows the variations of IWCk, IWC, TWC, and fl over time both before(B1-D1 and F1-H1) and after the operation(F2-J). The phase state of cloudparticles within the measuring range of the FSSP isuncertain(see Section 4.2.2); the values of fl shownin Fig. 8 are therefore restricted to only high supercooled water areas.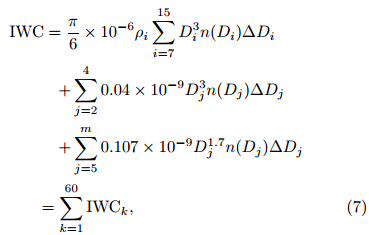

Figures 8a1, 8b1, and 8c1 show that the IWCk ofice phase particles with larger median diameters(Dj >400 μm)is higher than the IWCk of ice phase particle with smaller median diameters(129.12-400 μm). This difference is due to the small magnitude of differences in n(Dj)for cloud ice particles with diameterslarger than 129.12 μm. Differences in n(Dj)amongcloud particles with diameters between 54.88 and 129.12 μm and cloud particles with diameters largerthan 129.12 μm are much larger. As a result, theIWCk of cloud particles with diameters between 54.88 and 129.12 μm is substantially higher than that ofcloud particles with diameters larger than 129.12 μm.The concentration of cloud particles with diametersbetween 21.5 and 45.5 μm is one order of magnitude higher than the concentration of cloud particleswith diameters greater than 54.88 μm. The form ofice crystal particles in these two size ranges is alsodifferent. The ice water content in the smaller sizebins IWC(21:5-45:5)is therefore one order of magnitude higher than the ice water content in the larger sizebins IWC(>50). This difference indicates that IWC ismainly determined by the concentration of cloud particles with diameters between 21.5 and 45.5 μm. Valuesof IWCk for particles with Dj > 54.88 μm did notchange significantly after the cloud seeding operation.Changes in IWC during the operation are thereforemainly determined by changes in the concentrationof cloud ice crystals with diameters between 21.5 and 45.5 μm.
 |
| Fig. 8. Temporal variations of(a1)the ice water content spectrum IWCk(unit: g m-3) and (a2)ice water content(IWC), total water content(TWC) and the fraction of liquid water(fl)in high supercooled water areas during theB1-D1 flight leg before the operation.(b1)-(b2) and (c1)-(c2)show the same quantities as(a1)-(a2), but(b1)-(b2)show the H1-F1(before the operation) and (c1)-(c2)show the F2-J flight leg(after the operation). |
Comparison of Figs. 8a2, 8b2, and 8c2 suggeststhat the IWC in the initial high supercooled water areas increased significantly after the cloud seeding operation. This change is reflected in the increase inTWC and the decrease in fl following cloud seeding.The mean and st and ard deviation of fl in high supercooled water areas before the operation(B1-D1 and F1-H1; 271 samples)was 68.3±23.1%. These valuesdecreased to 34.2±12.4% after the operation(F2-J;101 samples).5. Conclusions and discussion
Aircraft observations of cloud microphysical properties collected before and after a single-level cloudseeding operation at the top of a stratocumulus cloudover the Sanjiangyuan region of China have been usedto quantify and evaluate the effects of the operation.The flight path was selected to allow observation ofsections directly downwind of the initial line source.The phase states of observed cloud particles havebeen distinguished, the concentrations of liquid and ice cloud particles have been analyzed, and changes incloud particle size spectra and the ratio of liquid water content to total water content have been assessed.These microphysical responses were observed within36 km downwind of the line source between 2 and 23min after the cloud seeding operation was performed.The main conclusions are as follows.
Cloud particles with inner diameters exceeding 50μm(i.e., within the measuring range of the 2DC)weredetermined to be exclusively ice phase particles using2DC image and image gray projections. The phasestates of smaller cloud particles(within the measuringrange of the FSSP)have also been discriminated usingthe relationship between the effective liquid water content and instantaneous cloud particle spectra observedby the FSSP(which is sensitive to the presence of iceparticles) and the actual liquid water content observedby the King probe(which is not sensitive to the presence of ice particles). The results of this discrimination indicate that cloud particles in this stratocumuluscloud over Sanjiangyuan with a median diameter(Di)between 3.5 and 18.5 μm were typically in the liquidphase. Cloud particles with Di between 21.5 and 45.5μm(observed by the FSSP) and cloud particles withdiameters greater than 50 μm(observed by the 2DC)were typically in the ice phase.
Analysis of the observations indicates thatchanges in most microphysical features(such as theconcentrations and diameters of cloud particles observed by the FSSP and 2DC)after the cloud seedingoperation did not exceed natural fluctuations observedbefore the operation. However, the concentrations ofliquid cloud particles in areas with large amounts ofsupercooled water(LWC > 0.01 g m-3)decreased draically, while the concentration of small ice crystals in these same regions(21.5 μm ≤ Di ≤ 45.5 μm)increased substantially. Instantaneous cloud particlespectra observed by the FSSP also changed considerable after the operation. The catalytic response tocloud seeding was stronger in areas with higher initial proportions of liquid water content. This microphysical response was not observed in areas withsmall initial amounts of supercooled water, nor wasit apparent near the location where the aircraftturned around(where observations of the cloud following seeding were most closely collocated with therelease of the catalyst in space and time). The liquid water in high supercooled water areas decreased following the operation, while the ice water content and total water content in these areas increased substantially. The average value of the liquid water fraction(the ratio of liquid water content to total water content)in high supercooled water areas decreased from(68.3±23.1)% before the operation to(34.2±12.4)%after the operation.
The results of this study indicate that values ofLWC(LWCFSSP or LWCKing)> 0.01 g m-3 can betaken as a key quantitative indicator of the potentialeffectiveness of artificial precipitation operations in autumn stratiform clouds over the Sanjiangyuan region, where the Yangtze, Yellow, and Mekong rivers originate. The method used in this study to differentiatethe phase states of cloud particles within the measuring range of the FSSP measuring range only appliesto observations of mixed-phase clouds containing liquid cloud particles with mean diameters less than 47μm, and is highly uncertain in cloudy areas with liquidwater contents less than 0.01 g m-3. Further verification using additional observations will be required toconfirm the results.
The region covered during the backward-forwarddetection phase after cloud seeding was relatively narrow and the time frame was relatively short. Rain occurred approximately 40 minutes after this detectionphase, creating a blank period of missing observations.Additional observational studies and numerical simulations are needed to further examine the "physicalevent chain" that follows the release of an AgI catalyst. Particular attention should be paid to the mechanisms behind the increase in small ice crystal particles and the careful construction of a plan to detect and confirm the extent of the area influenced by the cloudseeding operation.
| [1] | Baumgardner, D., and A. Korolev, 1997: Airspeed corrections for optical array probe sample volumes. J. Atmos. Oceanic Technol., 14(5), 1224-1229. |
| [2] | Brown, P. R. A., and P. N. Francis, 1995: Improved measurements of the ice water content in cirrus using a total-water probe. J. Atmos. Oceanic Technol., 12(2), 410-414. |
| [3] | Bruintjes, R. T., 1999: A review of cloud seeding experiments to enhance precipitation and some new prospects. Bull. Amer. Meteor. Soc., 80(5), 805-820. |
| [4] | Chen Wankui, Yan Caifan, Wu Xinsui, et al., 1992: An experiment on supercooled lower cloud dissipation by seeding AgI. J. Appl. Meteor. Sci., 3(S1), 59-66. (in Chinese) |
| [5] | Cober, S. G., G. A. Isaac, A. V. Korolev, et al., 2001: Assessing cloud-phase conditions. J. Appl. Meteor., 40(11), 1967-1983. |
| [6] | Coelho, A. A., J. L. Brenguier, and T. Perrin, 2005: Droplet spectra measurements with the FSSP-100. Part Ⅱ: Coincidence effects. J. Atmos. Oceanic Technol., 22(11), 1756-1761. |
| [7] | Dai Jin, Yu Xing, D. Rosenfeld, et al., 2006: Analysis of satellite observed microphysical signatures of cloud seeding tracks in supercooled layer clouds. Acta Meteor. Sinica, 64(5), 622-630. (in Chinese) |
| [8] | DeMott, P. J., 1995: Quantitative descriptions of ice formation mechanisms of silver iodide-type aerosols. Atmos. Res., 38, 63-99. |
| [9] | Deshler, T., D. W. Reynolds, and A. W. Huggins, 1990: Physical response of winter orographic clouds over the Sierra Nevada to airborne seeding using dry ice or silver iodide. J. Appl. Meteor., 29(4), 288-330. |
| [10] | Fan Ye, Guo Xueliang, Zhang Dianguo, et al., 2010: Airborne particle measuring system measurement on structure and size distribution of stratocumulus during August and September in 2004 over Beijing and its surrounding areas. Chinese J. Atmos. Sci., 34(6), 1187-1200. (in Chinese) |
| [11] | Feind, R. E., A. G. Detwiler, and P. L. Smith, 2000: Cloud liquid water measurements on the armored T-29: Intercomparison between Johnson-Williams cloud water meter and CSIRO (King) liquid water probe. J. Atmos. Oceanic Technol., 17, 1630-1638. |
| [12] | Field, P. R., R. J. Hogan, P. R. A. Brown, et al., 2004: Simultaneous radar and aircraft observations of mixedphase cloud on the 100-m scale. Quart. J. Roy. Meteor. Soc., 130(600), 1877-1904. |
| [13] | Guo Xueliang, Fu Danhong, and Hu Zhaoxia, 2013: Progress in cloud physics, precipitation, and weather modification during 2008-2012. Chinese J. Atmos. Sci., 37(2), 351-363, doi: 10.3878/j.issn.1006-9895.2012.12321. (in Chinese) |
| [14] | Heymsfield, A. J., S. Lewis, A. Bansemer, et al., 2002: A general approach for deriving the properties of cirrus and stratiform ice cloud properties. J. Atmos. Sci., 59(1), 3-29. |
| [15] | Hobbs, P. V., and L. F. Radke, 1975: The nature of winter clouds and precipitation in the Cascade Mountains and their modification by artificial seeding. Part Ⅱ: Techniques for the physical evaluation of seeding. J. Appl. Meteor., 14(5), 805-818. |
| [16] | Hu Guangyin, Dong Zhibao, Lu Junfeng, et al., 2011: Spatial and temporal changes of desertification land and its influence factors in source region of the Yellow River from 1975 to 2005. Journal of Desert Research, 31(5), 1079-1086. (in Chinese) |
| [17] | —-, —-, —-, et al., 2012: Land desertification and landscape pattern change in the source region of Yangtze River. Journal of Desert Research, 32(2), 314-322. (in Chinese) |
| [18] | Hu Zhijin, 2001: Discussion on mechanisms, conditions and methods of precipitation enhancement in stratiform clouds. J. Appl. Meteor. Sci., 12(Suppl.), 10-13. (in Chinese) |
| [19] | Huggins, A. W., and K. Sassen, 1990: A high altitude ground-based cloud seeding experiment conducted in southern Utah. J. Wea. Mod., 22, 18-29. |
| [20] | Isaac, G. A., 1991: Microphysical characteristics of Canadian Atlantic storms. Atmos. Res., 26, 339-360. |
| [21] | Jin Dezhen, Lei Hengchi, Zheng Jiaoheng, et al., 2007: Observation research on cloud microphysics and precipitation affection of stratiform cloud seeding by liquid carbon dioxide. Chinese J. Atmos. Sci., 31(1), 99-108. (in Chinese) |
| [22] | King, W. D., J. E. Dye, D. Baumgardner, et al., 1985: Icing wind tunnel tests on the CSIRO liquid water probe. J. Atmos. Oceanic Technol., 2(3), 340-352. |
| [23] | Korolev, A., and B. Sussman, 2000: A technique for habit classification of cloud particles. J. Atmos. Oceanic Technol., 17(8), 1048-1057. |
| [24] | Korolev, A. V., J. W. Strapp, and G. A. Isaac, 1998: Evaluation of the accuracy of PMS optical array probes. J. Atmos. Oceanic Technol., 15(3), 708-720. |
| [25] | —-, G. A. Isaac, S. G. Cober, et al., 2003: Microphysical characterization of mixed-phase clouds. Quart. J. Roy. Meteor. Soc., 129(587), 39-65. |
| [26] | Lawson, R. P., and P. Zuidema, 2009: Aircraft microphysical and surface-based radar observations of summertime Arctic clouds. J. Atmos. Sci., 66(12), 3505-3529. |
| [27] | Li Lin, Li Fengxia, Guo Anhong, et al., 2006: Study on the climate change trend and its catastrophe over “Sanjiangyuan” region in recent 43 years. Journal of Natural Resources, 21(1), 79-85. (in Chinese) |
| [28] | Li Shengchen, Li Dongliang, Zhao Ping, et al., 2009: The climatic characteristics of vapor transport in rainy season of the origin area of three rivers in QinghaiXizang Plateau. Acta Meteor. Sinica, 67(4), 591-598. (in Chinese) |
| [29] | Li Zhaorong, Li Rongqing, and Li Baozi, 2003: Analyses on vertical microphysical characteristics of autumn stratiform cloud in Lanzhou region. Plateau Meteor., 22(6), 583-589. (in Chinese) |
| [30] | Lian Lishu, Shu Jiong, and Li Chaoyi, 2009: The impacts of grassland degradation on regional climate over the origin area of three rivers in Qinghai-Tibetan Plateau, China. Acta Meteor. Sinica, 67(4), 580-590. (in Chinese) |
| [31] | Liu Shijun, Hu Zhijin, and You Laiguang, 2005: The numerical simulation of AgI nucleation in cloud. Acta Meteor. Sinica, 63(1), 30-40. (in Chinese) |
| [32] | Liu Weiguo, Su Zhengjun, Wang Guanghe, et al., 2003: Development and application of new-generation airborne particle measuring system. J. Appl. Meteor. Sci., 14(Suppl.), 11-18. (in Chinese) |
| [33] | McFarquhar, G. M., and A. J. Heymsfield, 1996: Microphysical characteristics of three anvils sampled during the Central Equatorial Pacific Experiment. J. Atmos. Sci., 53(17), 2401-2423. |
| [34] | —-, and S. G. Cober, 2004: Single-scattering properties of mixed-phase Arctic clouds at solar wavelengths: Impacts on radiative transfer. J. Climate, 17(19), 3799-3813. |
| [35] | —-, G. Zhang, M. R. Poellot, et al., 2007: Ice properties of single-layer stratocumulus during the MixedPhase Arctic Cloud Experiment: 1. Observations. J. Geophys. Res., 112(D24), D24201. |
| [36] | Miles, N. L., J. Verlinde, and E. E. Clothiaux, 2000: Cloud droplet size distributions in low-level stratiform clouds. J. Atmos. Sci., 57(2), 295-311. |
| [37] | Mitchell, D. L., 1996: Use of massand area-dimensional power laws for determining precipitation particle terminal velocities. J. Atmos. Sci., 53(12), 1710-1723. |
| [38] | Qi Yanbin, Guo Xueliang, and Jin Dezhen, 2007: An observational study of macro/microphysical structures of convective rainbands of a cold vortex over Northeast China. Chinese J. Atmos. Sci., 31(4), 621-634. (in Chinese) |
| [39] | Reinking, R. F., and R. J. Meitin, 1989: Recent progress and needs in obtaining physical evidence for weather modification potentials and effects. J. Wea. Mod., 21, 85-93. |
| [40] | Reynolds, D. W., 1988: A report on winter snowpackaugmentation. Bull. Amer. Meteor. Soc., 69(11), 1291-1300. |
| [41] | —-, and A. S. Dennis, 1986: A review of the Sierra Cooperative Pilot Project. Bull. Amer. Meteor. Soc., 67(5), 513-523. |
| [42] | Rosenfeld, D., X. Yu, and J. Dai, 2005: Satellite-retrieved microstructure of AgI seeding tracks in supercooled layer clouds. J. Appl. Meteor., 44(6), 760-767. |
| [43] | Ryan, B. F., and W. D. King, 1997: A critical review of the Australian experience in cloud seeding. Bull. Amer. Meteor. Soc., 78(2), 239-354. |
| [44] | Smith, P. L., A. S. Dennis, B. A. Silverman, et al., 1984: HIPLEX-1: Experimental design and response variables. J. Appl. Meteor., 23(4), 497-512. |
| [45] | Stewart, R. E., and J. D. Marwitz, 1982: Microphysical effects of seeding wintertime stratiform clouds near the Sierra Nevada mountains. J. Appl. Meteor., 21(6), 874-880. |
| [46] | Strapp, J. W., F. Albers, A. Reuter, et al., 2001: Laboratory measurements of the response of a PMS OAP-2DC. J. Atmos. Oceanic Technol., 18(7), 1150-1170. |
| [47] | —-, J. Oldenburg, R. Ide, et al., 2003: Wind tunnel measurements of the response of hot-wire liquid water content instruments to large droplets. J. Atmos. Oceanic Technol., 20(6), 791-806. |
| [48] | Super, A. B., 1990: Winter orographic cloud seeding status in the intermountain west. J. Wea. Mod., 22, 106-116. |
| [49] | —-, and B. A. Boe, 1988: Microphysical effects of wintertime cloud seeding with silver iodide over the Rocky Mountains. Part ⅡI: Observations over the Grand Mesa, Colorado. J. Appl. Meteor., 27(10), 1166-1182. |
| [50] | —-, and J. A. Heimbach, Jr., 1988: Microphysical effects of wintertime cloud seeding with silver iodide over the Rocky Mountains. Part Ⅱ: Observations over the Bridger Range, Montana. J. Appl. Meteor., 27(10), 1152-1165. |
| [51] | Tang Hongyu, Yang Xiaodan, Wang Xijuan, et al., 2007: Analyses of precipitation change in the source regions of Three Rivers during 1956-2004. Plateau Meteor., 26(1), 47-54. (in Chinese) |
| [52] | Tessendorf, S. A., R. T. Bruintjes, C. Weeks, et al., 2012: The Queensland cloud seeding research program. Bull. Amer. Meteor. Soc., 93(1), 75-90. |
| [53] | Wang Baizhong, Liu Weiguo, Wang Guanghe, et al., 2004: Principles of KLWC-5 liquid water content guage and its application in cloud seeding. Meteor. Sci. Technol., 32(4), 294-296. (in Chinese) |
| [54] | Wang Qian, You Laiguang, and Hu Zhijin, 1987: The study on the winter stratocumulus cloud over Urumqi, Xinjiang, China—Structure and evolution. Acta Meteor. Sinica, 45(1), 2-12. (in Chinese) |
| [55] | Wang Xiaobin, Mao Jietai, Zheng Guoguang, et al., 2006: Application of new airborne AgI flare seeding generator to precipitation enhancement with aircraft. Meteor. Sci. Technol., 34(1), 93-96. (in Chinese) |
| [56] | Wang Yilin and Lei Hengchi, 2003: Test of cold cloud seeding. Chinese J. Atmos. Sci., 27(5), 929-938. (in Chinese) |
| [57] | Yao Zhanyu, 2006: Review of weather modification research in Chinese Academy of Meteorological Sciences. J. Appl. Meteor. Sci., 17(6), 786-795. (in Chinese) |
| [58] | You Laiguang, 1994: A study of cloud physical and seedability of artificial precipitation with particle measuring system. The Study on Cloud and Precipitation Physics and Precipitation Enhancement Techniques. You Jingyan, Duan Ying, and You Laiguang, Eds., China Meteorological Press, Beijing, 236-249. (in Chinese) |
| [59] | —-, Wang Shourong, Wang Dingfeng, et al., 1989: The microphysical structure of snow cloud and the growth process of snow in winter in Xinjiang. Acta Meteor. Sinica, 47(1), 73-81. (in Chinese) |
| [60] | Yu Xing, Wang Xiaoling, and Dai Jin, 2002: Research on simulation of effective range for cloud seeding by aircraft within super-cooled stratus. Acta Meteor. Sinica, 60(2), 205-214. (in Chinese) |
| [61] | Zhang Dianguo, Guo Xueliang, Fu Danhong, et al., 2007: Aircraft observation on cloud microphysics in Beijing and its surrounding regions during AugustSeptember 2003. Chinese J. Atmos. Sci., 31(4), 596-610. (in Chinese) |
| [62] | Zhang Yu, Yin Yan, Shi Lixin, et al., 2012: Analysis of cloud microphysics structure over Hebei region during Autumn of 2007. Plateau Meteor., 31(2), 530-537. (in Chinese) |
| [63] | Zhao Zengliang, Mao Jietai, Wei Qiang, et al., 2010: A study of vertical structure of spring stratiform clouds in Northwest China. Meteor. Mon., 36(5), 71-77. (in Chinese) |